Subhaloes gone Notts: subhaloes as tracers of the dark matter halo shape
Kai Hoffmann,
1‹Susana Planelles,
2,3Enrique Gazta˜naga,
1Alexander Knebe,
4Frazer R. Pearce,
5Hanni Lux,
5,6Julian Onions,
5Stuart I. Muldrew,
5,7Pascal Elahi,
8,9Peter Behroozi,
10Yago Ascasibar,
4Jiaxin Han,
8,11Michal Maciejewski,
12Manuel E. Merchan,
13Mark Neyrinck,
14Andr´es N. Ruiz
13and Mario A. Sgro
131Institut de Ci`encies de l’Espai (ICE, IEEC/CSIC), E-08193 Bellaterra (Barcelona), Spain 2Astronomy Unit, Department of Physics, University of Trieste, via Tiepolo 11, I-34131 Trieste, Italy 3INAF, Osservatorio Astronomico di Trieste, via Tiepolo 11, I-34131 Trieste, Italy
4Departamento de F´ısica Te´orica, M´odulo 15, Facultad de Ciencias, Universidad Aut´onoma de Madrid, E-28049 Madrid, Spain 5School of Physics & Astronomy, University of Nottingham, Nottingham NG7 2RD, UK
6Department of Physics, University of Oxford, Denys Wilkinson Building, Keble Road, Oxford OX1 3RH, UK 7Department of Physics and Astronomy, University of Leicester, University Road, Leicester, LE1 7RH, UK
8Key Laboratory for Research in Galaxies and Cosmology, Shanghai Astronomical Observatory, Shanghai 200030, China 9Institute for Astronomy, The University of Sydney, NSW 2006, Australia
10Space Telescope Science Institute, Baltimore, MD 21218, USA
11Institute for Computational Cosmology, Department of Physics, Durham University, South Road, Durham DH1 3LE, UK 12Max-Planck-Institut f¨ur Astrophysik, Garching, Karl-Schwarzschild-Straße 1, D-85741 Garching bei Muenchen, Germany 13Instituto de Astronom´ıa Te´orica y Experimental (CCT Cordoba, CONICET, UNC), Laprida 922, X5000BGT Cordoba, Argentina 14Department of Physics and Astronomy, The Johns Hopkins University, 3400 N. Charles St, Baltimore, MD 21218, USA
Accepted 2014 May 8. Received 2014 April 17; in original form 2014 January 19
A B S T R A C T
We study the shapes of subhalo distributions from four dark-matter-only simulations of Milky Way-type haloes. Comparing the shapes derived from the subhalo distributions at high res-olution to those of the underlying dark matter fields, we find the former to be more triaxial if the analysis is restricted to massive subhaloes. For three of the four analysed haloes, the increased triaxiality of the distributions of massive subhaloes can be explained by a systematic effect caused by the low number of objects. Subhaloes of the fourth halo show indications for anisotropic accretion via their strong triaxial distribution and orbit alignment with respect to the dark matter field. These results are independent of the employed subhalo finder. Comparing the shape of the observed Milky Way satellite distribution to those of high-resolution subhalo samples from simulations, we find agreement for samples of bright satellites, but significant deviations if faint satellites are included in the analysis. These deviations might result from observational incompleteness.
Key words: methods: numerical – galaxies: haloes – cosmology: miscellaneous.
1 I N T R O D U C T I O N
The modelling of how galaxies trace the underlying matter field is one of the biggest uncertainties in observational cosmology. Un-derstanding the relation between the distributions of galaxies and matter at small scales, such as those of galaxy groups and clusters, turns out to be difficult due to the non-linear evolution of matter density fluctuations and the complex processes involved in galaxy formation. However, it is worth addressing this challenge as mod-elling the galaxy distribution at these scales increases the statistical power of cosmological surveys. Furthermore, it opens the
E-mail:[email protected]
ity of comparing model predictions to the well-observed properties of our local Universe.
The host haloes of galaxy groups and clusters can be character-ized by their radial density profiles and their triaxiality. In this study, we are interested in the latter property as we analyse the relation between the shape of dark matter (DM) haloes obtained from high-resolution simulations and their subhalo populations. The relation between these shapes is relevant for the Halo Occupation Distribu-tion models, which are used to predict and interpret observaDistribu-tional data. In these models, satellite galaxies are distributed in host haloes with an assumed ellipticity. This ellipticity has an impact on the cor-relation functions derived from these models (e.g. Smith & Watts 2005; Smith, Watts & Sheth2006; van Daalen, Angulo & White 2012).
Observations of the local Universe suggest that the shapes of host haloes and those of their satellite populations are not neces-sarily the same since the satellites are found to be distributed along thin discs. During recent years, the discs of satellite galaxies around the Milky Way (MW; Demers & Kunkel1976; Lynden-Bell1976) and the Andromeda galaxies (M31; Koch & Grebel2006; Metz, Kroupa & Jerjen2007,2009; Pawlowski et al.2012; Conn et al. 2013) are discussed in the literature with focus on whether or not such flat satellite distributions around MW-like host haloes are ex-pected in the standard, spatially flatcold dark matter model with cosmological constant (CDM; Blumenthal et al.1984).
Within this hierarchical model of structure formation, haloes ac-crete matter from preferential directions of the surrounding sheets and filaments. As a consequence, the substructure distribution in haloes is not expected to be spherical until the orbits of the accreted matter components are completely randomized (Knebe et al.2004; Libeskind et al. 2005; Zentner et al.2005). Such an anisotropic accretion of substructures was first observed in simulations by Tor-men (1997, see Lovell et al.2011; Vera-Ciro et al.2011; Libeskind et al.2012for recent studies). Indeed, flat satellite systems are also found in CDMN-body simulations, albeit those are unlikely to be as flat as the satellite systems of the MW and M31 (see e.g. Wang, Frenk & Cooper2013, who also take into account possible obscu-ration effects from the galactic disc). However,CDM simulations of the local Universe with constrained initial conditions are able to reproduce the galaxy distribution in our neighbourhood. Analysing a set of such simulations, Libeskind et al. (2011) found that the local satellite distribution probably results from anisotropic accretion of matter.
Light was shed from a different angle on the anisotropic accretion scenario by Danovich et al. (2012). Simulating DM together with gas in hydrodynamical simulations these authors find that, at high redshifts, a large fraction of the baryonic mass of massive haloes is accreted from a few narrow streams of cold gas which tend to lie in the same sheets of the DM distribution. This effect leads to thin discs of satellites (Goerdt & Burkert2013) and might explain why planar subhalo distributions as thin as the MW and M31 are unlikely to be found in DM-only simulations.
However, discrepancies between the discs of satellites inCDM simulations and observations of the Local Group as well as the missing satellite problem (e.g. Weinmann et al.2006) motivate the exploration of alternative formation scenarios, within which the discs of satellites could originate from tidal arms developed during an encounter of a young MW with another galaxy (e.g. Pawlowski et al.2012suggested M31 for the Large Magellanic Cloud). Such events are observed (e.g. Weilbacher, Duc & Fritze-v. Alvensleben 2003) and can be also seen in simulations (e.g. Bournaud, Duc & Emsellem2008) without requiring the assumption of CDM.
In this study, we aim to improve the understanding of why mas-sive subhaloes in CDM simulations are distributed anisotropi-cally around the centre of their host halo. We therefore examine the shape of the DM subhalo populations in four MW-like host haloes from the Aquarius simulation to disentangle systematic effects from anisotropic accretion as possible explanation for the flat distribu-tion of the most massive subhaloes. Two possible systematics are studied:
(i) Substructures in DM haloes are not well-defined objects. After accretion, DM particles can move away from the subhalo, as the latter orbits under the action of the complex gravitational field of its host. The question if a given DM particle is still associated with the subhalo within which it entered the host can be answered
differently by different subhalo finders. The resulting uncertainty of subhalo properties (e.g. mass) causes the problem that subhalo samples, defined by these properties, can consist of different objects, depending on the employed subhalo finder. Uncertainties of subhalo properties can therefore propagate into uncertainties in the shape of their distribution if, for instance, theNmost massive subhaloes are analysed.
(ii) Besides the detection of subhaloes in simulations, the small number of massive (observationally speaking, the most luminous) subhaloes complicates the shape measurement of their distribution. Ensembles with low numbers of objects are more likely to appear aligned, which can cause an apparent, non-physical flattening of subhalo distributions.
Looking for indications of anisotropic infall, we also investigate the orbit orientation of subhaloes, given by the direction of their angular momenta, with respect to the DM field of the corresponding host haloes.
Finally, after investigating possible reasons for the flatness of the Aquarius subhalo populations, we compare the shape of these populations to results computed from the observed MW satellite distribution.
This paper is organized as follows: in Section 2, we describe the simulations analysed in this work together with the different subhalo finders participating in this study; in Section 3, we introduce the method used to derive halo shapes. Shape measurements of haloes and their subhalo population are presented in Section 4 together with an analysis on subhalo orbit orientation with respect to the DM field and a comparison with shapes of the observed MW satellite distribution. Finally, our findings are summarized and discussed in Section 5. In the appendix, we study the accuracy and precision of our shape measurements and present the observational data.
2 S I M U L AT I O N S
We study subhalo populations from four simulated MW-sized host haloes. These haloes are part of the Aquarius simulation project (Springel et al.2008) – a suite of high-resolutionN-body simu-lations performed using the cosmological smoothed particle hy-drodynamics codeGADGET-3 (based onGADGET-2; Springel2005). The simulated haloes were selected from the larger cosmologi-calCDM simulation Millennium-II (Boylan-Kolchin et al.2009) and then re-simulated at higher resolution with the cosmological parametersm=0.25, = 0.75,σ8= 0.9,ns= 1 andH0=
100hkm s-1Mpc-1=73 km s−1Mpc-1.
The four Aquarius haloes analysed in this work, labelled from Aq-AtoAq-D, have final masses of∼1012 M
and were chosen to be relatively isolated at redshiftz=0. Each halo has been re-simulated at five resolution levels, labelled as 5, for the lowest, to 1, for the highest resolution level, respectively. The mass per particle varies frommp=2.94×10⁶h−1M
in level 5 tomp=1.25× 10³h−1M
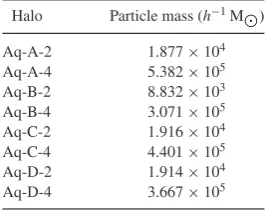
Table 1. Haloes from the Aquarius sim-ulation analysed in this work. The left-hand column shows the simulation name, encoding the halo (A to D), and the reso-lution level (2 and 4); the corresponding particle masses are shown in the right-hand column, whereh=0.73.
Halo Particle mass (h−1M)
Aq-A-2 1.877×10⁴
Aq-A-4 5.382×10⁵
Aq-B-2 8.832×10³
Aq-B-4 3.071×10⁵
Aq-C-2 1.916×10⁴
Aq-C-4 4.401×10⁵
Aq-D-2 1.914×10⁴
Aq-D-4 3.667×10⁵
2.1 Subhalo finders
Several subhalo finders have been applied on the Aquarius haloes. Each of them delivers a different subhalo catalogue, due to their spe-cific numerical techniques. In order to minimize differences when comparing subhalo samples from different finders, a common post-processing pipeline has been applied. A detailed analysis of these subhalo catalogues can be found in Onions et al. (2012), whereas additional studies of the same data have been published in sev-eral recent papers resulting from the ‘Subhalo Finder Comparison Project’ (e.g. Elahi et al.2013; Knebe et al.2013; Onions et al. 2013; Pujol et al.2014).
11 subhalo finders participated in the comparison project. How-ever, we present only results for the Amiga Halo Finder (AHF; Knollmann & Knebe2009),SUBFIND(Springel et al.2001),ROCK -STAR(Behroozi, Wechsler & Wu2013), and the STructure Finder (STF, also known asVELOCIRAPTOR; Elahi, Thacker & Widrow2011), since only those where run at high resolution on all four Aquarius haloes, analysed in this work, due to their computational efficiency. For further details of the different halo-finding algorithms, we refer the reader to the corresponding code papers.
3 S H A P E M E A S U R E M E N T
To quantify the shape of DM haloes and their subhalo populations, we aim to approximate their isodensity contours with ellipsoids. This allows us to quantify shapes in terms of the axial ratiosq= b/aands=c/a, wherea,bandcare the major, intermediate and minor axis of the ellipsoid, respectively. In the following, we will refer to these axial ratios as shape parameters. Several methods have been introduced in the literature to approximate isodensity contours with ellipsoids, while most of them deliver similar results (see All-good et al.2006; Vera-Ciro et al. 2011). To evaluate the shape parameters, we follow Dubinski & Carlberg (1991), by calculating the eigenvalues of the reduced moment of inertia
Ii,j = N n ri,nrj ,n r2
1,n+r22,n+r32,n
, (1)
wherern=(r1,n, r2,n, r3,n) is the position of thenth object with
respect to the halo centre andNis the number of objects (either DM particles or subhaloes) that fulfill|rn| ≤250h−1kpc. This radius was chosen to enclose all MW satellites, while it is larger thanr200of the considered Aquarius haloes, given by Springel et al. (2008). We chose the reduced instead of the usual moment of inertia to prevent
objects with large distances to the halo centre from dominating the measurements.
The subhalo masses are set to unity to be unaffected by uncer-tainties in their determination and to simplify the comparison with observations. Assuming ellipsoidal distributions, the square root of the largest, intermediate and smallest eigenvalue corresponds to the absolute value of the major, intermediate and minor axis, respec-tively, that is, (a, b, c)=√(λ1, λ2, λ3), withλ3≤λ2≤λ1.
Contrary to what is often done, we do not measure shapes it-eratively. In the iterative shape measurement particles that reside within the fitted ellipsoid are used to remeasure the shape, while for the initial measurement all particles are taken into account. This procedure is repeated until the shape parameters converge. We do not employ this method because during the iteration objects are excluded from the analysis which complicates the interpretation of shape measurements of, for instance, theNmost massive subhaloes. Furthermore, we found thatqandssometimes converge to zero dur-ing the iteration, when only a few particles are analysed. Bailin & Steinmetz (2005) showed that, if shape measurement is performed without iteration, selecting particles in a sphere biases the measured shape parameters towards spherical results. We have verified these results using theAq-ADM field. However, in this study we are not interested in the exact values of the shape parameters, but more in how the shapes of the subhalo populations are related to those of their hosts.
Besides the method for deriving the axial ratios, shape measure-ments can depend on the definition of the halo centre. A possible offset between the centre of mass of the host halo and the one of the full matter distribution, caused by massive substructure, can intro-duce an artificial triaxiality, especially when shapes are measured within the central part of a halo. Moreover, an offset can indicate an unrelaxed condition of the halo according to results of Power, Knebe & Knollmann (2012), who found that the distance between the most bound particle and the centre of mass is correlated with the virial ratio of the halo. To find the centre of the host halo, we apply the following procedure: (i) particles within the distanceR/n around the centre of mass are selected to recalculate a new centre of mass, wherenis initially set to unity andRis the largest particle distance to the centre of mass at the highest resolution level. (ii) Step (i) is repeatedn= 100 times, whilenis increased by one in every iteration step. Visual inspection confirmed that the centre determined by this procedure corresponds to the centre of the host halo. We use the host halo centre for the shape measurement of both – the DM field, as well as the subhalo population. This approach is chosen because it is easily applicable to observational data sets, assuming that the most luminous galaxy (e.g. the MW) resides in the centre of the host halo (see e.g. Vale & Ostriker2004). This latter assumption might be wrong in some cases (see e.g. Skibba et al.2011; Trujillo-Gomez et al.2011).
4 R E S U LT S
In this section, we present our shape measurements of the Aquarius subhalo populations and compare them to the shape of the underly-ing DM field as well as to observational data.
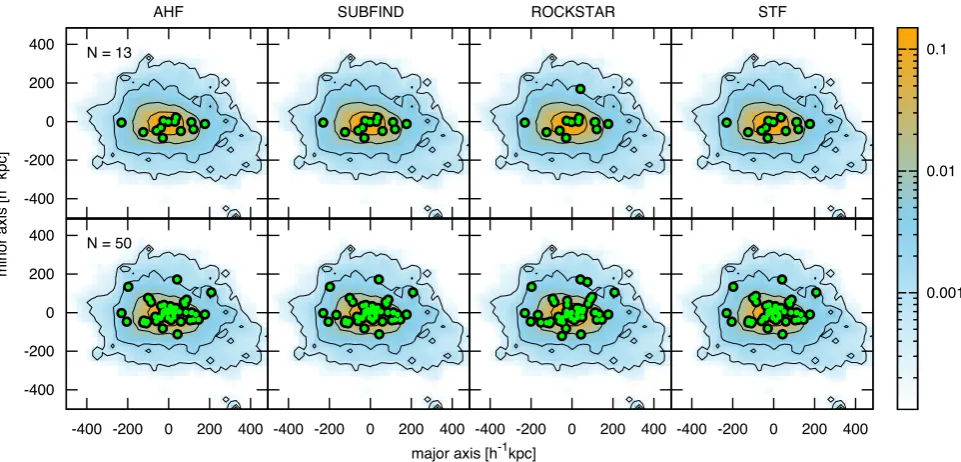
Figure 1. Matter distribution of theAq-Ahalo together with the population of the 13 (upper panels) and the 50 (bottom panels) subhaloes with the highest
vmaxvalues. Colours shown on the right bar denote the normalized density of DM at the resolution level 4 in a 100h−1kpc slice through the halo centre
perpendicular to the intermediate axis measured at 250h−1kpc. The black-rimmed green dots denote positions of theNAq-Asubhaloes with the highestvmax
values within a sphere of 250h−1kpc identified by the subhalo findersAHF,SUBFIND,ROCKSTARandSTFat resolution level 2. Note that in the case ofROCKSTAR
andSTFonly 12 of the 13 highestvmaxsubhaloes are visible since one is obscured by other subhaloes.
agreement with each other than forM200. This might be explained by
vmaxmeasurements being less dependent on uncertain definitions, such as the subhalo boundaries.
4.1 Distribution of subhalo populations identified by different finders
To gain a visual impression of how subhaloes are distributed around the centre of their host halo, we display theAq-ADM field together with its subhalo population in Fig.1. The halo is rotated so that the intermediate axis of the ellipsoid approximating the DM isodensity contours stands perpendicular to the plane of the figure. This ellip-soid is fitted to the DM distribution within a 250h−1kpc sphere around the halo centre. The coloured area denotes the normalized projected density of the DM particles at the second lowest level of resolution (level 4) within a 100h−1kpc slice through the halo centre and parallel to the intermediate axis. The full DM field at different resolution levels was not available for our analysis, whereas we do not expect this limitation to affect our conclusions as discussed in Section 4.2. The black-rimmed green dots denote the positions of the 13 and 50 highestvmaxsubhaloes1(top and bottom panels, re-spectively), identified by the subhalo findersAHF,SUBFIND,ROCKSTAR andSTFat the second highest level of resolution (level 2).
We find that the subhalo distributions identified by the different halo finders differ only by a few objects. Especially the results of AHFandSUBFINDagree very well with each other. We also find that the 13 Aq-Asubhaloes with the highestvmax values are roughly
1The selection of the 13 highest
vmax subhaloes is motivated by the set
of 13 MW satellites that are brighter thanMV= −8.5, listed in TableC1.
This set of satellites consists mostly of objects detected before the SDSS analysis (the ‘classical’ satellites). The number of highestvmaxsubhaloes in
the larger sample corresponds to the 50 MW satellites, predicted by Simon & Geha (2007) for a completely observed sky.
aligned with the major axis of the DM field, while their distribution is flatter. An alignment in the same direction is also apparent for the 50 subhaloes with the highestvmaxvalues, while the shape of their distribution is more isotropic and, therefore, in better agreement with the shape of the underlying DM field.
A physical explanation for the flattening of the massive sub-halo population might be that massive objects maintain information about their infall direction for a longer time due to their large mo-ment of inertia, while the orbits of low-mass subhaloes randomize faster after infall. If subhaloes are accreted anisotropically, the tri-axiality of a given subhalo distribution might therefore increase the more massive objects are contained in the samples. Furthermore, tidal forces can strip of material from subhaloes, while they orbit around the centre of their host. This might introduce an additional correlation between the subhalo mass and its orbit orientation with respect to the infall direction. Another reason might be that dy-namical friction causes massive subhaloes to sink faster to the host centre. For this reason, they might more prone to be totally dis-rupted before developing circular orbits, as suggested by Gill et al. (2004). However, due to the small number of massive subhaloes the flatness of their distribution might be an effect of random sampling. We attempt to disentangle such a systematic effect from anisotropic accretion as reasons for the flatness in Section 4.2.
4.2 Flatness of the subhalo population
the shape parametersq=b/aands=c/awhich correspond to the axial ratios of ellipsoids approximating the DM and subhalo dis-tributions. Note that according to this definition, the extreme cases q=s=1,sq=1 andq=a1 correspond, respectively, to a sphere, a disc and a filament.
4.2.1 Systematic bias in shape measurements from small numbers of tracers
A systematic bias in the shape measurement towards triaxiality from low numbers of shape tracing points (in our case subhaloes) is expected since any discreteness noise will produce a non-zero el-lipticity even from a perfectly spherical object. In the extreme cases of two and three tracer points, any density field will be classified as a filament and disc, respectively. This known effect (e.g. Paz, Lambas, Padilla & Merch´an2006; van Daalen et al.2012; Joachimi et al.2013) might be the reason why we measure smaller values of the shape parametersqandsfor the distribution of the most massive subhaloes than for larger sets including less massive subhaloes or the DM field.
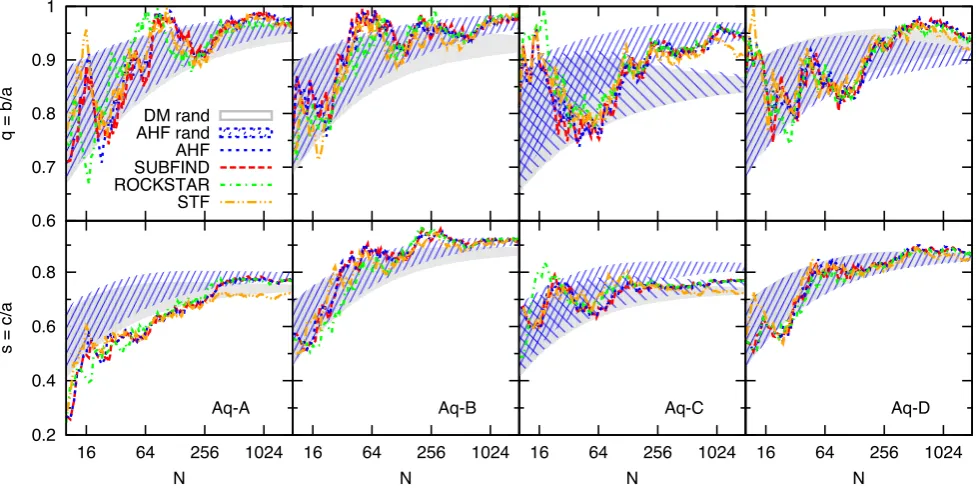
We show in Fig. 2 the values ofq and s measured from the distributions of the N most massive Aq-(A-D) subhaloes using
vmaxas a proxy for mass. Different coloured line types stand for the results of the subhalo samples obtained from the four halo finders that were run at the resolution level 2 on all haloes. The shape parameters show aqs0.1 scatter when roughly more than 100 subhaloes are used for the measurement. For smaller numbers of subhaloes results from different finders show a stronger scatter of around q s 0.2. A more detailed analysis based on results from 10 subhalo finders, run at all five resolution levels of theAq-A halo, revealed a stronger scatter for a larger variety of finders, which tends to increase at low resolution. At the lowest resolution level 5, we find a scatter of roughlyqs0.4 for
samples consisting of the 13 highestvmaxsubhaloes, partly because of the larger number of finders run at low resolution. This finding suggests that the shapes of subhalo populations consisting of the highestvmaxobjects in MW-like host haloes, measured in currently high-resolution cosmological simulations, strongly depend on the subhalo finder employed to identify substructures.
As indicated by the visual impression from Fig. 1, the shape parameters increase (shapes become more spherical) if more sub-haloes with lower mass (lowervmaxvalues) are used for the shape measurement. This effect is apparent for all four haloesAq-(A-D), while the measurements also show strong fluctuations for differ-ent numbers of most massive subhaloes. We mdiffer-entioned Section 4.1 that the decrease of shape parameters for theNmost massive subhaloes might be caused by physical effects, such as anisotropic infall, but also by a systematic effect resulting from small numbers of subhaloes in these samples.
[image:5.595.54.544.432.677.2]To distinguish between the two possible reasons for the flatness, we generate random samples ofNAHFsubhaloes that are randomly selected from all detected subhaloes within a given halo, indepen-dently of theirvmaxvalue. If the shape parameters of the distribution of theNmost massive subhaloes are significantly smaller than the values obtained from many random samples, then this would in-dicate a physical reason for the flatness. Systematics from small numbers of subhaloes should not cause differences between shapes from the two types of samples, since both consist of the of the same number of objects. We generate 1000 random samples, each with NAHFsubhaloes, from which we obtain median values of the shape parameters and 68 per cent probability regions as indicator for the scatter. The latter is shown as a blue hatched region in Fig.2. We find that the shape parametersqandsof the distributions of theN most massive subhaloes roughly lie within the central 68 per cent region ofqandsmeasurements derived from random samples. We have tested that randomly sampling subhaloes identified by different
Figure 2. Shape parametersq(upper panels) ands(bottom panels) ofAq-(A-D)subhalo populations (panels from left to right) at the resolution level 2 for theNsubhaloes with the highestvmaxvalues within 250h−1kpc around the halo centre. The blue hatched (grey) areas result from random selections of
subhalo finders leads to the same result. In most cases, the increased triaxiality (smaller shape parameters) of theNmost massive sub-haloes with respect to the DM field can therefore be explained by a systematic bias in the shape measurement due to small numbers of objects. An exception of this result is thesparameter ofAq-A, which is significantly smaller for samples of theNmost massive subhaloes than the expected value from random sampling. We will discuss this finding in Section 4.2.2 in more detail.
The results in Fig.2also show that the variation between shape measurements for subhalo populations at level 2 from different finders is smaller than the noise in the measurement, expected from random sampling. The aforementioned scatter at low resolution is comparable to the noise from random sampling.
When the number of considered shape tracers is above 1000 the shape measurements start to converge to certain values ofqands. Studying the shapes of artificial haloes, we find that the convergence of the shape parameters for large numbers of tracer particles depends on the halo shape. The number of particles necessary to reach a certain precision in the shape measurement increases the closer a halo is to spherical symmetry, while in that case roughly 1000 tracer particles are needed for a 10 per cent precision (see Fig.A1 in Appendix A). Note that this result might depend on the exact method used for the shape measurement. Although similar results are reported by authors using different definitions of the moment of inertia (e.g. Joachimi et al.2013), further study might be worthwhile to explore how heavily different shape measurements are affected by discreteness noise.
Comparing the shapes of the distributions of theNmost massive subhaloes with the DM halo shape, taking into account the bias in the measurements from low numbers of objects, we also gener-ate 1000 samples ofNrandomly selected DM particles from each Aquarius halo at the resolution level 4, instead of using subhaloes. As mentioned before, only the resolution level 4 was available for this analysis. Vera-Ciro et al. (2011) demonstrated that theirAq-A DM halo shape parameters at the five resolution levels differ by less than 4 per cent from each other, when the measurement is performed at radii as large as those used in our study (250h−1kpc). Their shape parameters measured from DM particles within 250h−1kpc around the halo centre are smaller than ours, in part because we measure shapes without iteration. We are able to roughly reproduce their results if we measure the DM shapes iteratively as well. Moreover, the difference between our measurement of the shape parameters derived with and without iteration is consistent with results reported by Bailin & Steinmetz (2005).
Besides measuring DM shapes without iteration a further dif-ference to the measurements of Vera-Ciro et al. (2011) is that we do not exclude particles that are members of subhaloes from the analysis. We do not follow this approach, as the relation between the shape of the subhalo population and the full DM shape is closer to observational information, as DM halo shapes might be traced for example by X-ray or lensing signals, which result from the full mass distribution. The 68 per cent probability regions of the 1000 shape measurements are shown as grey regions in the same figure.
If the random samples of subhaloes and DM particles consist only of a few objects, both types of random samples show similar distributions of the shape parameters. However, for larger numbers of objects, the shape parameters of subhalo and DM random samples do not converge to the same values. We can explain this result if we bear in mind that each substructure is represented by just one single object (the subhalo) in case of the subhalo random samples, but as several objects (the DM particles of the subhalo) in case of
the DM random samples. This feature might introduce an artificial anisotropy in the DM moment of inertia which is reflected by smaller shape parameters. In this sense, the fact that the difference between shape measurements from random subhalo and DM particle samples is stronger for theAq-Chalo might be related to the fact that this halo has more high-mass substructures, as it can be seen in fig. 3 from Springel et al. (2008).
To gain a better understanding of this effect, we perform a sim-ple test that consists in giving more weight to the massive sub-haloes during the random selection. For this purpose, we simply write subhaloes with large values of vmax (vmax > 100 km s−1) 2000 times in the subhalo catalogue and repeat the shape mea-surement from random samples. Following this simple approach, we can roughly reproduce the results from the DM random sam-pling, as shown by the additional wide blue hatched area included in the panel for theAq-Chalo in Fig. 2. For the sake of clarity, we only show the result of this test for theAq-Chalo, although we have checked that we obtain similar results for the rest of Aquarius haloes.
This same effect could have been tested by excluding DM parti-cles in subhaloes from the measurement.
4.2.2 Anisotropic infall
We found in the previous section that the value of s measured from theN most massive Aq-Asubhaloes is significantly below the expected value from randomly sampling subhaloes (Fig.2). It is therefore unlikely that the flatness of theAq-Apopulation of massive subhaloes can be explained by random sampling. Since this effect is independent of the employed subhalo finder we show, for the sake of clarity, here and in the following analysis only results derived fromAHFsubhalo populations. We have tested that our conclusions do not change when employing different finders.
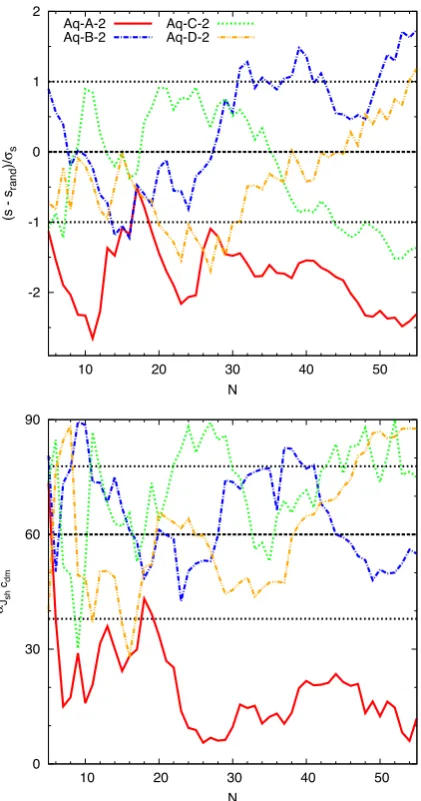
Focusing the analysis on the flatness of the massiveAq-A sub-haloes we show in the top panel of Fig.3the significance of the deviation between the shape parameter sof theNmost massive Aq-(A-D) subhaloes and the median values obtained from ran-domly sampling subhaloes. We define this significance as the ra-tio of the deviara-tion and the error obtained from randomly sam-pling subhaloes, shown as blue hatched areas in Fig.2. Again, we see that the Aq-A subhalo population is significantly flatter than expected from random sampling, while the flatness of mas-sive subhalo populations in the other haloes lies within the expected range.
Figure 3. Top panel: difference between the shape parameterscalculated from theNmost highestvmax AHFsubhaloes and the median value of 1000
shape measurements fromNrandomly selectedAHFsubhaloes (srand)
di-vided by the 1σerrors, shown as a hatched area in Fig.2. Bottom panel: angle between the total angular momentum of the subhalo population (with subhalo masses set to unity) and the minor axis of the DM field. The dashed and dotted lines indicate the mean angles±1σdeviations from an isotropic distribution, respectively.
We calculate the total angular momentum of subhalo populations as
J=
N
n
Jn, (2)
where Jn=rn×vn is the angular momentum of the nth sub-halo,rnandvnare the corresponding position and velocity vectors with respect to the halo centre and its velocity, andNstands for the number of highestvmaxsubhaloes. As in the computation of the moment of inertia, all subhalo masses are set to unity.
In the bottom panel of Fig.3, we show the angle between the minor axis of the DM field of each host haloAq-(A-D) and the total angular momentum of the corresponding subhalo populations when we take samples consisting of theNhighestvmaxsubhaloes. We find that this angle is smaller forAq-Athan for the other haloes, indicating a stronger alignment between the subhalo populations
angular momentum and the DM minor axis. If we associate this stronger alignment with the effects of anisotropic infall, this result suggests that anisotropic infall can slightly increase the flattening of the subhalo populations, while the main reason for the flattening is the bias in the shape measurement due to small numbers of objects. Note that the individual subhaloes do not contribute equally to the total angular momentum, since they are weighted by their distance and velocity with respect to the halo centre. Consequently, few objects with high velocities, large distances to the centre, or both can dominate the measurement. We therefore study in the following the flattening of subhalo populations and their rotational support with quantities that are defined for individual objects.
We start with a complementary method to study the degree of flattening of the subhalo population which consists in analysing the distribution of distances of the individual subhaloes to the major plane of the DM ellipsoid. From the subhalo distances to the DM major plane,dcwe derive the mean over the whole subhalo
pop-ulation,dc,mean. We show the mean relative distancedc/dc,mean as computed in bins of 11 subhaloes with the highestvmaxvalues in the top panel of Fig.4. For each bin we also show error bars that enclose the 68 per cent of the values around the mean of the distribution. In general, we find that the subhaloes ofAq-(B-D)with the highest
vmaxvalues do not lie significantly closer to the major plane of the DM field than the mean over the whole population. The situation is slightly different forAq-A, whose most massive subhaloes seem to be closer to the major plane, indicating therefore a flatter distribu-tion. This result is consistent with those from shape measurements shown in Fig.3, where we derived cumulative instead of differential values of subhalo populations with the highestvmaxvalues.
In order to verify rotational support, we measure for each subhalo separately the angle between the angular momentum and the minor axis of the ellipsoid fitted to the DM field asαn=arccos( ˆJn·cdmˆ ). Using the same bins of 11 subhaloes sorted byvmaxas in the top panel of Fig. 4, we now show, in the bottom panel of the same figure, the mean values ofαnin each bin together with the error
bars which enclose the central 68 per cent of the distribution. In agreement with our previous results, we find that theAq-Asubhalo population, which is significantly flattened, is also stronger aligned with the minor axis of the DM ellipsoid than it is the case for the other haloes. These findings point towards a scenario in which the flatness of theAq-Asubhalo population can be partially explained by the effects of anisotropic infall.
Results of Vera-Ciro et al. (2011) also support this scenario (see their fig. 8). These authors show that material falling into theAq-A halo has a strong dipole component between 11 and 8 Gyr lookback time, indicating filamentary accretion. The dipole components that they find for the other haloes are smaller, as material was accreted more isotropically. This result also confirms the reports by Lovell et al. (2011) who also found indications for anisotropic accretion by studying the alignment between the angular momenta of Aquarius subhaloes (as detected bySUBFIND) and their DM host halo. More specifically, Lovell et al. (2011) found that the distribution of angular momentum directions of subhaloes with the 11 largest progenitors had the strongest dipolarity in the case ofAq-A.
4.3 Comparing shapes of simulated subhalo populations with those of MW satellites
Figure 4. Top panel: distance,dc, of each subhalo to the plane spanned by
the major and the intermediate axis of the DM moment of inertia in units relative to the mean distance to the same plane computed over the whole subhalo population. Symbols show the meandc/dc,mean−1 over N±5AHF
subhaloes with the highestvmaxvalues. Error bars enclose the central 68 per
cent of the distribution in each bin. Bottom panel: angle between angular momentum of each subhalo and the minor axis of the DM moment of inertia. Binning and error bars are calculated in the same way as in the top panel. The dashed and dotted lines indicate the mean angles±1σdeviations from an isotropic distribution, respectively.
luminosities to rank the satellite galaxies. Our comparison with MW data is therefore based on the assumption that the satellite galaxies with the brightest V-band magnitudes (MV) live in the subhaloes
with the highestvmaxvalues. As we usevmaxas a proxy for the total subhalo mass,MVcan be used to quantify the stellar mass of a
satel-lite galaxy (Baraffe et al.1998). A weak correlation between the stellar mass of satellite galaxies in MW like haloes and theirvmax values can be found in simulations (Zolotov et al.2012; Reddick et al.2013; Rodr´ıguez-Puebla, Avila-Reese & Drory2013; Brooks & Zolotov2014). On the contrary, Libeskind et al. (2005) found that the stellar masses of semi-analytical model satellites are not correlated with the corresponding total subhalo mass atz=0, but with the total mass of the main progenitor, as suggested by Conroy,
Wechsler & Kravtsov (2006). However, their employed model does not include tidal stripping of the stellar mass component. Despite the existing uncertainties, we assume thatvmaxis a convenient prop-erty for comparing results of the most massive subhaloes to those derived from the observed most luminous MW satellites. Note that all masses are set to unity in the definition of the moment of inertia from which we measure the shapes. The positions andV-band lumi-nosities of the 27 MW satellites, taken from McConnachie (2012), are shown in Appendix C.
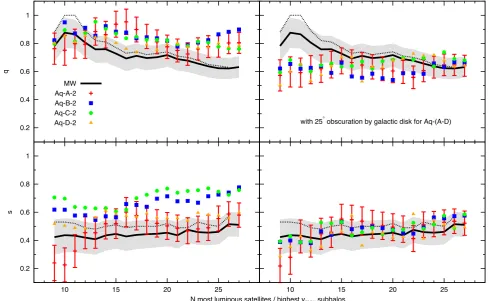
The shape parameters measured from satellite populations con-sisting of theNbrightest objects are shown as black lines in the left-hand panel of Fig.5. We also show the shape measurements of theAq-(A-D)subhalo populations, consisting of theNobjects with highestvmaxvalues. We find that the absolute values of the shape parametersqmeasured from the satellite populations are similar to the results from simulations for samples that consist of the roughly twelve or less most massive objects. When fainter satellites are included in the measurement we find a decrease ofq while the Aquarius results remain roughly constant, resulting in lower values forqin observations than in simulations. The increase of theqfrom Aq-(A-D)with the number of objects, which we have seen for large numbers in Fig.2, is not apparent when the analysis is restricted to the 27 highestvmaxsubhaloes. In the case of thesparameter we find that the observational values tend to be below the results from simulations except for samples of the highest massAq-Asubhaloes. Our values ofsfor the population of the twelve most luminous satellites is in rough agreement with those reported by Starkenburg et al. (2013). Thesmeasurements for the 12 highestvmaxsubhaloes roughly agree with results that these authors obtain from randomly sampling satellites withMV<−8.5 from semi-analytic models of
galaxy formation imposed on the Aquarius simulation.
Figure 5. Shape parameters of the MW satellite distribution consisting of theNobjects with highestV-band luminosities (black lines). These shapes are compared to those of Aquarius subhalo populations consisting in theNobjects with highestvmaxvalues identified by theAHFsubhalo finder. The left-hand panel shows results for the highestvmaxsubhaloes in the full sky. The right-hand panel shows results for selecting subhaloes in a light cone with 130◦opening
angle, assuming 25◦obscuration by the galactic disc. The coloured symbols denote the median values from 1000 realizations with randomly oriented light cones. The grey area and the error bars show the standard deviations estimated as described in Appendix B. Black dashed lines show shape parameters from the MW data measured with a method that decreases systematic bias from low numbers of tracers, as described in Appendix A.
in our model. The obscuration angle ofαobs=25◦is larger than commonly reported for the MW. In Fig.C1, we see that the major-ity of satellites resides outside of this zone. This might be explained by a smaller obscuration angle together with the angular limitation of the SDSS (both shown in Metz et al.2009), which result in a larger effective obscuration angle.
The black dashed lines in Fig.5show the shape parameters of satellite populations measured with a method that decreases the bias in the shape measurement from low numbers of shape tracing objects. This method is described in Appendix A.
5 S U M M A RY A N D C O N C L U S I O N S
We have analysed four high-resolution simulations of DM haloes with MW-like masses from the Aquarius project,Aq-(A-D), to measure the shapes of their subhalo populations and compared them to those of the underlying DM distributions. Throughout the anal-ysis, we used thevmaxvalues of the subhaloes as a proxy for the subhalo mass.
We find that the shapes of subhalo populations, consisting of the objects with the highestvmaxvalues, show only a weak dependence on the employed subhalo finder when the subhaloes are analysed at high-mass resolution. This result changes for small samples at lower mass resolutions since shape measurements for smaller sub-halo samples are highly sensitive to changes of a few members. We therefore expect that similar measurements, performed in
cur-rently high-resolution cosmological simulations (e.g. Millennium-II), strongly depend on the subhalo finder used to identify substructures.
Our shapes measured from subhalo populations consisting of the Nsubhaloes with the highest vmax values show that the subhalo distributions are more triaxial when only objects with highestvmax values are considered. This trend is apparent for all four halo finders run at the resolution level 2 and all four Aquarius haloes. Interpreting these results in terms of anisotropic accretion is delicate due to the fact that triaxiallity is likely to increase for samples with a few subhaloes. As anulltest, we conducted the same shape measurement forNrandomly selected subhaloes and DM particles. In all cases, we found a decrease of the shape parameters for small numbers of objects. In three of the four analysed haloes, the decrease of the shape parameters for the subhaloes with the highestvmaxvalues is consistent with results from random samples. ForAq-A, the shape parameters is up to 40 per cent smaller than the median value from random sampling. This difference roughly corresponds to a 2σ deviation and indicates a flattening of the population of high
vmaxsubhaloes due to anisotropic infall.
orbits of the highvmaxAq-Asubhaloes tend to reside in the plane spanned by the major and intermediate axis of the DM moment of inertia, which is in agreement with subhalo accretion along the host halo major axis. Such an interpretation is consistent with the findings of Vera-Ciro et al. (2011), who showed that the matter accreted by theAq-Ahalo has a dipole component – a signal of filamentary infall. Also Lovell et al. (2011) report indications for anisotropic accretion by studying the alignment between the angu-lar momenta of Aquarius subhaloes and the DM field of their host halo.
After having analysed possible reasons for the increased triax-iallity of the highest vmax Aquarius subhaloes, we compare the shape of their distributions with those of observed MW satellites. In this regard, we found that the shape parameters derived for the distribution of the twelve satellites with the brightestV-band magnitudes lie within the range expected from the four Aquarius haloes when using the same number of subhaloes with the highest
vmax values. However, for larger samples including fainter satel-lites and lower vmax subhaloes the shape parameters are below the results from simulations, especially the major to intermedi-ate axial ratioq. This discrepancy can be decreased by assuming an overly strong galactic obscuration of 25◦, while in that case the shape parameters for the highvmax samples lie below the results from bright satellites samples. This demonstrates that the geom-etry of our observational window, defined by the zone obscured by the galactic disc, and the geometry of the surveys mapping the sky can affect the shape measurements of the satellite distribu-tion, while we expect a stronger impact on samples including faint satellites.
Within the CDM context, the strong triaxiality of the MW satellite distribution with respect to our results from simulations can be interpreted as an result of anisotropic accretion, which would agree with the findings of Libeskind et al. (2011). A further reason for the strong flatness of the observed satellite distribution might be that the assumption that the most luminous satellites live in the subhaloes with the highest mass at redshift zero (using the maximum rotational velocity as mass proxy) might be inadequate to mimic the results of galaxy formation (Boylan-Kolchin, Bullock & Kaplinghat 2011). Simulations and observations suggest that the subhalo mass after infall and their stellar mass are not or just weakly correlated, while we assume a monotonic relation for our comparison with MW data (Libeskind et al.2005; Rodr´ıguez-Puebla et al.2013; Brooks & Zolotov2014). It might be necessary to simulate the evolution of DM together with the baryonic physics to produce thinner satellite discs (Danovich et al.2012).
Our analysis of systematic effects on the shape measurement revealed that hundreds of tracers are needed for obtaining reliable results. We conclude that even if subhaloes, as potential hosts of satellite galaxies, follow the DM field of their host, they are too few for a reliable shape measurement of the MW DM halo. The expected increase of the number of known satellites in future surveys (Simon & Geha2007) will probably not be sufficient to solve this problem. However, we also found that the shapes of subhalo populations in three of the four MW-like host haloes are consistent with the shapes of the DM field, if bias from the small number of tracers in the shape measurement is taken into account. The assumption that subhaloes trace the DM field of their host is therefore in reasonable agreement with our results.
A similar analysis performed on larger host haloes with more massive subhaloes at different redshifts would allow for an improved comparison with larger observational data sets from cosmological surveys.
AC K N OW L E D G E M E N T S
This paper was initiated at the Subhaloes going Notts workshop in Dovedale, UK, which was funded by the European Commissions Framework Programme 7, through the Marie Curie Initial Train-ing Network Cosmo- Comp (PITN-GA-2009-238356). We wish to thank the Virgo Consortium for allowing the use of the Aquarius data set and Adrian Jenkins for assisting with the data.
KH is supported by beca FI from Generalitat de Catalunya. He acknowledges Noam Libeskind for a fruitful discussion. SP and HL acknowledge a fellowship from the European Commission’s Framework Programme 7, through the Marie Curie Initial Training Network CosmoComp (PITN-GA-2009-238356). SP also acknowl-edges support by the PRIN-INAF09 project ‘Towards an Italian Network for Computational Cosmology’ and by Spanish Ministe-rio de Ciencia e Innovaci´on (MICINN) (grants AYA2010-21322-C03-02 and CONSOLIDER2007-00050). EG and KH acknowledge the Spanish Ministerio de Ciencia e Innovaci´on (MICINN) project AYA2009-13936, Consolider-Ingenio CSD2007- 00060, AK is sup-ported by the Ministerio de Econom´ıa y Competitividad (MINECO) in Spain through grant AYA2012-31101 as well as the Consolider-Ingenio 2010 Programme of the Spanish Ministerio de Ciencia e Innovaci´on (MICINN) under grant MultiDark CSD2009-00064. He also acknowledges support from the Australian Research Council (ARC) grants DP130100117 and DP140100198. He further thanks Felt for penelope tree. SIM acknowledges the support of the STFC Studentship Enhancement Program (STEP). YA receives finan-cial support from project AYA2010-21887-C04-03 from the former Ministerio de Ciencia e Innovaci´on (MICINN, Spain), as well as the Ram´on y Cajal programme (RyC-2011-09461), now managed by the Ministerio de Econom´ıa y Competitividad (fiercely cutting back on the Spanish scientific infrastructure). PSB is supported by a Giacconi Fellowship through the Space Telescope Science Insti-tute, which is supported through NASA contract NAS5-26555. MN thanks the Sir John Templeton Foundation for support through a New Frontiers and Astronomy and Cosmology grant.
The authors contributed in the following ways to this paper: KH and SP undertook this project. KH performed the analysis presented and wrote the paper together with SP. KH is a PhD student super-vised by EG. FRP, AK, EG, HL, JO and SIM contributed with useful discussions and with the organization of the workshop at which this study was initiated. They designed the comparison study and planned and organized the data. The other authors provided data and had the opportunity to proof, read and comment on the paper.
R E F E R E N C E S
Allgood B., Flores R. A., Primack J. R., Kravtsov A. V., Wechsler R. H., Faltenbacher A., Bullock J. S., 2006, MNRAS, 367, 1781
Bailin J., Steinmetz M., 2005, ApJ, 627, 647
Baraffe I., Chabrier G., Allard F., Hauschildt P. H., 1998, A&A, 337, 403 Behroozi P. S., Wechsler R. H., Wu H. Y., 2013, ApJ, 762, 109
Blumenthal G. R., Faber S. M., Primack J. R., Rees M. J., 1984, Nat, 311, 517
Bournaud F., Duc P. A., Emsellem E., 2008, MNRAS, 389, L8
Boylan-Kolchin M., Springel V., White S. D. M., Jenkins A., Lemson G., 2009, MNRAS, 398, 1150
Boylan-Kolchin M., Bullock J. S., Kaplinghat M., 2011, MNRAS, 415, L40 Brooks A. M., Zolotov A., 2014, AJ, 786, 87
Conn A. R. et al., 2013, ApJ, 766, 120
Conroy C., Wechsler R. H., Kravtsov A. V., 2006, ApJ, 647, 201 Danovich M., Dekel A., Hahn O., Teyssier R., 2012, MNRAS, 422, 1732 Demers S., Kunkel W. E., 1976, ApJ, 208, 932
Elahi P. J., Thacker R. J., Widrow L. M., 2011, MNRAS, 418, 320 Elahi P. J. et al., 2013, MNRAS, 433, 1537
Ghez A. M. et al., 2008, ApJ, 689, 1044
Gill S. P. D., Knebe A., Gibson B. K., Dopita M. A., 2004, MNRAS, 351, 410
Goerdt T., Burkert A., 2013, preprint (arXiv:e-prints) Hahn O., Teyssier R., Carollo C. M., 2010, MNRAS, 405, 274
Joachimi B., Semboloni E., Bett P. E., Hartlap J., Hilbert S., Hoekstra H., Schneider P., Schrabback T., 2013, MNRAS, 431, 477
Knebe A., Gill S. P. D., Gibson B. K., Lewis G. F., Ibata R. A., Dopita M. A., 2004, ApJ, 603, 7
Knebe A. et al., 2013, MNRAS, 435, 1618 Knollmann S. R., Knebe A., 2009, ApJS, 182, 608 Koch A., Grebel E. K., 2006, AJ, 131, 1405
Kravtsov A. V., Gnedin O. Y., Klypin A. A., 2004, ApJ, 609, 482 Libeskind N. I., Frenk C. S., Cole S., Helly J. C., Jenkins A., Navarro J. F.,
Power C., 2005, MNRAS, 363, 146
Libeskind N. I., Knebe A., Hoffman Y., Gottl¨ober S., Yepes G., Steinmetz M., 2011, MNRAS, 411, 1525
Libeskind N. I., Hoffman Y., Knebe A., Steinmetz M., Gottl¨ober S., Metuki O., Yepes G., 2012, MNRAS, 421, L137
Lovell M. R., Eke V. R., Frenk C. S., Jenkins A., 2011, MNRAS, 413, 3013 Lynden-Bell D., 1976, MNRAS, 174, 695
McConnachie A. W., 2012, AJ, 144, 4
Metz M., Kroupa P., Jerjen H., 2007, MNRAS, 374, 1125 Metz M., Kroupa P., Jerjen H., 2009, MNRAS, 394, 2223 Onions J. et al., 2012, MNRAS, 423, 1200
Onions J. et al., 2013, MNRAS, 429, 2739
Pawlowski M. S., Kroupa P., 2013, MNRAS, 435, 2116
Pawlowski M. S., Kroupa P., Angus G., de Boer K. S., Famaey B., Hensler G., 2012, MNRAS, 424, 80
Paz D. J., Lambas D. G., Padilla N., Merch´an M., 2006, MNRAS, 366, 1503 Power C., Knebe A., Knollmann S. R., 2012, MNRAS, 419, 1576 Pujol A. et al., 2014, MNRAS, 438, 3205
Reddick R. M., Wechsler R. H., Tinker J. L., Behroozi P. S., 2013, ApJ, 771, 30
Rodr´ıguez-Puebla A., Avila-Reese V., Drory N., 2013, ApJ, 773, 172 Sales L. V., Navarro J. F., Theuns T., Schaye J., White S. D. M., Frenk
C. S., Crain R. A., Dalla Vecchia C., 2012, MNRAS, 423, 1544 Simon J. D., Geha M., 2007, ApJ, 670, 313
Skibba R. A., van den Bosch F. C., Yang X., More S., Mo H., Fontanot F., 2011, MNRAS, 410, 417
Smith R. E., Watts P. I. R., 2005, MNRAS, 360, 203
Smith R. E., Watts P. I. R., Sheth R. K., 2006, MNRAS, 365, 214 Springel V., 2005, MNRAS, 364, 1105
Springel V., White S. D. M., Tormen G., Kauffmann G., 2001, MNRAS, 328, 726
Springel V. et al., 2008, MNRAS, 391, 1685 Starkenburg E. et al., 2013, MNRAS, 429, 725 Tormen G., 1997, MNRAS, 290, 411
Trujillo-Gomez S., Klypin A., Primack J., Romanowsky A. J., 2011, ApJ, 742, 16
Vale A., Ostriker J. P., 2004, MNRAS, 353, 189
van Daalen M. P., Angulo R. E., White S. D. M., 2012, MNRAS, 424, 2954 Vera-Ciro C. A., Sales L. V., Helmi A., Frenk C. S., Navarro J. F., Springel
V., Vogelsberger M., White S. D. M., 2011, MNRAS, 416, 1377 Wang J., Frenk C. S., Cooper A. P., 2013, MNRAS, 429, 1502
Fritze-v.Weilbacher P. M., Duc P. A., Alvensleben, 2003, A&A, 397, 545 Weinmann S. M., van den Bosch F. C., Yang X., Mo H. J., 2006, MNRAS,
366, 2
Zentner A. R., Kravtsov A. V., Gnedin O. Y., Klypin A. A., 2005, ApJ, 629, 219
Zhang Y., Yang X., Wang H., Wang L., Mo H. J., van den Bosch F. C., 2013, ApJ, 779, 160
Zolotov A. et al., 2012, ApJ, 761, 71
A P P E N D I X A : I M P R OV E D S H A P E M E A S U R E M E N T
[image:11.595.311.549.118.305.2]To study in detail the bias induced in the shape measurement due to low numbers of tracer points, we perform the following test.
Figure A1. Measured shape parameters of artificial particle distributions with given input shapes, marked by black dots. The centre of the ellipses are the mean measurements ofqandsderived from 10 000 random real-izations of the particle distributions. The major and minor axes denote the standard deviation ofqandsmeasurements, respectively. The colour of the ellipses denotes the number of random particles used in each of the 10 000 realizations.
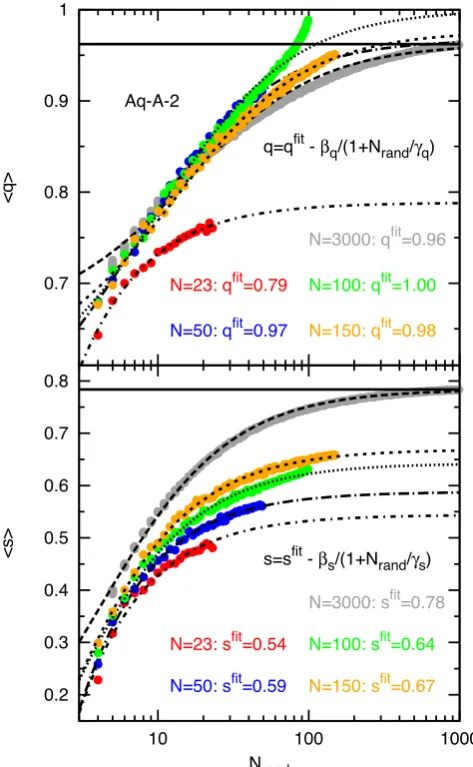
[image:11.595.313.549.394.625.2]Figure A3. Mean shape parameters derived from 1000 random samples consisting ofNrandsubhaloes (coloured symbols). The samples are drawn
from theNAq-Asubhaloes with the highestvmaxvalues without
replace-ment. The black dashed lines show the fitting function given by equation (A1) with the best-fitting values forqfitandsfitdisplayed in the figure. The
best-fitting values derived from theN=3000 highestvmaxsubhaloes are
shown as black solid lines.
We build mock DM haloes by generating particle distributions char-acterized by a given ellipticity and density profile. Using 10 000 random realizations of such artificial haloes formed byNtracers (representing subhaloes or DM particles), we measure the mean shape parametersqandsand the corresponding standard deviations for different sets of input shapes as a function of N. The results of this analysis, shown in Fig.A1, reveal that around 1000 tracer particles are required to ensure that the measured shape parameters deviate by less than 10 per cent from the true (input) values. The bias in the shape measurement due to low tracer points is stronger if the shape parameters of the artificial haloes are close to unity, while results are almost unbiased if the shape parameters are below 0.2.
[image:12.595.42.279.57.441.2]In Fig.A2, we show the measured shape parameters of a mock halo with inputq=0.9 ands=0.6 as a function of the number of tracer particles, N. By trial and error, we find that the shape
Figure A4. Relative difference between the shape parametersqands mea-sured from theNshand 3000Aq-(A-D)subhaloes with the highestvmax
values. Open symbols show directqandsmeasurements, whereas closed symbols represent measurements corrected as described in the text and demonstrated in Fig.A3.
measurementsq(N) ands(N) can be described with a function of the form
q(N)=qfit− β
1+N/γ, (A1)
whereqfit,βandγ are free parameters. The expression fors(N) is analogous to the one forq(N). For large number countsq(N) and s(N) converge, respectively, toqfitandsfit, which correspond to the true shape parameters of the halo.
These fitting functions open the possibility of decreasing the bias in the shape measurement from low number counts using the follow-ing procedure. If we consider the case of the subhalo populations, we randomly sample groups of subhaloes, as much as possible, without replacement. These samples are drawn from theNhighest
vmaxsubhaloes, since in real life only the most massive (or lumi-nous) satellite galaxies are observed. The mean shape parameters of such groups are then measured as a function of the number of group members,Nrand. By fitting equation (A1) to the measuredq(Nrand) ands(Nrand), we can derive the parametersqfitandsfitas shown in Fig.A3.
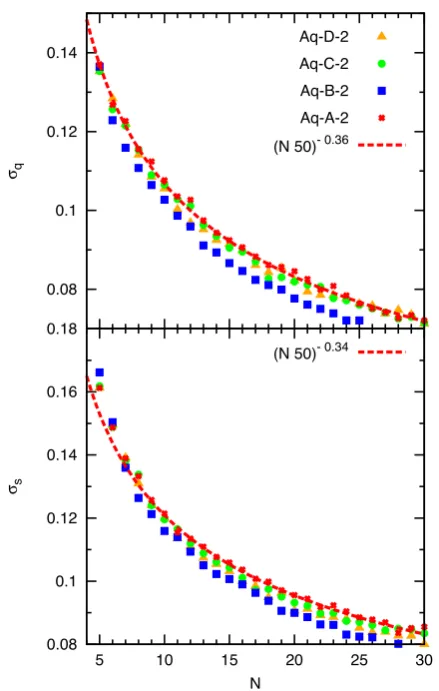
Figure A5. Symbols denote the standard deviation of the shape measure-ment from randomly selectedAHFsubhaloes, shown as a blue shaded area in Fig.2. The red dashed lines are a power law approximation of theAq-A results, used as an error estimation in Fig.4.
the shape parameters measured using theN<3000 most massive subhaloes. Indeed, as it is shown in Fig.A4, for the 23 highestvmax subhaloes inAq-(A-D), the difference betweenq(N) andq(3000) decreases by about 5 per cent, whereas in the case ofs(N) the deviation froms(3000) is about 10 per cent smaller if this correction procedure is applied.
A P P E N D I X B : E R R O R E S T I M AT I O N S F O R T H E S H A P E M E A S U R E M E N T
We estimate the error of the shape measurements from the obser-vational data and highest vmax Aq-A subhaloes shown in Fig.5 using the results from random sampling Aquarius subhaloes inde-pendently of theirvmaxvalues. The standard deviation derived from samplingNAHFsubhaloes 10 000 times are shown in Fig.A5. We find that these results can be approximated by a power law shown in the same figure. The error estimate applied to the observational data is the same power law that describes the standard deviation from theAq-Aresults.
A P P E N D I X C : M W S AT E L L I T E S
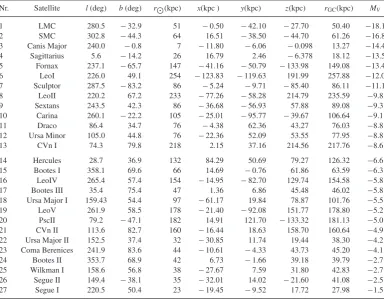
For comparing the shapes of the Aquarius subhalo distributions to MW data, we use the positions and absoluteV-band magnitudes of 27 satellite galaxies from McConnachie (2012), presented in TableC1. The distribution of these satellites around the centre of the MW is shown in Fig.C1.
The Cartesian coordinates of each satellite are calculated from the heliocentric galactic anglesl,bandrGCas follows:
x=rGCcos(b) cos(l)−dGC
y=rGCcos(b) sin(l)
z=rGCsin(b),
where the conversion to Cartesian coordinates is based on a dis-tance to the galactic centre ofdGC=8.4 kpc (Ghez et al.2008).
Figure C1. Distribution of satellites from TableC1around the MW centre. Left and central panel show edge on views on the galactic disc. Coordinates are rotated, so that the best-fitting plane, spanned by the major and intermediate axis of the ellipsoid fitted to all 27 objects, is edge on in the left-hand panel. The central panel shows the same distribution while the perspective is rotated by 90◦around the galactic pole. The right-hand panel shows a face-on view on the galactic disc. Red and blue dots denote, respectively, satellites withV-band magnitudes brighter and fainter thanMV= −8.5. The shaded area is the assumed
galactic obscuration zone used to calculate the shapes for Aquarius subhalo samples shown in the right-hand panel of Fig.5. Its radial size of 250h−1kpc,
[image:13.595.59.540.468.635.2]Table C1. MW satellite galaxies used in this work sorted by the absoluteV-band magnitudeMV. This list is based on the
table given by McConnachie (2012), wherelandbare angles in heliocentric galactic coordinates,ris the distance to the sun,x,y,zare Cartesian coordinates with the centre of the Galaxy in the origin, andrGCis the distance to the galactic
centre.
Nr. Satellite l(deg) b(deg) r(kpc) x(kpc ) y(kpc) z(kpc) rGC(kpc) MV
1 LMC 280.5 −32.9 51 −0.50 −42.10 −27.70 50.40 −18.1
2 SMC 302.8 −44.3 64 16.51 −38.50 −44.70 61.26 −16.8
3 Canis Major 240.0 −0.8 7 −11.80 −6.06 −0.098 13.27 −14.4
4 Sagittarius 5.6 −14.2 26 16.79 2.46 −6.378 18.12 −13.5
5 Fornax 237.1 −65.7 147 −41.16 −50.79 −133.98 149.08 −13.4
6 LeoI 226.0 49.1 254 −123.83 −119.63 191.99 257.88 −12.0
7 Sculptor 287.5 −83.2 86 −5.24 −9.71 −85.40 86.11 −11.1
8 LeoII 220.2 67.2 233 −77.26 −58.28 214.79 235.59 −9.8
9 Sextans 243.5 42.3 86 −36.68 −56.93 57.88 89.08 −9.3
10 Carina 260.1 −22.2 105 −25.01 −95.77 −39.67 106.64 −9.1
11 Draco 86.4 34.7 76 −4.38 62.36 43.27 76.03 −8.8
12 Ursa Minor 105.0 44.8 76 −22.36 52.09 53.55 77.95 −8.8
13 CVn I 74.3 79.8 218 2.15 37.16 214.56 217.76 −8.6
14 Hercules 28.7 36.9 132 84.29 50.69 79.27 126.32 −6.6
15 Bootes I 358.1 69.6 66 14.69 −0.76 61.86 63.59 −6.3
16 LeoIV 265.4 57.4 154 −14.95 −82.70 129.74 154.58 −5.8
17 Bootes III 35.4 75.4 47 1.36 6.86 45.48 46.02 −5.8
18 Ursa Major I 159.43 54.4 97 −61.17 19.84 78.87 101.76 −5.5
19 LeoV 261.9 58.5 178 −21.40 −92.08 151.77 178.80 −5.2
20 PscII 79.2 −47.1 182 14.91 121.70 −133.32 181.13 −5.0
21 CVn II 113.6 82.7 160 −16.44 18.63 158.70 160.64 −4.9
22 Ursa Major II 152.5 37.4 32 −30.85 11.74 19.44 38.30 −4.2
23 Coma Berenices 241.9 83.6 44 −10.61 −4.33 43.73 45.20 −4.1
24 Bootes II 353.7 68.9 42 6.73 −1.66 39.18 39.79 −2.7
25 Wilkman I 158.6 56.8 38 −27.67 7.59 31.80 42.83 −2.7
26 Segue II 149.4 −38.1 35 −32.01 14.02 −21.60 41.08 −2.5
27 Segue I 220.5 50.4 23 −19.45 −9.52 17.72 27.98 −1.5
Our Cartesian coordinates slightly differ from those given in Pawlowski & Kroupa (2013) due to differences in the angles and in thedGCused for the coordinate conversion. Note that the observa-tional coordinates are given kpc to be consistent with the literature, while we usedh−1kpc throughout the paper, since this is the
stan-dard output of theGADGET-3 code, which was used for performing the simulations.