MAINTENANCE STRATEGY IN PAVEMENT PERFORMANCE EVALUATIONS
USING DEFLECTION MODEL AND SITE RECONNAISSANCE METHODS
H. Mohammed
1,*, E. F. Elufowoju
2, V. C Mgboh
3and M. K. Ajibade
41,2,3,4
D
EPARTMENT OFC
IVILE
NGINEERING,
O
BAFEMIA
WOLOWOU
NIVERSITY,
I
LE-
I
FE,
O
SUNS
TATE,
NIGERIA
E-mail addresses:
1hmesteem @yahoo.com
,
2[email protected],
3[email protected],
4[email protected]
ABSTRACT
This paper presents the results of a comparative study of a pavement evaluation for maintenance strategy option using deflection model and condition survey methods. Condition survey was carried out to visually assess the distress manifestations on the study section of the road. Test samples were collected at various locations within the road section, after which some engineering properties - natural moisture content, in-situ dry density, optimum moisture content, maximum dry density, and relative density, were determined for them. The pavement deflections at these locations were calculated using a deflection model. The representative rebound deflection, δrrd, was thereafter determined. A pavement rating score (PRS) of 61% was obtained from the condition survey, which suggests that the pavement is in good condition and thus requires overlay only. A representative deflection value of 0.4 mm obtained also suggests that the pavement is in good condition. These results show that the two methods corroborate each other and should be used together to evaluate road sections for the optimum road maintenance option.
Key words: Pavement evaluation, Condition Survey, Deflection Model, Pavement Condition.
1. INTRODUCTION
Road pavements generally deteriorate gradually under normal traffic loading. Evidence of structural deterioration in flexible pavements is generally seen as rutting or cracking in wheel tracks [1]. The structural adequacy of a pavement is measured either by non-destructive means which measure deflection under static or dynamic loadings, or by destructive tests, which involve removing sections of the pavement and testing these in the laboratory [2].
The four major types of routine assessment are (HD 30/99) [3]: visual condition surveys, high speed road monitor, deflect graph and side force coefficient routine investigation machine (SCRIM). Visual surveys involve groups of technical staff compiling information on the condition of carriageways, kerbs, etc., and converting same into numerical ratings for each existing defect. These ratings, which are subjectively based, indicate the relative urgency of the need for treatment. The high speed road monitor (HRM) measures parameters, such as riding quality, texture and rutting. The main function of the HRM surveys, is to identify specific discrete locations where more established but more costly and time consuming methods of analysis should be used.
The deflection beam is a widely accepted instrument for assessing the structural condition of flexible highway surfacing. The deflection method developed by TRL [4] is used to assess the structural condition of the flexible highway surfacing, while the SCRIM is used to measure the skidding resistance of highway surface that is being gradually reduced by the polishing action of the vehicular traffic [5]. The necessity for this evaluation is the need to increase the traffic capacity of the road, prevent and or reduce accidents at various sections along the road. SCRIM coefficients have a typical range of 0.30 to 0.60 [6].
Radar can help the engineer to ‘see’ beneth the surface, but it cannot give much in the way of direct information on the structural condition of the materials. For this, there is no alternative but to assess performance under load which means measuring the deflection of the pavement surface under the action of an applied wheel load (or similar alternative). The stiffness of response will then give direct information, which might logically correlate to the ability of the pavement to carry multiple load applications [7].
Deflection (pavement surface's vertical deflected distance), a major parameter of pavement failure is
Vol. 37, No. 4, October 2018, pp.
861 – 866
Copyright© Faculty of Engineering, University of Nigeria, Nsukka,Print ISSN: 0331-8443, Electronic ISSN: 2467-8821
www.nijotech.com
difficult to measure due to the high cost of acquiring, operating, and maintaining measuring equipment. Using a deflection model would enable the evaluation of flexible pavement using pavement soil parameters easily determined by simple soil test equipment [8].
2. BACKGROUND OF STUDY
Infrastructure is a generic term for basic structures and facilities that are essential to the generation of economic growth and development in modern economies. It covers many facilities generally referred to as economic and social overhead capital which include education, water supply, sewage systems, energy, postal and telecommunication services, transport systems, hospitals and roads. The extent to which a nation’s land mass is covered by road network is an index of the degree of mobility of people, goods and services within the country, and the quality of the network measures the ease and cost of that mobility. In addition, it is evident that transportation plays a crucial role in shaping the destiny of many nations because modern industrial and commercial activities rest on proper, well-developed and efficient transport system. Huge sums of money have been sunk into road development in Nigeria [9].
However, these roads have been plagued by a number of problems, with the major ones being of faulty design, inadequate drainage system and poor maintenance
culture, which have significantly reduced the utility of the roads. There are potholes, pavement wash-out, fallen bridges, etc., along most Nigerian roads. These problems have made it difficult, expensive and arduous to move products and services from producers to consumers, farm produce from rural to urban centres, which often lead to loss of man-hours and high cost of goods and services. The annual loss due to bad roads is valued at N80 billion while additional vehicle operating cost is put at N53.8 billion bringing the total annual cost to N133.8 billion [9].
To achieve Nigeria’s dream of ranking among the strongest economies of the world by 2020, infrastructural development must be one of its topmost priorities, [10]. Its maintenance by extension would ensure the nation’s sustainable development.
Consequently, one of the essential activities required to ensure that the tremendous amount of investment of hard earned resources in road infrastructure is none other than effective and timely maintenance of these infrastructures. Postponed and delayed maintenance entails not only expensive reconstruction and rehabilitation, but they also adversely affect and retard national development in all sectors of the economy [11].
Evaluation would assist in evolving various strategies that can be used to decide on pavement restoration and rehabilitation policy [12].
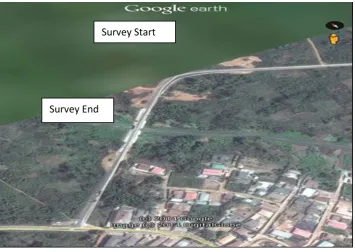
Figure 2: The study route (source: Google map, 2014)
3. MATERIALS AND METHODS
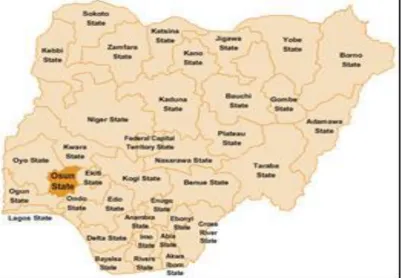
The study route is a University road which is the main service road between the main campus consisting of students’ hostels and staff residential areas and the University Teaching Hospital Complex. This road is the nerve connection between these areas.. Figure 1 shows the location of Osun State in South – Western part of Nigeria, while Figure 2 shows the location of the study route. The road is a single carriageway, with lateritic sub – base and base, and asphaltic concrete wearing course. It is a 3.25 kilometre road with the study section between chainages 2+750 and 3+250.
The condition survey which involved visual assessment of the route was carried out to determine its level of deterioration and the rating determined.
Test samples (at subgrade level) were collected at every fifty metres along the route. Undisturbed soil samples were collected with a core cutter for the determination of the field compaction, as well as the natural moisture contents. Samples were also collected for laboratory tests using the disturbed sampling method [7], and the required soil parameters obtained using standard procedures [8, 9].
4. RESULTS AND DISCUSSION
The condition survey of the road showed that, it exhibited the following symptoms as shown on Plates 1 – 10, potholes, crocodile cracks, ruts and depression, edge damage, longitudinal and transverse cracks and shoving. These surface conditions indicate that the
pavement was distressed. The pavement condition score for various portions of the road section is as shown on Table1. The pavement rating score was determined using Equation 1 [10].
∑( ) ( )
PRS = 100 – 39.623 = 60.737
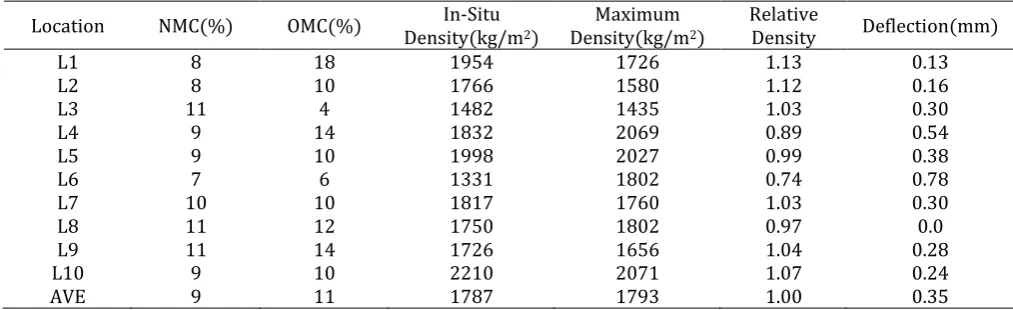
This PRS value according to the Asphalt Institute System rating scale (Figure 3) shows that the section requires overlay only. Table 2 shows the results of the geotechnical tests and the deflections.
Equations 2 and 3 were respectively used to compute the wet unit weight (wet density) and the dry unit weight (dry density) of the soil samples [11].
( )
( ) The maximum dry density (MDD) at optimum moisture content (OMC) was obtained using standard procedures [11]. The maximum dry densities for the corresponding moisture contents are as shown in Table 2. The relative density (RD) was computed by using equations 4 [11]. The results are shown in Table 2.
( )
Where, , and ω are wet unit weight of soil, dry unit weight of the soil and moisture content of soil respectively, W is the net weight of the soil, V is the volume of the container.
Survey End
Plate 1: Depressed Portion of Carriageway (Chainage 2+750 –
2+850) Plate 2: Crocodile Crack (Chainage 2+850 – 2+950)
Plate 3: Shoving (Chainage 3+150 – 3+175) Plate 4: Longitudinal Crack (Chainage 3+050 – 3+100)
Plate 5: Delineation (Chainage 2+950 – 3+050) Plate 6: Rut, depression, Cracks, Shoving (Chainage 2+950 – 3+050)
Plate 7: Crocodile Crack and Pothole (Chainage 3+150 – 3+175) Plate 8: Ravelling (Chainage 3+150 – 3+175)
Plate 9: Eroded shoulder showing exposed base course
Table 1: Pavement Condition Survey Data
Chainage Length (m) Width (m) Area (m2) Distress Deduct Point
2+750 – 2+850 100 7.3 730 1.55
2+850 – 2+950 100 9.0 900 0.133
2+950 – 3+050 100 7.3 730 9.721
3+050 – 3+150 100 7.3 730 16.644
3+150 – 3+250 100 7.3 730 11.214
TOTAL 500 39.263
Figure 3: Asphalt Institute Rating Scale [16].
Table 2: Geotechnical Analysis Parameters and Deflections
Location NMC(%) OMC(%) In-Situ
Density(kg/m2)
Maximum Density(kg/m2)
Relative
Density Deflection(mm)
L1 8 18 1954 1726 1.13 0.13
L2 8 10 1766 1580 1.12 0.16
L3 11 4 1482 1435 1.03 0.30
L4 9 14 1832 2069 0.89 0.54
L5 9 10 1998 2027 0.99 0.38
L6 7 6 1331 1802 0.74 0.78
L7 10 10 1817 1760 1.03 0.30
L8 11 12 1750 1802 0.97 0.0
L9 11 14 1726 1656 1.04 0.28
L10 9 10 2210 2071 1.07 0.24
AVE 9 11 1787 1793 1.00 0.35
The pavement deflections shown in Table 2 were computed by using equation 5 [12] and the representative rebound deflection of 0.40 mm was computed using equation 6 [13].
. ( ) ( . ) c ( ) where δ is the deflection; RD is the relative density; δrrd is the representative rebound deflection; s is the standard deviation; and Fc is the critical period correction factor.
The representative rebound deflection of 0.40 mm recorded for this road section indicates that the road is in a good condition using the template in Table 3 [12], meaning that the observed distresses are isolated. This corroborates the following data on the study route:
i. Pavement Rating Score - 61%,
ii. Average natural moisture content of 9%, average optimum moisture content of 11%, which places the soil on the dry side of the compaction curve [13]. iii. Average relative density of 100% which is considered in recommendations [2, 14] as desirable level of service.
iv. Visual inspection which show the various distress conditions.
4. CONCLUSION
A comparative study of pavement evaluation using a deflection model and visual assessment was carried out.
The following conclusions were drawn from the results:
i. The two methods corroborate each other for the study route.
ii. The rating score alone cannot be used for overlay design.
iii. The deflection model method is objective and less expensive compared with the non destructive methods that require specialised equipment and skills.
Table 3: Pavement Condition Template Representative Rebound Deflection
Value (δrrd)
Pavement Condition
rrd ≤ . mm Good
. mm ≤ rrd ≤ . mm Fair
rrd > 0.64mm Poor
(Source [8])
5. REFERENCES
[1] O’ laherty, C.A. “Highways”, .Butterworth-Heinemann, Oxford.UK, 2002.
[2] Garber, J.N and Hoel, L.A. “Traffic and highway engineering”, Brooks/Cole publishing company,Pacific Grove, California, 2010.
[3 DoT. “Maintenance assessment procedure”, HD 30/99, Design manual for roads and bridges, volume 7: Pavement design and maintenance, The Stationery Office, London, 1999.
[4] Kennedy,C. K, evre, P. and Clarke, C. “Pavement deflectionn: equipment for measurement in the United Kingdom”, TRRL Report LR 834. Transport and Road Research Laboratory, Crownthorne, UK, 1978a.
[5] DoT.Skidding resistance, HD 28/94, Design manual for roads and bridges, volume 7: Pavement design and maintenance, The Stationery Office, London, 1994a.
[6] Rogers, M. Highway engineering, Blackwell Publishing Ltd. Oxford, UK, 2003.
[7] Thorm, N. Principles of Pavement Engineering, ICE Publishing, London, 2014.
[8] Mohammed, H. Deflection Model for Structural Evaluation of Flexible Pavement: –Unpublished PhD Thesis in The Department of Civil Engineering for the award of P.hD. Degree of the University of Ibadan, June, 2010.
[9] Anyanwu, C. M., Adebusuyi, B. S and Kukah, T. Y. “Highway maintenance in Nigeria lessons from
other countries.” Abuja. Research department occasional paper no.27, Central Bank of Nigeria, 2003.
[10] Tracheal, V “How to jump-start Nigerian’s economy” The Guardian Newspaper, pg.1, Vol. 25, No.10, pp. 461, 2007.
[11] United Nations Economic Commission for Africa “Road Maintenance Handbook, Volume I-III”, UNECA, Adis Ababa, Ethiopia, 1982.
[12] Garber, J. N and Hoel, L. A “Traffic and Highway Engineering,” U.S.A. second edition, Brooks/Cole publishing company, pacific grove, California,9333950, 1999.
[13] Aude, H.A.P, Oghorodge, E. E and Oviri, D. E. ”Sensitivity Analysis of lexible Road Pavement Life Cycle Cost Model”, Nigerian Journal of Technology, Vol.35 No.2, April, pp. 278-289, 2016.
[14] Faluyi, S. O, Adebayo, S. O. and Oluborode, K. D. “Moisture-density relation of lime-treated samples of lateritic soil in Ado-Ekiti Nigeria”, Journal of Applied Science, Engineering and Technology, Vol.6 No.1pp. 56 – 61, 2006.
[15] Bowles, J. E. “Engineering properties of soil and their measurements”. McGraw-Hill Book Company, New York, 1988.
[16] Oguara, T. M. “Highway engineering: pavement design, construction and maintenance”. Malt House Press Limited, Lagos, Nigeria, 2006.
[17] ang, H. Y. and Daniels, J.L. “Introductory geotechnical engineering”, Taylor and Francis, Inc., New York, 2006.
[18] Guler, M, ."Design of overlays”, ecow.engr.wisc.edu/cgi-bin/get/cee/576/bahia/ notes/cee576lecture19-f99.doc. , Accessed on August 5, 2008.