Viewpoint
Synaptic Odyssey
X
Kristen M. Harris
Department of Neuroscience, Center for Learning and Memory, University of Texas at Austin, Austin, Texas 78712
Synaptic communication is at the heart of nervous system func-tion. Our understanding of synaptic structure and plasticity has grown enormously since the founding of the Society for Neuro-science 50 years ago. Much insight has come from examining these structures with light and electron microscopy. This photo essay describes my odyssey through the world of synapses. Be-cause theJournal of Neuroscience(JN) has accompanied me on this synaptic odyssey, I have organized the figures to featureJN articles that launched each part of the journey. Although the overall story is told in an approximately chronological order, the panels of each figure are topical and spur side trips that are tem-porally out of sequence. Given the cursory nature of this essay, I encourage you to read the original articles for analytical details and for references to the vast body of literature that supports or contradicts the conclusions reached along the way.
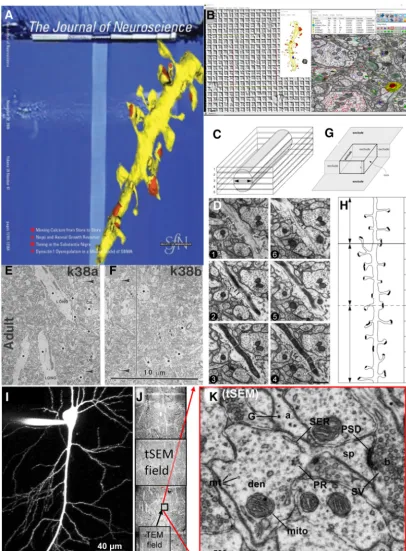
This story began in 1978 with love at first sight, when I first saw dendritic spines studding the surface of Golgi-impregnated neurons in the light microscope (Fig. 1;Harris et al., 1980). I wondered why neurons position excitatory syn-apses upon the heads of these tiny compartments that separate them from the parent dendrite. In the beginning, I studied dendritic spines with light microscopy, and then with freeze– fracture, which revealed spine profiles and bumps or pits where proteins were in the membranes at the synapse and elsewhere (Fig. 2A;Harris and Landis, 1986). I soon realized, however, that these approaches left too many secrets buried in-side the spines and deep in the complex neuropil surrounding them. So, I plunged into three-dimensional reconstruction from serial section electron microscopy (3DEM) to obtain spine di-mensions that are still used in modeling structure–function rela-tionships (Fig. 2B; Harris and Stevens, 1989). The results eventually led to the first dense reconstructions in brain tissue and showed that only 20% of axons touching a dendrite actually synapse with that dendrite (Fig. 2C;Mishchenko et al., 2010). The dense reconstructions revealed⬃500 synapses in a neuropil vol-ume equal to that of a single red blood cell (Fig. 2D–F;Harris et al., 2015). We learned that the extracellular space is not uniformly distributed but instead forms sheets and tunnels where molecules and other extracellular components could take diverse routes to share information (Fig. 2G;Kinney et al., 2013). Eventually, the original images, tutorials, and reconstructions were made public to the neural circuit and cell biology communities (available at 3DEM.org;Harris et al., 2015).
The knowledge gained emphasized the need to go beyond counts and shapes to deduce whether alterations in dendritic spines were the cause or consequence of neural dysfunction (Fig. 2H–K). A thorough review of the literature and our own data suggested that dendritic spines are responsive to upstream degen-eration of axons or perisynaptic astroglia, and, instead of causing the illness, their aberrant structures reflect an effort to maintain function as best as possible (Fiala et al., 2002;Witcher et al., 2010; Kuwajima et al., 2013c).
We faced many challenges to ensure that our quantitative analyses provided systematic and unbiased outcomes. The most difficult step was to establish uniform section thickness (Fig. 3A; Harris et al., 2006). We developed a free, quantitative, and easy-to-use reconstruction system (Fig. 3B;Fiala and Harris, 2001a, 2002) and used it to standardize a cylindrical diameters method to ascertain section thickness (Fig. 3C,D; Fiala and Harris, 2001b). The next challenge was to understand the denominator of normalized data (i.e., per area, per volume, per unit length). Initially, we subtracted obliquely sectioned large objects that in-clude cytoplasmic areas where synapses cannot form and are nonuniformly distributed throughout the neuropil (Fig. 3E,F; Harris et al., 1989; 1992). We formalized analyses of unbiased bricks (Fig. 3G) and segment lengths (Fig. 3H;Fiala and Harris, 2001). Another important challenge has been to image large fields with sufficiently high resolution to discern synapses and subcel-lular components, which was achieved by operating the scanning electron microscope in the transmission mode (tSEM;Kuwajima et al., 2013a,b). With tSEM, whole dendritic arbors (Fig. 3I) can be imaged across just a few montaged fields (Fig. 3J). Tradition-ally, the high resolution needed to quantify subcellular compo-nents required imaging small fields on the transmission electron microscope (TEM). We showed that enough resolution was maintained to distinguish and quantify dimensions and the ex-tent of key subcellular constituents, using the tSEM strategy (Fig. 3K).These approaches made feasible experiments using 3DEM to go beyond the initial, essential descriptions to quantitative out-comes of synaptic dimensions and composition.
We obtained expertise in hippocampal brain slice physiol-ogy to investigate structural synaptic plasticity under con-trolled experimental conditions (Harris and Teyler 1983, 1984; Teyler et al., 1989). We established new methods that produce high-quality tissue preservation in the slices by microwave-enhanced fixation under lukewarm conditions that facilitate diffusion without destroying delicate ultrastruc-ture (Jensen and Harris, 1989). Nevertheless, we faced the well known challenge of slicing-induced alterations in neuronal structure (Fig. 4A,B;Kirov et al., 1999). We discovered that slicing induces synaptogenesis that could not be blocked with Received April 1, 2019; revised Dec. 1, 2019; accepted Dec. 2, 2019.
The author declares no competing financial interests.
Correspondence should be addressed to Kristen M. Harris at [email protected]. https://doi.org/10.1523/JNEUROSCI.0735-19.2019
activity blockers or with control or tetanic stimulation (Fig. 4C;Kirov and Harris, 1999). Instead the effect was brought on by chilling the slices during preparation (Fig. 4D–H;Kirov et al., 2004). Even with optimal temperature during preparation, 3 h were required for the slices to recover and stabilize (Fig. 4I–Q;Fiala et al., 2003;Bourne et al., 2007).
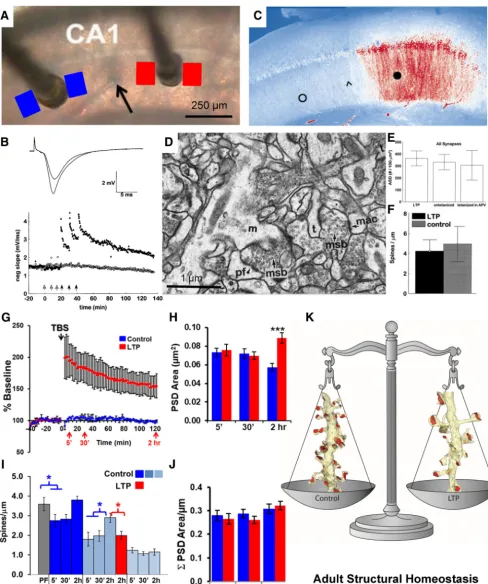
These experiments prepared us to investigate structural syn-aptic plasticity following induction of long-term potentiation (LTP), a cellular mechanism of learning. We used a within-slice paradigm to induce LTP at one electrode and showed indepen-dence of activation from stimulation at a second electrode located ⬎400m away in the same slice (Fig. 5A,B;Sorra and Harris, 1998;Bourne and Harris, 2011). A similar induction paradigm showed that the distribution of phosphorylated calcium/ calmodulin-dependent protein kinase II (P-CaMKII) was re-stricted to the region beneath the stimulating electrode used for LTP induction and did not spread to the control stimulation site (Fig. 5C;Ouyang et al., 1997). The outcomes of our first study showed stability in average synapse density and size after the induction of LTP with three bouts of tetanic stimulation (1 s at 100 Hz;Fig. 5D–F;Sorra and Harris, 1998).
Adjusting the LTP induction protocol to a more realistic acti-vation pattern known as theta-burst stimulation (TBS;Fig. 5G), revealed a remarkable underlying process. Unlike tetanic stimu-lation, synapses were enlarged by 2 h after the induction of LTP with TBS (Fig. 5H;Bourne and Harris, 2011). The TBS stalled spine outgrowth, which is normally facilitated by control test-pulse stimulation during slice recovery (Fig. 5I;Bell et al., 2014). The combination of LTP-related synapse enlargement and stalled
spine outgrowth resulted in a constant total synaptic input per unit length of dendrite (Fig. 5J). This homeostatic balance be-tween synapse number and size is characteristic of oblique den-drites in hippocampal area CA1 from young adult rats (60 –70 d old;Fig. 5K).
Neurons are not born with dendritic spines. Initially, smooth or varicose dendrites extend filopodia that sometimes form syn-apses or adhesion junctions and ultimately transport the axons to dendritic shafts (Fig. 6A;Fiala et al., 1998). In the developing hippocampus, the full variety of dendritic spine shapes seen in adults can be observed by postnatal day 15 (P15;Fig. 6B;Harris et al., 1992). Dendritic spines first appear at P11–P12; spine density reaches 50% at P15, and 1 week later reaches 82% of adult levels (Fig. 6C;Kirov et al., 2004). These observations support the hy-pothesis that normal synaptogenesis proceeds from filopodial contact and axonal migration to the dendrite shaft followed by spine outgrowth (Fig. 6D;Harris, 1999).
We have long wondered whether the effects of functional syn-aptic plasticity on synapse structure and composition change over the course of maturation. Initially, we found that the earliest age at which we could induce LTP with tetanic stimulation was postnatal day 15 in rat hippocampal area CA1 (Harris and Teyler, 1984;Jackson et al., 1993). In contrast, the earliest age that LTP could be induced by the more robust TBS paradigm coincided with the appearance of dendritic spines at P12 (Fig. 6E;Cao and Harris, 2012). However, applying multiple TBS episodes separated in time byⱖ90 min can push the onset to a couple of days earlier (Fig. 6F;Cao and Harris, 2012). Notably, when TBS is given at P15, synapses do not enlarge; instead, new Figure 1. Rapid Golgi preparation from area CA1 in adult rat hippocampus. This technique allows one to see single CA1 pyramidal cells with basal and apical dendrites. With higher magnification (inset), one can see dendritic spines and axonal boutons. But these images raised a question: what is not being visualized in the surrounding neuropil? Adapted fromHarris et al., 1980.
Figure 2. From single dendritic spines to dense reconstructions.A, Freeze–fracture image of a small dendritic spine (black filled circles) and a large dendritic spine (open square) seen in profile. Adapted fromLisman and Harris, 1993; original figure is fromHarris and Landis, 1986.B, First fully surfaced 3D reconstruction from serial electron microscopy sections through a dendritic segment in rat hippocampal area CA1 gracing the cover ofJNaccompanying the article byHarris and Stevens (1989).C, Later, additional series were cut from the same rat as inB, and dense reconstructions of all elements in the tissue revealed that only 20% of the axons (pink) that touch a dendrite (yellow) actually form a synapse (blue;Mishchenko et al., 2010).D, Different dense reconstruction from the same rat hippocampus as inC(yellow, spiny dendrites; pale orange, nonspiny dendrites; green, axons; red, synapses; dark orange, microglia; light blue, astroglia).E, Tissue section reconstructed inDoverlain on a single reconstructed single red blood cell (⬃180m3) to illustrate relative volume.F, Removing all elements except synapses shows that the volume reconstructed inEcontained
a total of 498 synapses (red, excitatory; blue, inhibitory). Three of the dense reconstructions from this brain were shared publicly (D–Fwere adapted fromHarris et al., 2015).G, Extracellular space reconstruction from 1m3of the neuropil fromD. Color code shows sheets at 0 –30 nm separation between objects (red-yellow) and larger tunnels at 30 – 60 nm wide (light to dark blue). Adapted
Figure 3. Interpreting quantitative outcomes from serial thin sections.A,JNcover that accompanied a Toolbox article covering material that was presented at two “Meet the Expert” sessions at the Society for Neuroscience meetings in 2005 and 2006 (adapted fromHarris et al., 2006).B, Screenshot from Reconstruct, a tool for obtaining calibrated dimensions of objects reconstructed in 3D from serial thin sections (freely available for download with detailed manual athttps://synapseweb.clm.utexas.edu/software-0). This image was generated from ongoing work in the Harris Laboratory. The windows show a calibration grid for determining the pixel size (left), a dendrite reconstructed using the Boissonnat surface tool along with a 1m scale cube made using the Box too (middle), and an EM image with defined objects (right). The objects list (top middle) outputs a .csv file with calibrated dimensions that can be imported into databases for statistical analyses, and there are drawing tools and color palettes (top right) to name and illustrate traces, stamps, and other defining objects (top right) that can be superimposed on aligned images.C,D, The cylindrical diameters method to estimate section thickness for accurate volume and surface area calculations. Adapted from Fiala and Harris (2001a).E,F, Neighboring fields from the same single section (see large arrowheads pointing to the same object on the left side of the line inF). Adjusting synapse density in neuropil areas or volumes requires subtracting areas or volumes of objects (black dots) that nonuniformly occupy space where synapses cannot form. Adapted fromHarris et al. (1992). G,H, The unbiased brick (G) and unbiased dendritic length (H) methods for 3D stereology (fromFiala and Harris, 2001b).I,J, A CA1 pyramidal cell filled with Alexa Fluor dye at scale (I) next to three tSEM fields montaged across the apical CA1 dendritic arbor (J) to illustrate the large tSEM field size relative to the typical TEM field size.K, The resolution of the tSEM fields (ⱕ2 nm pixel size) retains the same tissue elements as the original TEM fields. (I–Kare adapted fromKuwajima et al., 2013a).
Figure 4. Establishing experimental conditions to recover quality ultrastructure in acute hippocampal slices.A,B, Image from a hippocampal slice that was of excellent quality and preservation (A), in contrastwithB,whichshowstoomanydarkanddyingprocesses,whichwasrejectedforfurtheranalysis.Theseexperimentswerethefirsttoshowslicing-inducedsynaptogenesis.C,Whensynaptictransmission was blocked, additional synaptogenesis was triggered—the first demonstration of synaptic homeostasis in mature brain (BandCare fromKirov et al., 1999).D,E, Direct demonstration that once slices are recovered (D), chilling them to 4°C during live imaging (E) was sufficient to eliminate most dendritic spines and cause dendrites to swell.F, Upon rewarming, there is excessive proliferation of filopodia and spine-like processes.G, The synaptic field potential disappears upon exposure to the cold and reappears upon warming.H, The swollen dendrites show loss of spines and synapses and evidence of free postsynaptic densities floating in the dendritic cytoplasm (D–Hare fromKirov et al., 2004b).I–M, Such observations motivated an ultrastructural investigation of the timing of recovery of hippocampal slices: perfusionfixedhippocampus(I),immediatelyafterslicing(J),after1hofincubation(K),and3hlater(L);andastrocyticglycogenwasgoneduringthefirsthour(M)duringsliceincubation,suggestingthathigh glycolysis is needed for the neurons to recover from slices. Then small glycogen␣particles began to recover and reachedin vivoperfusion-fixed (Pf) levels by 3 h, suggesting that the neurons were then ready to respond normally.N, Microtubules were lost from dendrites (see that there is an absence of microtubules in dendritic profiles in the EM ofJ, but that they were rapidly retubulated into short segments by 25 min and reached theirin vivolength by 3 h (I–Nare fromFiala et al., 2003).O, Quantification of dendritic spines illustrated inC(Con, control; Tet, after tetanic stimulation; B1, aCSF with low Mg⫹2and low Ca⫹2;
B2, aCSF with low Mg⫹2and low Ca⫹2plus glutamate receptor blockers;nvalues in the bars are the numbers of dendritic tips analyzed to achieve these numbers). Note that the density is at the limit of light
Figure 5. Ultrastructure of long-term potentiation in the young adult rat hippocampus.A, Positioning of stimulating electrodes and sample locations for serial EM sections from the control (blue) and LTP (red) sites. The stimulating electrode that induced LTP was alternated between the CA3 (left) and the subicular (right) side of the recording electrode (black arrow).B, LTP induced by three bouts of tetanic stimulation (closed arrows, 100 Hz for 1 s each), and the control side received the same number of stimuli at a slower rate that did not induce LTP (open arrows).C, Staining for P-CaMKII after induction of LTP at the subicular stimulating electrode (black circle) illustrates increased labeling (red) of P-CaMKII relative to the control stimulation site (open circle). The arrowhead indicates the approximate location of the recording electrode, and the scale is the same as inA. Adapted fromOuyang et al. (1997).D, Illustration of the excellent brain slice ultrastructure that can be obtained from adult hippocampal slices.E,F, Examination of such slices revealed that adjusted synaptic density (ASD;E) and spines per micrometer (F) were not altered by LTP induced by tetanic stimulationBandD–Fwere adapted fromSorra and Harris (1998).G–I, When LTP was induced with theta burst stimulation (G), and the PSD area of synapses enlarged (H), while the increase in small-spine density seen under control conditions was absent (I).J,K, Consequently, the total PSD area after LTP induction was similar to that in control conditions (J), resulting in a homeostatic balance in total synaptic weight per unit length of dendrite (K).A,B,G, andHare adapted fromBourne and Harris (2011);Iis adapted fromBell et al. (2014). msb, Multisynaptic bouton. (D) m⫽mushroom spine, pf⫽perforated PSD, msb⫽multisynaptic bouton, mac⫽macular PSD, t⫽thin spine; *p⬍0.05; ***p⬍0.001.
Figure 7. Effects of LTP on the distribution of polyribosomes.A–D, Polyribosomes in adult hippocampal areas CA1.A, A dendritic spine head in adult hippocampal area CA1 with polyribosomes (black arrows) and putative monosomes (blue arrows).Aⴕ,Aⴖ, 3DEM reconstructions of a representative dendrite (pale yellow) with PSDs (red) showing the positions of polyribosomes (black arrows) after control (Con) stimulation (Aⴕ) and after induction of LTP with tetanic stimulation (Aⴖ).B,C, Quantitative analysis showed that 2 h after tetanus, PR numbers were increased along the dendrites (B), and in dendritic spines of every shape (C).D, In addition, the synaptic surface area measured across the postsynaptic density on spines with polyribosomes was elevated 2 h after tetanus administration (D).A–Dare adapted fromBourne et al. (2007b).E–H, Polyribosomes in P15 hippocampal areas CA1.E–Eⴖ, Serial EM sections through a dendritic spine show two polyribosomes (arrows) and the PSD (chevron inE).F, Schematic of identified polyribosome locations in the dendritic spines.Fⴕ, Polyribosomes in dendritic shaft.G, 2 h after LTP was induced by tetanic stimulation, more dendritic spines contained polyribosomes, whereas the neighboring dendritic shafts contained fewer polyribosomes.H, Spines containing polyribosomes had larger synapses.E–Hare adapted fromOstroff et al. (2002).I, Polyribosome in an adult dendritic shaft.Iⴕ,Iⴖ, Polyribosome in an adult dendritic spine (Iⴖ); 3DEM reconstruction of spine is shown inIⴕ.J, Distribution of polyribosomes in the shaft, spine base, and spine heads or necks at varying times after TBS induction of LTP.K, Synapse (PSD) surface areas at different times after TBS in adult area CA1. FromBourne and Harris (2011).L,Lⴕ, Polyribosomes in a P15 dendritic spine head (L) and (Lⴕ) dendritic shaft.M,N, Relative to perfusion fixed (PF) P15 hippocampus, control test pulses had no significant effect on polyribosome distribution among dendritic spines or shaft. Induction of LTP at P15 showed a rapid increase on polyribosomes in spines at 5 min, lasting for 30 min, while the elevation lasted only 5 min in the dendritic shafts.Ostroff et al. (2018).
spines form (Fig. 6G;Watson et al., 2016). Thus, in contrast to adult rat hippocampus, where synapse enlargement is bal-anced by stalled spine outgrowth, LTP enhances synaptogen-esis in favor of circuit production during development. It remains to be determined whether species- and strain-dependent differences in LTP onset between mice, and in rats, can be accounted for by variance in the onset age of spinogen-esis (Ostrovskaya et al., 2019).
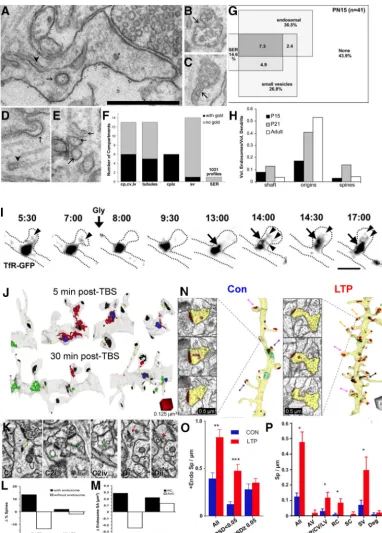
The next big question was to determine what dendritic re-sources limit total synapse enlargement and number. Local pro-tein synthesis is an important resource for synapse enlargement and spine outgrowth. Ribosomes are an ultrastructural signature of local protein synthesis. Single ribosomes, monosomes, are abundant throughout neurons but are not as readily recognized as polyribosomes (PRs) that form a string of three or more ribo-somes (Fig. 7A).
When tetanic stimulation was used to induce LTP in adult rat hippocampus, dendrites contained more polyribosomes 2 h later (Fig. 7B). The polyribosomes were elevated in spines of all shapes (Fig. 7C), and spines containing polyribosomes after LTP had larger synapses than those without polyribosomes (Fig. 7D; Bourne et al., 2007). Similarly, in P15 rat hippocampus, dendritic spines acquired more polyribosomes, while dendritic shafts had fewer polyribosomes at 2 h after the induction of LTP with tetanic stimulation (Fig. 7E–G;Ostroff et al., 2002). Also, as in adults, the P15 spines with polyribosomes had larger synapses than those without polyribosomes after tetanus-induced LTP (Fig. 7H).
When TBS was used to induce LTP in adult hippocampal slices, polyribosomes also dropped in the shaft at 2 h, but the elevation in spine polyribosomes lasted only 5 min (Fig. 7I,J). Polyribosome frequency dropped below control levels by 2 h after the induction of LTP, as more spines formed and acquired polyri-bosomes during the control stimulation (Fig. 7J; Bourne and Harris, 2011). In addition, synapses were larger on dendritic spines that contained polyribosomes at both 5 min and 2 h after the induction of LTP by TBS in adult hippocampus (Fig. 7K; Bourne and Harris, 2011).
TBS-induced LTP also differed from tetanus-induced LTP at P15. As in adults, the TBS-induced elevation of polyribosomes at P15 occurred 5 min after LTP induction and declined thereafter (Fig. 7L,M;Ostroff et al., 2018). Furthermore, there was an ele-vation in shaft polyribosomes that was not sustained past the 5 min time point, and, in contrast to tetanus-induced LTP, there was no difference in polyribosome frequency in either the spines or the shafts at 2 h after TBS (Fig. 7M,N;Ostroff et al., 2018). Together, these results suggest that the pattern of stimulation used to induce LTP recruits local protein synthesis that requires polyribosomes at different times. Future work is needed to deter-mine whether monosomes, which synthesize different proteins from polyribosomes, are also recruited at different times post-tetanus administration or post-TBS.
Another limited resource that could limit synapse enlarge-ment and number is smooth endoplasmic reticulum (SER). SER is the largest internal membrane system, extending throughout the entire neuron. It controls both global and local lipid synthesis, protein trafficking, calcium, signaling to the nucleus, and more. Our third cover on theJournal of Neurosciencewas a complete reconstruction of the SER illustrating the connection between the shaft SER and that in a dendritic spine (Fig. 8A; Spacek and Harris, 1997). Most spines in hippocampal CA1 stratum radia-tum lack SER (Fig. 8B); however, those that contain a tubule of SER (Fig. 8C) or a well defined spine apparatus (Fig. 8D) have larger synapses. Some spines contained polyribosomes (Fig. 8E),
but it was quite rare for a single spine to contain both polyribo-somes and SER, perhaps suggesting that local protein synthesis of cytoplasmic proteins occurs at different times than SER-mediated processes. Clearly, both subcellular constituents are dy-namically regulated across spines. Furthermore, at 2 h after the induction of LTP, synapses on spines lacking polyribosomes and SER were 0.6% larger, whereas synapses on PR-containing spines showed a 4% increase. In addition, synapses on spines with SER showed a whopping 11% increase in postsynaptic density (PSD) area relative to control (Fig. 8F). These effects were present across all spine sizes, and thus were not limited by the surface area of the spine head, but rather by the availability of subcellular resources of polyribosomes and SER.
The distribution of dendritic spines along the dendritic shafts is not uniform (Fig. 8G). Initially, we discovered that more SER occurred where spine density and size were greatest along a den-drite, as though it was providing local resources to sustain a con-stant amount of synaptic input (Fig. 8H–J;Spacek and Harris, 1997). This finding spurred functional analyses in cultured neu-rons, where complex ER with greater volume produced slower trafficking of membrane and proteins, leading to ER exit sites (Cui-Wang et al., 2012). This effect became more prominent as cultures aged and produced dendritic spines (Fig. 8K–M). The 1997 findings were replicated with 3DEM, which showed that the summed cross-sectional area of the SER profiles (SER complex-ity) was greater in regions where dendritic spines clustered (Fig. 8N–R).
We wondered whether LTP and the differential availability of SER or polyribosomes influence synaptic clustering and local ho-meostatic balance in spine outgrowth. We divided the dendritic segments into synaptic clusters that were defined as being bounded by asynaptic regions having no spine origins for at least 120 nm (Fig. 8S–V, blue regions;Chirillo et al., 2019). As indi-cated above, dendritic spine outgrowth was stalled as synapses enlarged in the 2 h after TBS-mediated induction of LTP (Fig. 5I). This stalled spine outgrowth was restricted to synaptic clus-ters lacking the enlarged resource-rich spines (Fig. 8V,W). Com-plex branched SER was also locally retained in the dendritic shafts of spine clusters having resource-rich polyribosome- or SER-containing spines. Furthermore, the total synaptic weight was greater in synaptic clusters that had the resource-rich spines than in clusters without such spines, namely, those in which spines lacked polyribosomes and/or SER (Fig. 8X). These findings sug-gest that resource-rich spines undergo the most enlargement, yet they share resources with their immediate neighbors, allowing local spine outgrowth.
Figure 8. Effects of SER and PRs on synaptic plasticity and homeostasis.A, Three-dimensional reconstruction of a large dendritic spine (gray), with a large, irregular, perforated synapse (red) and its spine apparatus, which is continuous with the network of SER in the dendritic shaft.B–Dⴕ, Serial EM sections and three-dimensional reconstructions of spines: a spine without SER (B,Bⴕ), a spine with a simple tubule of SER (C,Cⴕ), and a spine with a spine apparatus (D,Dⴕ). The lines in the 3D reconstructions illustrate how the head diameter was measured at its widest point.E,Eⴕ, Serial sections and 3DEM illustrating a polyribosome in an adult dendritic spine head (blue arrow).F, Synapse enlargement after LTP, controlled for head diameter relative to subcellular composition.G, Fully reconstructed dendritic segments from adult rat hippocampal slices under control (Con) and LTP conditions, illustrating regions of high and low spine density.H,I, In adult hippocampusin vivo, the schematic shows the locations of small and large spine origins (H), which match the section locations indicated inI, where they-axis is the section number and thex-axis charts the total cross-sectional area of SER in the dendritic shaft on each segment.J, 3DEM of the shaft SER that is graphed inI.K–L, In cultured hippocampal dendrites, we showed that where the dendritic shaft SER was more complex in structure, trafficking was slowed and provided regions for cargo exit to deliver resources to synapses.M, The length of the complex ER exit sites increased with age.N–R, Regions of SER complexity gave rise to more dendritic spines in adult hippocampus.S,T, Synaptic clusters having spines with large synapses and resource rich spines containing polyribosomes or SER (PR⫹, SER⫹) in the control (Con) and LTP conditions.U,V, Synaptic clusters lacking resource-rich dendritic spines (PR⫺, SER⫺) in the control and LTP conditions.W, The homeostatic stalling of spine outgrowth was restricted to synaptic clusters lacking resource-rich spines.X, In contrast, regions of the dendritic segment that had resource-rich spines had a greater total synaptic weight, measured as the summed PSD area per length of cluster segment.AandH–Jare adapted fromSpacek and Harris (1997);B–GandS–Xare adapted fromChirillo et al. (2019);K–Rare adapted from Cui-Wang et al. (2012).
Figure 10. Dendritic spines do not split; instead spinules, perforations, branched spines, and nascent synaptic zones serve LTP and possibly underlie the advantages of spaced learning. A–B2, Spinules (blue) emerge from within the perforations of postsynaptic densities (red) on large dendritic spines (beige) and extend into presynaptic boutons (green inC1).C1–C3, A spinule (purple) that deeply invaginates perisynaptic astroglia (pale blue) as readily seen in 3DEM. Adapted fromSpacek and Harris (2004).D1,D2, EM (D1), and 3D (D2) reconstruction illustrating the head of a branched spine (X) that shares the same presynaptic axon (yellow) with an unbranched spine (Y) located further up the dendrite (Dend). Seven (numbered) independent axonal processes pass between spines X and Y beneath this same dendrite multisynaptic bouton (sdMSB). The other branch of spine X (branch Z) synapses with a different axon (peach) that runs perpendicular to the yellow axon. Adapted fromFiala et al. (2002a). In panelsD1andD2the numbers refer to individual axons passing between the neighboring spines.E1,E2, Two serial sections illustrating a nascent zone (NZ) in the PSD characterized by the absence of presynaptic vesicles (AZ is the part of the postsynaptic density across from the presynaptic active zone, with presynaptic vesicles).E3,E4, This organization becomes obvious in the 3D reconstructions showing the AZ (red), NZ (turquoise), docked vesicles (dark blue), vesicles within two vesicle diameters of the AZ (white), and the presumptive reserve pool of vesicles (green).F1–F4, Virtual thin sections (3 nm) through the AZ and NZ of two 150 nm sections through a synapse (F1–F3), which is reconstructed inF4(colors same asE, plus yellow arrow inF1and yellow dots inF4indicate the extent of the opening of the docked vesicle).G, Dense-core vesicle “inserting” at the edge of an AZ.H, NZs decrease in frequency and size by 30 min after LTP (red) relative to control (blue), but fully recover and enlarge by 2 h after the induction of LTP with TBS (red LTP is above blue control).I, When LTP is fully saturated by TBS (delivered at times indicated by red arrowheads), delivering TBS 5 min or up to an hour later produces no further potentiation (quantified in inset).J, When the third TBS is delivered 4 h after LTP saturation, additional LTP can be produced.K, About 20% of slices shows augmentation of LTP if the third TBS is given 90 min later; the relative frequency of augmenting LTP increases with time. This augmentation of LTP is blocked by APV.L, Model of conversion of NZ to AZ followed by the subsequent growth of NZ over the time course following LTP. The colors are the same as inE–GandL, and are adapted fromBell et al. (2014);H–K are adapted fromCao and Harris (2014). DCV, Dense-core vesicle.
These observations led our collaborators to investigate the dynamics of endosomal compartments in cultured neurons. When the cultures were exposed to glycine, they produced LTP and recruited endosomes into dendritic spines for at least 20 min (Fig. 9I;Park et al., 2006). In P15 hippocampal slices, TBS-induced LTP recruited amorphous vesicular clumps into dendritic spines immediately after the induction of LTP; this ef-fect returned to control levels by 30 min post-TBS (Fig. 9J–M). Curiously, at 2 h post-TBS many small spines had formed and had more endosomes (Fig. 9N–P;Kulik et al., 2019). These find-ings suggest an important role for endosomal structures in spi-nogenesis and the maintenance of new dendritic spines following TBS-induced LTP.
Prominent in the literature is the idea that dendritic spines can split to form new spines. One step in this process is thought to involve the insertion of a small protrusion called a spinule to divide the presynaptic bouton. This idea was dispelled by three-dimensional quantitative analyses of spinules (Fig. 10A;Spacek and Harris, 2004). The results showed that instead of “splitting” presynaptic axons, spinules are encapsulated by their presynaptic axons; furthermore, the cytoplasmic side of the encapsulating membrane has a coat (Fig. 10B). Spinules can also be engulfed by nonsynaptic regions of neighboring axons, perisynaptic astroglia (Fig. 10C), and, occasionally, other dendrites. Together, these observations suggest that spinules are involved in an active pro-cess of transendocytosis where integral membrane ligands can be transported between cells.
The spine-splitting hypothesis also proposes that dendritic spines can split into two or more spines sharing the same presyn-aptic axon. Two key findings argue against this hypothesis. First, different heads of branched dendritic spines, the presumed split-ting intermediaries, rarely share the same presynaptic axon—in fact, this configuration has not yet been seen in area CA1 (Sorra et al., 1998;Fiala et al., 2002). This finding suggests that branched spine heads form independently to synapse with separate axons (Sorra et al., 1998;Fiala et al., 2002). Second, when neighboring spines on the same dendrite share the same presynaptic bouton, multiple long processes, including other axons, pass between the spines (Fig. 10D). To allow an existing spine to split, the inter-vening processes would have to disconnect from synapses along their hundreds of micrometers of length, pull away, let the spine split, and then rethread their way back through the neighboring spines, which is impossible in the time frame of normal plasticity! Thus, as argued further in the original article, spines branch, but preexisting synapses do not split.
Since the magnitude of LTP does not change between 30 min and 2 h post-TBS, we were curious to know whether there might be a structural basis for understanding the growth of the PSD first detected at 2 h, despite no further potentiation in the response. Long ago, we discovered a region of the postsynaptic density that was apposed to a presynaptic site but had no docked or reserve presynaptic vesicles (Fig. 10E). This region was originally referred to as a vesicle-free transition zone (Spacek and Harris, 1998), but later we discerned this region to be a nascent zone that is remark-ably responsive to plasticity (Bell et al., 2014). Tomographic anal-ysis of 3 nm virtual sections confirmed that no synaptic vesicles were hidden within the depths of serial sections through a nascent zone (Fig. 10F). This nascent zone is distinct from the so-called perforated postsynaptic density where the density is divided by translucent cytoplasm and presynaptic vesicles are docked across from the PSD on both sides of the perforation (Fig. 10A,B1). Dense-core vesicles could be observed docking in the presynaptic region where a nascent zone most likely had
previously occurred, at the edge of an active zone (Fig. 10G; Sorra et al., 2006). These dense-core vesicles are attached to presynaptic vesicles via spicules and are recruited to the pre-synaptic boutons within 5 min after TBS induction of LTP (Bell et al., 2014). By 30 min, presynaptic vesicles were added, and the postsynaptic nascent zones disappeared or shrank, but the size of the whole PSD had not yet enlarged (Fig. 10H, top). By 2 h, the nascent zones reappeared, accounting for most of the PSD enlargement detected by 3DEM at this time (Fig. 10H, bottom;Bell et al., 2014).
The plasticity of nascent zones raised another important ques-tion. If PSD enlargement is not the basis for sustaining LTP, perhaps it prepares the synapse for subsequent plasticity. To test this hypothesis, we prepared hippocampal slices and subjected them to repeated bouts of TBS at various intervals (Cao and Harris, 2014). Two TBS episodes were delivered 5 min apart to demonstrate that LTP was indeed saturated. If a third episode was delivered an hour later, the potentiation remained unchanged, it was not augmented (Fig. 10I); but when the third episode was delivered after 4 h, LTP was reliably augmented (Fig. 10J). In-deed, when many slices were tested, augmentation failed in all cases if the delay was 30 – 60 min, but could occur after a 90 min delay (Fig. 10K). The augmentation of LTP was blocked by an NMDA receptor antagonist, suggesting that it uses the same un-derlying mechanism as the initial LTP. These findings generated a new hypothesis about the involvement of nascent zones in pro-ducing and augmenting LTP (Fig. 10L). Initially, a hippocampal slice has nascent zones available from the prior experience of the animal. By 5 min after the induction of LTP, dense-core vesicles and their tethered presynaptic vesicles are recruited to presynap-tic boutons. By 30 min, the dense-core vesicles merge with the presynaptic membrane and enlarge the active zone and fill the nas-cent zone with tethered vesicles. By 2 h, nasnas-cent zones are regener-ated, thus enabling subsequent augmentation of LTP. This delay in preparation of new nascent zones could be an underlying mecha-nism for the advantage of spaced over massed learning.
Presynaptic axons also undergo other forms of plasticity with LTP. Three-dimensional reconstructions of axons in CA1 stra-tum radiastra-tum revealed diversity among neighboring boutons, some with mitochondria, vesicles, and postsynaptic partners; but many lack mitochondria and/or postsynaptic partners, while others contain only a mitochondrion or vesicles, but not both (Fig. 11A,B;Shepherd and Harris, 1998). The overall number of docked and reserve vesicles are decreased in the presynaptic bou-tons at 30 min and 2 h after the induction of LTP (Fig. 11C,D; Bourne et al., 2013). The drop in vesicles at 2 h occurs predomi-nantly in boutons that contain mitochondria (Fig. 11E,F;Smith et al., 2016). Preliminary findings suggest that the reduced pool of presynaptic vesicles serves to enlarge the presynaptic bouton, perhaps also in preparation for later augmentation of LTP (Kirk et al., 2018).
Perisynaptic astroglial processes might also influence the plas-ticity of synapses. Astroglial processes occur at the interface of ⬃50% of hippocampal dendritic spines, but rarely, if ever, com-pletely surround the axon–spine interface (Fig. 12A–C;Ventura and Harris, 1999;Witcher et al., 2007). When new small dendritic spines form during slice recovery and control test pulses, they are less likely than larger stable spines to have perisynaptic astroglia at their perimeters (Witcher et al., 2007). In human epilepsy, dendritic spines are lost, and presynaptic axons crowd the re-maining large, multisynaptic spines (Fig. 12D). Perisynaptic as-troglial processes withdraw from these multisynaptic spines (Witcher et al., 2010). Whether astroglial processes respond
Figure 13. Diversity in spine and synapse structure from other brain regions.A, Purkinje cell dendrite (star) surrounded by dense neuropil in the vicinity of a nonspiny dendrite (non) from a local interneuron.B, Purkinje cell dendrite (star) near a small blood vessel (bv). The numbers used in panels A and B refer to individual spines that were illustrated in the original publication.C, Reconstructions with hidden lines on the backside removed, of two spines from the dendrite inA(thin lines) synapsing with two different axons (dark lines).D, 3D reconstruction of two neighboring spines sharing the same presynaptic axon.E, Five-headed spine, showing that heads 1 and 5 share their respective presynaptic boutons with different spines from the same dendrite (stars).F, Two spines sharing a presynaptic axon with a nonspiny dendrite.A–Fare adapted fromHarris and Stevens (1988).G, Biocytin-filled climbing fiber axons and responses showing paired-pulse depression. H, Filled parallel fibers with paired-pulse facilitation.I, 3D reconstruction of a proximal Purkinje cell dendrite (top) showing sites of synaptic contacts (red) made by the climbing fiber (blue, bottom). Panels on right show enlarged reconstructions of some of those contacts where some contain mitochondria (beige).J, 3D reconstruction of two parallel fibers (translucent blue) with vesicles (solid blue), mitochondria (beige), and synapses (pink).K, Cumulative frequencies of the number of release sites versus PSD area and the number of docked vesicles for climbing fibers (CF) and parallel fibers (PF).G–Kare adapted fromXu-Friedman et al. (2001).L, Electron micrograph illustrating a section through a CA3 branched thorny excrescence (arrows) containing postsynaptic densities (psd), polyribosome (pr), mitochondria (mc), smooth endoplasmic reticulum (ser), multivesicular bodies (mvb), and a spinule (sn).M, 3D reconstruction of the Thorny excrescence (yellow) inLwith its PSDs (light blue).N, Relative frequencies of characteristic subcellular features in 205 reconstructed CA3 branched spine heads.L–Nare adapted fromChicurel and Harris (1992).O, Head of a CA3 branched spine containing a spine apparatus (SA) and illustrating the active zone (AZ) showing docked giant clear vesicles (arrows), and small synaptic vesicles (arrowheads).P, Log-normalized histogram of vesicle sizes dockedat11AZsoffourreconstructedboutons.Insetshowsminiatureexcitatorysynapticpotentialsrecordedfromtheseboutonswheresomearethesmall,standardsize,whileothersreflectthefivefoldgreater size of the large vesicles.OandPare adapted fromHenze et al. (2002).Q–T, EMs from the mushroom body in young and old ants (Q,R, insets), and 3D reconstructions of the boutons and synapses (S,T, red) located in the center of the EMs inQandR.R–Tare adapted fromSeid et al. (2005). Scale bars, 1m (except as indicated inN).
ferentially after LTP in the adult and developing hippocampus remains an open and important question.
I actually began this journey studying dendritic spines of cer-ebellar Purkinje neurons (Fig. 13A,B;Harris and Stevens, 1988). The spines that synapse with the parallel fibers are sufficiently
tic axon, they were more uniform in size than spines that did not share the same presynaptic axons, and thus were less likely to have had the same activation history. When spines branched, different heads of the same branched spine did not share the same presyn-aptic axon; thus, like in hippocampus, cerebellar dendritic spines do not split (Fig. 13E). Interestingly, a parallel fiber that synapses with the nonspiny dendrite of an interneuron can also synapse with spines of a Purkinje cell dendrite.
Upon repeated stimulation, climbing fibers show paired-pulse depression (Fig. 13F), whereas the same stimulation deliv-ered to parallel fibers results in paired-pulse facilitation (Fig. 13G). Our collaborators asked whether the frequency of docked synaptic vesicles at active zones could explain these profound differences in synapse function at climbing-fiber versus parallel-fiber synapses (Xu-Friedman et al., 2001). The outcomes showed that the number of docked vesicles at the release sites of climbing-fiber (Fig. 13H) and parallel-fiber synapses (Fig. 13I) did not differ significantly (Fig. 13J). Among other explanations, this outcome suggested that some docked vesicles are not release ready, an interpretation that is consistent with numerous molec-ular studies of synaptic vesicles.
A side trip into hippocampal area CA3 provided new knowl-edge about large spines called thorny excrescences (Chicurel and Harris, 1992). These spines emerge from the proximal dendrites to synapse with presynaptic boutons of the mossy fibers that arrive from dentate granule cells (Fig. 13K). Upon reconstruc-tion, the spines were found to have multiple branches (Fig. 13L) that can synapse with one or more presynaptic boutons. Individ-ual heads of these branches host a variety of subcellular struc-tures: most have a postsynaptic density and contain smooth endoplasmic reticulum, about half contain polyribosomes, a third contain a multivesicular body, about a quarter have a spinule, and⬃10% contain a mitochondrion and/or a microtu-bule (Fig. 13M). Although not yet quantified, it is obvious that many of the spine heads also contain other endocytic compo-nents such as vesicles and tubules in addition to the multivesicu-lar bodies. The spine apparatus, which functions simimultivesicu-larly to the Golgi apparatus, is also evident in some spine heads (Fig. 13N). Thus, these spines have virtually all of the subcellular compo-nents of the dendritic shaft, but these compocompo-nents are isolated locally in the vicinity of their synapses. The presynaptic mossy-fiber boutons contain giant clear vesicles nearly twice the size of the standard glutamatergic vesicles (Fig. 13N,O). These giant vesicles provide an anatomical correlate for the giant miniature EPSPs measured at these synapses (Fig. 13O, inset, arrow;Henze et al., 2002).
A brief encounter with the ant brain revealed large presynaptic boutons that synapse with multiple postsynaptic protrusions (Seid et al., 2005), similar to the mossy fiber boutons. Unlike synapses in the mammalian hippocampus, cortex, and cerebel-lum, however, each protrusion shared with other protrusions a continuous density that fills the extracellular space (Fig. 13P,Q). These shared densities occupy a greater area of the bouton in young ants than in old ants from the same colony (Fig. 13R,S).
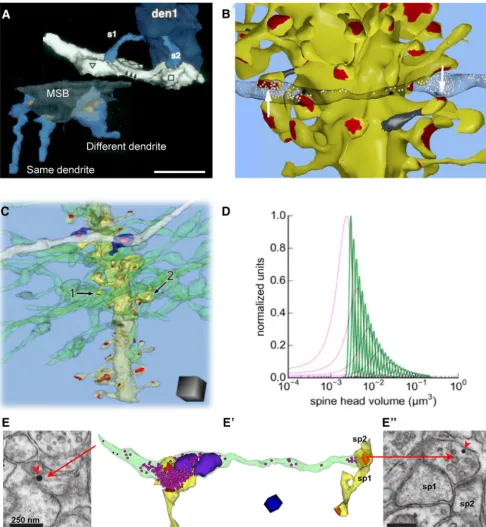
Long ago, we noticed that spines from a single CA1 dendrite sharing inputs with the same presynaptic axon were more similar in size than spines arising from different dendrites, even if those spines shared the same presynaptic input (Fig. 14A;Sorra and Harris, 1993). Recent reconstructions showed that the heads of axon-coupled same-dendrite spines in both CA1 and dentate gyrus were well correlated with a very small variance in their dimensions (i.e., they were highly precise), whereas spine neck dimensions were not (Fig. 14B,C;Bartol et al., 2015;Bromer et
al., 2018). Consistent with many of our prior reports, these re-constructions showed good correlations among spine head vol-umes, PSD surface areas, and the number of docked and nondocked presynaptic vesicles (Harris and Stevens, 1988,1989; Lisman and Harris, 1993;Harris and Kater, 1994;Sorra and Har-ris, 2000;Bartol et al., 2015;Bromer et al., 2018). Thus, we had a strong natural experiment for the application of signal detec-tion theory to calculate informadetec-tion content in synapse size and plasticity.
Using signal detection theory, we compared spinesin vivoin perfusion-fixed CA1, in dentate gyrus under control conditions, and in dentate synapses that had undergone induction of LTP at medial perforant path synapses (Bromer et al., 2018). LTP mark-edly increased the frequency of both small and large spines relative to control. This bidirectional expansion resulted in het-erosynaptic counterbalancing of total synaptic area per unit length of granule cell dendrite, as in adult area CA1 (Fig. 5, above). Control hemispheres exhibited 6.5 distinct spine sizes for 2.7 bits of storage capacity, while LTP resulted in 12.9 distinct spine sizes (3.7 bits of storage capacity). In contrast, control hip-pocampal CA1 synapses exhibited 26 distinguishable synaptic sizes (4.7 bits of storage capacity) with much greater synaptic precision than either control or potentiated dentate gyrus syn-apses (Fig. 14D). Because of stochastic variability of synaptic ac-tivation, this precision requires averaging activity over several minutes. In the past, theorists have treated synapses as 1 bit com-putational machines, being on or off, excitatory or inhibitory. These findings show that baseline capacity is much greater, and that synaptic plasticity alters total capacity. Furthermore, hip-pocampal subregions differ dramatically in their synaptic infor-mation storage capacity, reflecting their diverse functions and activation histories.
Since the beginning, I have longed for a means to identify activated synapses at the ultrastructural level. In the past, we have interpreted outcomes by comparing populations of synapses with different activation histories, but the question always re-mained regarding exactly which synapses had been activated. For the LTP studies, the samples were near large concentric bipolar electrodes, so it is reasonable to assume that most of the synapses were activated differentially by the control and experimental stimulation paradigms. We have recently developed a new ap-proach that should allow us to extend these findings along iden-tified axons (Fig. 14E). We developed a recombinant adeno-associated virus construct that expresses channelrhodopsin2 and mAPEX2 (Kuwajima et al., 2019). We proved that high-frequency optical activation specific to the labeled axons pro-duces late-phase LTP. In slices fixed with our standard protocol, tyramide signal amplification catalyzed by mAPEX2 deposited Alexa Fluor dye in the targeted axons. The dye-containing axons were identified after embedding by immunogold labeling in a subset of thin sections in 3DEM series. In tSEM images of an axon containing immunogold labeling, we could easily identify the stimulated axons and their subcellular contents, including syn-aptic vesicles, mitochondria, and synapses associated with post-synaptic dendritic spines (Fig. 14E⬘). With this approach, we can discover whether the patterns of synaptic plasticity revealed through differential population analyses are specific to the acti-vated spines.
We continue to work with our collaborators to explore the precision and variance of synapses across brain regions, various species, and ultimately in humans to understand the impact of brain disease on information storage. Please join us as we share the ongoing odyssey at SynapseWeb and 3DEM.org.
References
Bartol TM, Bromer C, Kinney J, Chirillo MA, Bourne JN, Harris KM, Se-jnowski TJ (2015) Nanoconnectomic upper bound on the variability of synaptic plasticity. Elife 4:e10778.
Bell ME, Bourne JN, Chirillo MA, Mendenhall JM, Kuwajima M, Harris KM (2014) Dynamics of nascent and active zone ultrastructure as synapses enlarge during long-term potentiation in mature hippocampus. J Comp Neurol 522:3861–3884.
Bourne JN, Harris KM (2011) Coordination of size and number of excit-atory and inhibitory synapses results in a balanced structural plasticity along mature hippocampal CA1 dendrites during LTP. Hippocampus 21:354 –373.
Bourne JN, Kirov SA, Sorra KE, Harris KM (2007a) Warmer preparation of hippocampal slices prevents synapse proliferation that might obscure LTP-related structural plasticity. Neuropharmacology 52:55–59. Bourne JN, Sorra KE, Hurlburt J, Harris KM (2007b) Polyribosomes are
increased in spines of CA1 dendrites 2 h after the induction of LTP in mature rat hippocampal slices. Hippocampus 17:1– 4.
Bourne JN, Chirillo MA, Harris KM (2013) Presynaptic ultrastructural plasticity along CA3—⬎CA1 axons during long-term potentiation in mature hippocampus. J Comp Neurol 521:3898 –3912.
Bromer C, Bartol TM, Bowden JB, Hubbard DD, Hanka DC, Gonzalez PV, Kuwajima M, Mendenhall JM, Parker PH, Abraham WC, Sejnowski TJ, Harris KM (2018) Long-term potentiation expands information con-tent of hippocampal dentate gyrus synapses. Proc Natl Acad Sci USA 115:E2410 –E2418.
Cao G, Harris KM (2012) Developmental regulation of the late phase of long-term potentiation (L-LTP) and metaplasticity in hippocampal area CA1 of the rat. J Neurophysiol 107:902–912.
Cao G, Harris KM (2014) Augmenting saturated LTP by broadly spaced episodes of theta-burst stimulation in hippocampal area CA1 of adult rats and mice. J Neurophysiol 112:1916 –1924.
Chicurel ME, Harris KM (1992) Three-dimensional analysis of the struc-ture and composition of CA3 branched dendritic spines and their synap-tic relationships with mossy fiber boutons in the rat hippocampus. J Comp Neurol 325:169 –182.
Chirillo MA, Waters MS, Lindsey LF, Bourne JN, Harris KM (2019) Local resources of polyribosomes and SER promote synapse enlargement and spine clustering after long-term potentiation in adult rat hippocampus. Sci Rep 9:3861.
Cooney JR, Hurlburt JL, Selig DK, Harris KM, Fiala JC (2002) Endosomal compartments serve multiple hippocampal dendritic spines from a wide-spread rather than a local store of recycling membrane. J Neurosci 22: 2215–2224.
Cui-Wang T, Hanus C, Cui T, Helton T, Bourne J, Watson D, Harris KM, Ehlers MD (2012) Local zones of endoplasmic reticulum complexity confine cargo in neuronal dendrites. Cell 148:309 –321.
Fiala JC, Harris KM (2001a) Cylindrical diameters method for calibrating section thickness in serial electron microscopy. J Microsc 202:468 – 472. Fiala JC, Harris KM (2001b) Extending unbiased stereology of brain
ultra-structure to three-dimensional volumes. J Am Med Inform Assoc 8:1–16. Fiala JC, Harris KM (2002) Computer-based alignment and reconstruction
of serial sections. Microsc Anal (Am Ed) 87:5– 8.
Fiala JC, Feinberg M, Popov V, Harris KM (1998) Synaptogenesis via den-dritic filopodia in developing hippocampal area CA1. J Neurosci 18: 8900 – 8911.
Fiala JC, Allwardt B, Harris KM (2002a) Dendritic spines do not split during hippocampal LTP or maturation. Nat Neurosci 5:297–298.
Fiala JC, Spacek J, Harris KM (2002b) Dendritic spine pathology: cause or consequence of neurological disorders? Brain Res Brain Res Rev 39: 29 –54.
Fiala JC, Kirov SA, Feinberg MD, Petrak LJ, George P, Goddard CA, Harris KM (2003) Timing of neuronal and glial ultrastructure disruption dur-ing brain slice preparation and recovery in vitro. J Comp Neurol 465:90 – 103.
Harris KM (1999) Structure, development, and plasticity of dendritic spines. Curr Opin Neurobiol 9:343–348.
Harris KM, Kater SB (1994) Dendritic spines: cellular specializations im-parting both stability and flexibility to synaptic function. Annu Rev Neu-rosci 17:341–371.
Harris KM, Landis DM (1986) Membrane structure at synaptic junctions in area CA1 of the rat hippocampus. Neuroscience 19:857– 872.
Harris KM, Stevens JK (1988) Dendritic spines of rat cerebellar Purkinje cells: serial electron microscopy with reference to their biophysical char-acteristics. J Neurosci 8:4455– 4469.
Harris KM, Stevens JK (1989) Dendritic spines of CA1 pyramidal cells in the rat hippocampus: serial electron microscopy with reference to their bio-physical characteristics. J Neurosci 9:2982–2997.
Harris KM, Teyler TJ (1983) Evidence for late development of inhibition in area CA1 of the rat hippocampus. Brain Res 268:339 –343.
Harris KM, Teyler TJ (1984) Developmental onset of long-term potentia-tion in area CA1 of the rat hippocampus. J Physiol 346:27– 48. Harris KM, Cruce WL, Greenough WT, Teyler TJ (1980) A golgi
impregna-tion technique for thin brain slices maintained in vitro. J Neurosci Meth-ods 2:363–371.
Harris KM, Jensen FE, Tsao B (1989) Ultrastructure, development, and plasticity of dendritic spine synapses in area CA1 of the rat hippocampus: extending our vision with serial electron microscopy and three-dimensional analyses. In: The hippocampus: new vistas: neurology and neurobiology series, Vol 52 (Chan-Palay and Kohler, eds), pp 33–52. New York: Liss.
Harris KM, Jensen FE, Tsao B (1992) Three-dimensional structure of den-dritic spines and synapses in rat hippocampus (CA1) at postnatal day 15 and adult ages: implications for the maturation of synaptic physiology and long-term potentiation. J Neurosci 12:2685–2705.
Harris KM, Perry E, Bourne J, Feinberg M, Ostroff L, Hurlburt J (2006) Uniform serial sectioning for transmission electron microscopy. J Neu-rosci 26:12101–12103.
Harris KM, Spacek J, Bell ME, Parker PH, Lindsey LF, Baden AD, Vogelstein JT, Burns R (2015) A resource from 3D electron microscopy of hip-pocampal neuropil for user training and tool development. Sci Data 2:150046.
Henze DA, McMahon DB, Harris KM, Barrionuevo G (2002) Giant minia-ture EPSCs at the hippocampal mossy fiber to CA3 pyramidal cell synapse are monoquantal. J Neurophysiol 87:15–29.
Jackson PS, Suppes T, Harris KM (1993) Stereotypical changes in the pat-tern and duration of long-term potentiation expressed at postnatal days 11 and 15 in the rat hippocampus. J Neurophysiol 70:1412–1419. Jensen FE, Harris KM (1989) Preservation of neuronal ultrastructure in
hippocampal slices using rapid microwave-enhanced fixation. J Neurosci Methods 29:217–230.
Kinney JP, Spacek J, Bartol TM, Bajaj CL, Harris KM, Sejnowski TJ (2013) Extra-cellular sheets and tunnels modulate glutamate diffusion in hippocampal neuro-pil. J Comp Neurol 521:448–464.
Kirk LM, Zatyko K, Bromer C, Bartol T, Sejnowski T, Harris KM (2018) Presynaptic ultrastructure changes in response to LTP stimulation in stra-tum radiastra-tum of hippocampal CA1 neuropil. Soc Neurosci Abstr 40: 202.11.
Kirov SA, Harris KM (1999) Dendrites are more spiny on mature hip-pocampal neurons when synapses are inactivated. Nat Neurosci 2: 878 – 883.
Kirov SA, Sorra KE, Harris KM (1999) Slices have more synapses than perfusion-fixed hippocampus from both young and mature rats. J Neu-rosci 19:2876 –2886.
Kirov SA, Goddard CA, Harris KM (2004a) Age-dependence in the homeo-static upregulation of hippocampal dendritic spine number during blocked synaptic transmission. Neuropharmacology 47:640 – 648. Kirov SA, Petrak LJ, Fiala JC, Harris KM (2004b) Dendritic spines disappear
with chilling but proliferate excessively upon rewarming of mature hip-pocampus. Neuroscience 127:69 – 80.
Kulik YD, Watson DJ, Cao G, Kuwajima M, Harris KM (2019) Structural plasticity of dendritic secretory compartments during LTP-induced syn-aptogenesis. Elife 8:e46356.
Kuwajima M, Mendenhall JM, Harris KM (2013a) Large-volume recon-struction of brain tissue from high-resolution serial section images ac-quired by SEM-based scanning transmission electron microscopy. Methods Mol Biol 950:253–273.
Kuwajima M, Spacek J, Harris KM (2013b) Beyond counts and shapes: studying pathology of dendritic spines in the context of the surrounding neuropil through serial section electron microscopy. Neuroscience 251: 75– 89.
Kuwajima M, Ostrovskaya OI, Cao G, Weisberg SA, Harris KM, Zemelman BV (2019) Ultrastructure of light-activated axons following optogenetic stimu-lation to produce late-phase long-term potentiation. bioRxiv. Advance on-line publication. Retrieved December 4, 2019. doi:10.1101/799890. Lisman JE, Harris KM (1993) Quantal analysis and synaptic
anatomy-integrating two views of hippocampal plasticity. Trends Neurosci 16:141–147.
Mishchenko Y, Hu T, Spacek J, Mendenhall J, Harris KM, Chklovskii DB (2010) Ultrastructural analysis of hippocampal neuropil from the con-nectomics perspective. Neuron 67:1009 –1020.
Ostroff LE, Fiala JC, Allwardt B, Harris KM (2002) Polyribosomes redistrib-ute from dendritic shafts into spines with enlarged synapses during LTP in developing rat hippocampal slices. Neuron 35:535–545.
Ostroff LE, Watson DJ, Cao G, Parker PH, Smith H, Harris KM (2018) Shifting patterns of polyribosome accumulation at synapses over the course of hip-pocampal long-term potentiation. Hippocampus 28:416 – 430.
Ostrovskaya OI, Cao G, Eroglu C, Harris KM (2019) Developmental onset of enduring long-term potentiation in mouse hippocampus. BioRxiv. Ad-vanced online publication. Retrieved December 4, 2019. doi:10.1101/787192. Ouyang Y, Kantor D, Harris KM, Schuman EM, Kennedy MB (1997) Visu-alization of the distribution of autophosphorylated calcium/calmodulin-dependent protein kinase II after tetanic stimulation in the CA1 area of the hippocampus. J Neurosci 17:5416 –5427.
Park M, Salgado JM, Ostroff L, Helton TD, Robinson CG, Harris KM, Ehlers MD (2006) Plasticity-induced growth of dendritic spines by exocytic trafficking from recycling endosomes. Neuron 52:817– 830.
Seid MA, Harris KM, Traniello JF (2005) Age-related changes in the num-ber and structure of synapses in the lip region of the mushroom bodies in the ant pheidole dentata. J Comp Neurol 488:269 –277.
Shepherd GM, Harris KM (1998) Three-dimensional structure and compo-sition of CA3—⬎CA1 axons in rat hippocampal slices: implications for presynaptic connectivity and compartmentalization. J Neurosci 18:8300 – 8310.
Smith HL, Bourne JN, Cao G, Chirillo MA, Ostroff LE, Watson DJ, Harris KM (2016) Mitochondrial support of persistent presynaptic vesicle mobiliza-tion with age-dependent synaptic growth after LTP. Elife 5:e15275. Sorra KE, Harris KM (1993) Occurrence and three-dimensional
struc-ture of multiple synapses between individual radiatum axons and their
target pyramidal cells in hippocampal area CA1. J Neurosci 13: 3736 –3748.
Sorra KE, Harris KM (1998) Stability in synapse number and size at 2 hr after long-term potentiation in hippocampal area CA1. J Neurosci 18:658 – 671.
Sorra KE, Harris KM (2000) Overview on the structure, composition, func-tion, development, and plasticity of hippocampal dendritic spines. Hip-pocampus 10:501–511.
Sorra KE, Fiala JC, Harris KM (1998) Critical assessment of the involvement of perforations, spinules, and spine branching in hippocampal synapse formation. J Comp Neurol 398:225–240.
Sorra KE, Mishra A, Kirov SA, Harris KM (2006) Dense core vesicles resem-ble active-zone transport vesicles and are diminished following synapto-genesis in mature hippocampal slices. Neuroscience 141:2097–2106. Spacek J, Harris KM (1997) Three-dimensional organization of smooth
en-doplasmic reticulum in hippocampal CA1 dendrites and dendritic spines of the immature and mature rat. J Neurosci 17:190 –203.
Spacek J, Harris KM (1998) Three-dimensional organization of cell adhe-sion junctions at synapses and dendritic spines in area CA1 of the rat hippocampus. J Comp Neurol 393:58 – 68.
Spacek J, Harris KM (2004) Trans-endocytosis via spinules in adult rat hip-pocampus. J Neurosci 24:4233– 4241.
Teyler TJ, Perkins AT 4th, Harris KM (1989) The development of long-term potentiation in hippocampus and neocortex. Neuropsychologia 27:31–39.
Ventura R, Harris KM (1999) Three-dimensional relationships between hippocampal synapses and astrocytes. J Neurosci 19:6897– 6906. Watson DJ, Ostroff L, Cao G, Parker PH, Smith H, Harris KM (2016) LTP
enhances synaptogenesis in the developing hippocampus. Hippocampus 26:560 –576.
Witcher MR, Kirov SA, Harris KM (2007) Plasticity of perisynaptic astroglia during synaptogenesis in the mature rat hippocampus. Glia 55:13–23. Witcher MR, Park YD, Lee MR, Sharma S, Harris KM, Kirov SA (2010)
Three-dimensional relationships between perisynaptic astroglia and hu-man hippocampal synapses. Glia 58:572–587.
Xu-Friedman MA, Harris KM, Regehr WG (2001) Three-dimensional comparison of ultrastructural characteristics at depressing and facilitating synapses onto cerebellar Purkinje cells. J Neurosci 21:6666 – 6672.