INTRODUCTION
The loss of stability of thin-walled covers oc-curring under operating load conditions is a com-monly encountered phenomenon in contemporary semi-monocoque aviation structures. The occur-rence of post-critical deformation is acceptable when the situation concerns the covering segment restricted by rigid structural elements and it has an elastic character. Therefore, the designing pro-cess must feature a series of analyses allowing for determining the stress distribution in this type of cases [4, 5]. The fast development of numerical calculation programs based mainly on the finite elements method currently allows for conducting non-linear simulations enabling to determine the state of deformation and stress distribution in any structures [6, 11]. On the basis of the results ob-tained numerically, it is also possible to designate the fatigue strength of the analysed structures. Obtaining reliable results is especially impor-tant due to the cyclic nature of the loads acting on the aviation bearing structures [12, 14]. The large number of factors affecting the initiation of fatigue damage compels constructors to verify the results of numerical calculations experimen-tally. The appearance of polymer model materi-als, such as polycarbonate, allows for conducting
relatively cheap experimental testing concerning the selected structure fragments.
The results presented in this study constitute a fragment of a broad research program, aimed at elaborating a thin-walled structure designing methodology based on non-linear numerical anal-yses, verified through experiments conducting using model and real materials.
SUBJECT AND SCOPE OF RESEARCH
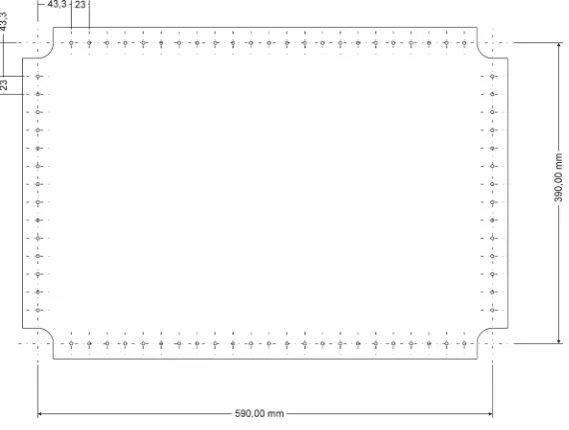
The subject of the testing included flat, thin-walled rectangular structures working under pure shear conditions, imitating a fragment of a semi-monocoque structure covering, placed between rigid framework elements (Fig. 1).
Two types of models were used during testing. The first of them was made of 2024 aluminium al -loy with the following parameters: E = 74000 MPa, ν = 0.33, R02 = 372 MPa, Rm = 470 MPa, constitut -ing the material commonly employed in aviation. The second element was made using polycarbon-ate with the trade name “macrolon” and the fol-lowing parameters: E = 3000 MPa, ν = 0.36, Re=50 MPa, used as the model material. In both cases, the thickness of elements amounted to 0.7 mm.
Fatigue Strength of Thin-Walled Rectangular Elements
in the State of Post-Critical Deformation
Przemysław Mazurek
11 Rzeszów University of Technology, The Faculty of Mechanical Engineering and Aeronautics,
Al. Powstańców Warszawy 8, 35-959 Rzeszów, Poland, e-mail: [email protected]
ABSTRACT
The paper presents the results of numerical analyses and static experimental testing of thin-walled rectangular ele-ments subject to post-critical deformation under shear conditions. The deliberations concerned the eleele-ments made of aluminium alloy and the model material. The obtained stress distribution was used to conduct a numerical simu-lation of the fatigue strength for a metal plate and testing under cyclic load conditions for both types of models.
Keywords: numerical analysis, fatigue tests, buckling, postbuckling.
Volume 13, Issue 2, June 2019, pages 84–91
https://doi.org/10.12913/22998624/106241
Research Journal
Accepted: 2019.04.09The testing was conducted in several stages: static experimental testing allowing for the deter-mination of the form and quantity of the post-crit-ical deformation, non-linear numerpost-crit-ical analyses obtaining the stress distribution and predicting the fatigue strength, as well as experimental fatigue testing aimed at ultimate verification of the ob -tained results. The purpose of the conducted test-ing was to determine the ability to use the model materials in the preliminary designing stage [13] and conducting comparative tests under cyclic load conditions.
STATIC EXPERIMENTAL TESTING
The experimental testing was conducted us-ing an installation built into the strength testus-ing cage intended for testing aviation structures. This solution guaranteed a large reserve of system ri-gidity, which directly contributed to the accuracy of the measurements. The tested structures were mounted in a rigid steel framework, the corners of which were connected with joints. The top right corner was installed in a fixed support with a joint, the top left corner was mounted in a sliding support, whereas the load was applied to the bot-tom right corner by means of a second-class lever system (Fig. 2). The drive consisted of the Zwick-Roell’s electromechanical actuator allowing for applying both static and dynamic loads in cycles programmed according to any load spectrum. The measurements of the reference point dis-placements and normal deformation distribution
in relation to the plate surfaces were conducted using the 3D Atos scanner from GOM.
During the testing, the aluminium alloy ele -ment was subjected to force P = 7500N, whereas the polycarbonate element was subjected to force P = 1008 N. The selection of proportions between the forces was dictated in both cases by the ratio of the yield strengths of the materials used.
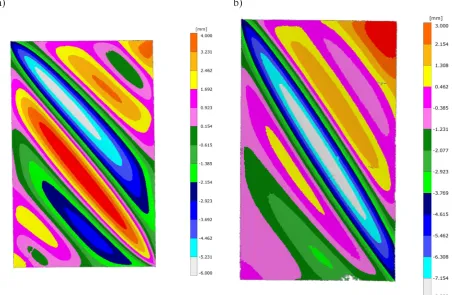
The conducted testing provided an image of the post-critical deformations for the polycarbon-ate and aluminium alloy elements. Figure 3 pres -ents the displacement distribution in the form of contour lines obtained as result of 3D scanning.
Special attention should be paid to the dif-ference in the form of deformation between the elements that are identical in terms of geometry. In the case of the polycarbonate plate, dominant, adjacent ridges were formed. The deformation became antisymmetric; the displacements have a similar value and opposite symbols. In the case of the duralumin element, there is a single ridge running along the diagonal, the value of which is substantial higher than the size of other ridges.
NON-LINEAR NUMERICAL ANALYSIS
The numerical models were generated using the MSC Patran software based on the finite el -ements method. Figure 4 presents the numerical model including the boundary conditions and the model loading for the aluminium-alloy ele-ment. Identical boundary conditions were used in the case of the model material, whereas the load
Fig. 2. a) measurement station with the 3D Atos scanner, b) loading system diagram
a) b)
Fig. 3. Displacement values obtained as result of scanning: a) polycarbonate element, b) duralumin element
was adapted to the polycarbonate properties and amounted to 1,008 N.
The analysed models consisted of ap-prox. 7,500 thin, shell-type, thin-walled finite elements, whereas the rigid framework was modelled using 3,000 thick, shell-type, finite
elements [16]. Continuous connections were used between the rigid mounting framework and the model, in the areas corresponding to the location of bolt connections in a real structure. This was aimed at imitating discrete connections causing local stress concentrations, but also al-lowed for obtaining a relatively small task size. Usually, such situations include the use of the MPC-type elements [16] allowing for the mod -elling of discrete connections, but in the case of non-linear procedures they generate numerous errors causing the distortion of results or pre-vent the solution of a problem. The calculations were conducted using the MSC.Marc solver and applying the Newton-Raphson method, with an adaptive state control [1, 3, 7, 8].
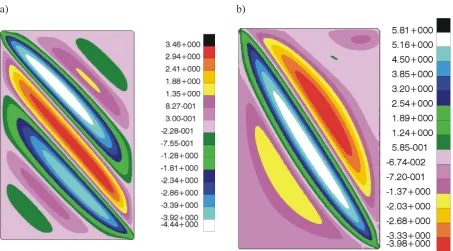
The conducted numerical analyses allowed for obtaining the post-critical deformations fields for both cases of the analysed elements, demonstrating compliance with the values ob-tained during the 3D scanning, constituting part of the experimental testing. Similarly as in the case of real structures, the polycarbonate plate demonstrated the formation of two dominant, adjacent ridges with opposite displacement signs in the normal direction, in relation to the structure’s plane, whereas the duralumin plate is characterised by a single ridge running along the diagonal (Fig. 5).
The presented results of numerical calcu-lations demonstrate high conformity with the
Fig. 4. Numerical model of the tested structures
a) b)
Fig. 5. Images of contour lines presenting the normal displacements: a) for
results obtained during experimental testing, both in terms of quality and quantity. How-ever, none of the cases featured additional ridges in the corners. These types of discrep-ancies result from the idealised nature of the numerical model.
The second criterion of evaluating the numer-ical model was the compliance of the representa-tive equilibrium paths demonstrating the defor-mation angle in the load function (Fig. 6).
The comparison of the representative bal-ance paths, in both cases, shows high confor-mity between the experimental testing and the numerical calculations. The difference between the result of the numerical analysis and the ex-perimental testing for the polycarbonate model does not exceed 9%. In the case of the alumin -ium alloy model, the discrepancy amounted to approx. 15%. In both cases, the numerical
models demonstrated a slightly higher rigidity than real structures.
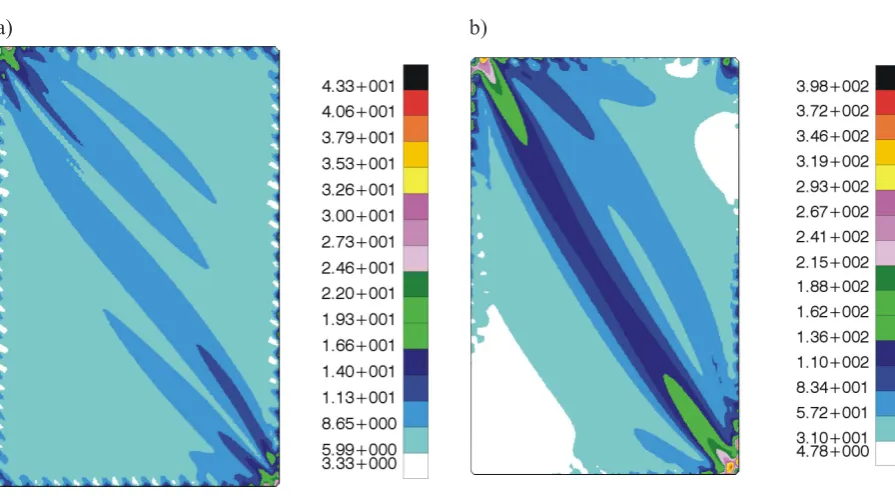
On the basis of the satisfactory compliance of the deformation form and the balance paths, it is possible to deem the stress distribution ob-tained as result of non-linear numerical analyses as reliable. The distribution of stress reduced acc. to the Huber-Misses-Hencky hypothesis is presented in Figure 7.
The analysis of the stress field distribution demonstrates a certain similarity between both analysed elements despite substantial differ-ences in the deformation form. In both cases, maximum stress values and very high gradients can be observed in the corners of elements. Additionally, the diagonal features increased stress values in both cases, which is caused by the occurrence of strong bending effects along the ridges.
a) b)
Fig. 6. Representative balance paths: a) for the polycarbonate element, b) for the duralumin element
a) b)
-CALCULATIONS AND FATIGUE TESTING
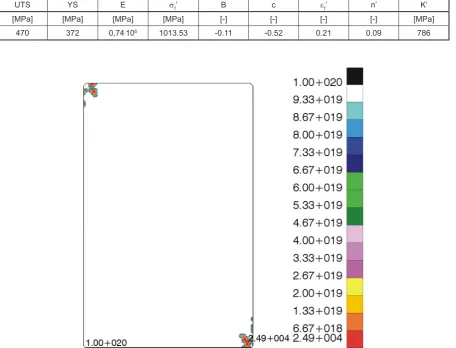
The stress distribution obtained using the non-linear numerical analyses became the basis for determining the fatigue strength of the anal-ysed structures. The simulation for the alumini-um alloy element was conducted using the MSC. Fatigue software [15]. Unfortunately, the pro-gram cannot be used for calculations of plastics, thereby limiting the ability of generating material models made solely of metal. The calculations were conducted on the basis of assumptions of the ε-n analysis (low-cycle fatigue) [10], indicat -ing the areas exposed to 2 mm cracks. The calcu-lations required generating a model made of the 2024 aluminium alloy [2,9] using the “Material Management” module. The alloy properties are presented in Table 1.
The calculations were conducted for sinusoi-dally variable cyclic loads with a symmetric na-ture. The conducted simulations allowed for ob-taining a contour line image presenting the area exposed to fatigue cracks (Fig. 8).
The calculations demonstrated the occurrence of a 2 mm crack in the corner after approx. 24,900 cycles. Due to the high number of factors affect -ing the fatigue strength under actual conditions, experimental testing of fatigue was conducted for both polycarbonate and aluminium alloy struc-tures. As result of the experimental testing, the polycarbonate model featured a field of over a dozen cracks of approx. 2 mm in length, located in the corner, after approx. 24,000 cycles. In the case of the aluminium alloy model, approx. 3 mm cracks were also observed in the corner after ap-prox. 21,000 cycles. The fatigue damage is pre -sented in Figure 9.
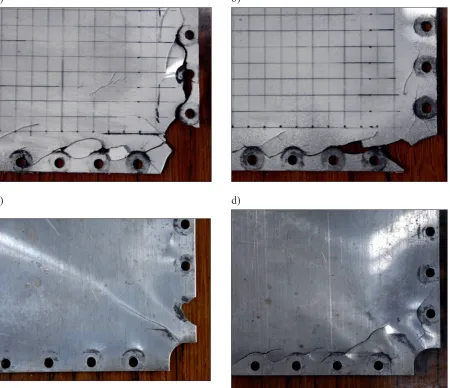
Further testing, conducted up to 35,000 cy -cles, cause a rapid expansion of the cracks in both cases and caused destruction in the mounting ar-eas of the tested structure to the rigid frameworks. The form of destruction of the tested elements is presented in Figure 10.
In both cases, the form of destruction, ob -tained after 35,000 cycles, demonstrates certain qualitative similarities. This is especially visible
Table 1. Properties of alloy 2024
UTS YS E sf’ B c ef’ n’ K’
[MPa] [MPa] [MPa] [MPa] [-] [-] [-] [-] [MPa]
470 372 0,74.105 1013.53 -0.11 -0.52 0.21 0.09 786
in relation to the corresponding areas presented in Figure 10b and 10d. Practically identical crack shapes are visible for elements made of various materials. In the case of the opposite corner in
which the first crack appeared (Fig. 10a and 10c), it is possible to notice a similar crack along the element diagonal, as well as fatigue destruction of areas interoperating with mounting elements.
a) b)
Fig. 9. Fatigue openings formed as result of cyclic loading: a) for the poly-carbonate element, b) for the duralumin element
a) b)
c) d)
Fig. 10. Fatigue cracks after 35,000 cycles: a) bottom left corner of the polycarbon -ate element, b) top right corner of the polycarbon-ate element, c) bottom left
CONCLUSIONS
The conducted numerical calculations and static experimental testing demonstrated the oc-currence of various post-critical deformations, depending on the used material. The polycar-bonate structure featured two dominant ridges, whereas the aluminium alloy structure featured a single ridge along the diagonal. These types of differences between the post-critical deformation forms obtained from elements made from various materials raise the question about the purposeful-ness of conducting this type of testing with the use of polymer model materials.
Despite substantial differences in the forms of deformation, the stress distribution obtained during numerical calculations demonstrated a certain similarity in the case of both materials used. The maximum stress values and their sub-stantial concentration were observed in the plate corners, which suggests the risk of occurrence of fatigue cracks in these areas. The numerical simu-lations of fatigue performance conducted for the duralumin structure allowed for determining the area featuring the risk of occurrence of a 2 mm fatigue cracks field. The number of cycles after which there is a risk of occurrence of fatigue risks amounts to 24,900. The experimental testing with the use of oscillatory cyclic loads demonstrated the occurrence of fatigue damage after approx. 24,000 cycles in the case of the polycarbonate model and after approx. 21,000 cycles in the case of the aluminium alloy model. This provides a discrepancy in the results of 3.6% for the poly -carbonate and 15.6% for the aluminium alloy. Due to the number of factors affecting the fatigue performance under actual conditions, the corre-spondence of the obtained results can be deemed as satisfactory.
REFERENCES
1. Bathe K.J.: Finite element procedures in
engineer-ing analysis, Prentice-Hall, Englewood Cliffs 1982
2. Benachour N., Hadjoui A., Benachour M.,
Benguediab M.: Stress ratio and notch effect on fatigue crack initiation and propagation in 2024 Al-alloy. International Journal of Mechanical and Mechatronics Engineering, 5(7), 2011, 1384–1387. 3. Debski H.: Stability problems of compressed
thin-walled structures. Advances in Science and
Technology Research Journal, 12(4), 2018, 190–198.
4. Debski H., Teter A.: Numerical and experimental
studies on the limit state of fibre-reinforced com -posite columns with a lipped channel section under
quasi-static compression. Composite Structures, 133, 2015, 1–7.
5. Falkowicz K., Debski H.: Postbuckling behaviour
of laminated plates with a cut-out. Advances in
Science and Technology Research Journal, 11(1), 2017, 186–193.
6. Falkowicz K., Ferdynus M., Debski H.: Numerical
analysis of compressed plates with a cut-out op-erating in the geometrically nonlinear range.
Eksploatacja i Niezawodnosc – Maintenance and Reliability, 17(2), 2015, 222–227.
7. Felippa C.A.: Advanced finite element meth
-ods, (ASEN 5367) Dept. of Aerospace Eng. Sci. Bouilder, Colorado 2006.
8. Felippa C.A.: Nonlinear finite element meth
-ods, (ASEN 5107) Dept. of Aerospace Eng. Sci. Bouilder, Colorado 2006.
9. Khan S.S.: Low cycle lifetime assessment of Al
2024 alloys, Helmholtz-Zentrum Geesthacht, Zentrum für Material- und Küstenforschung GmbH, Geesthacht 2012.
10. Kocańda S., Szala J.: Podstawy obliczeń zmęczeniowych. Wydawnictwo Naukowe PWN, Warszawa 1997.
11. Kopecki T.: Numerical-experimental analysis of
the post-buckling state of a multi-segment and multi-member thin-walled structure subjected to torsion; Journal of Theoretical and Applied
Mechanics, 49(1), 2011, 227–242.
12. Kopecki T.: Numerical and experimental analysis
of post-critical deformation states in a tensioned plate weakened by a crack. Journal of Theoretical
and Applied Mechanics, 48(1), 2010, 45–70. 13. Kopecki T., Mazurek P.: Determination of stress
distribution patterns in post-criticaldeformation states of thin-walled skins subjected to operating
loads. Eksploatacja i Niezawodnosc – Maintenance and Reliability, 16(4), 2014, 608–615.
14. Kopecki T.; Święch Ł.: Experimental and numeri -cal analysis of post-buckling deformation states
of integrally stiffened thin-walled components
of load-bearing aircraft structures. Journal of
Theoretical and Applied Mechanics, 52(4), 2014, 905–915.
15. MSC Software: MSC Fatigue 2017, User’s Guide.
MSC Software Corporation, 2016.
16. MSC Software: MSC MARC 2017, User’s Guide.
MSC Software Corporation, 2016.
17. Wysmulski P., Debski H., Rozylo P., Falkowicz K.:
A study of stability and post-critical behaviour of