AN EXPLICIT AND CONTINUOUS FRICTION FACTOR
CORRELA-TION FOR HELICAL TUBES WITH ARBITRARY ROUGHNESS
Ralph Eismann
a,†, Robert Adams
ba University of Applied Sciences and Arts Northwestern Switzerland FHNW, Institute of Energy in Buildings, CH-4132 Muttenz, Switzerland b Eidgenössische Technische Hochschule ETH, Laboratory of Nuclear Energy Systems, CH-8092 Zurich, Switzerland
ABSTRACT
Convergence of numerical schemes for pipe network analysis requires continuous modelling of pressure losses in the transition region between laminar and turbulent regions. Several existing correlations for the friction factor of straight pipes and helical tubes are presented. Based on these correlations a new explicit correlation for helical tubes with arbitrary surface roughness is derived. The friction factor is expressed as a continuous function of the Reynolds number covering laminar, transitional, and turbulent flow regions. Potential sources of error are also discussed, including the effects of tube deformation caused by the bending process.
Keywords: Pressure loss, friction factor, pipe flow, helical tube.
†Corresponding author. Email: [email protected]
1. INTRODUCTION
Helical tube heat exchangers are widely used for heating, cooling, and solar thermal applications. Fig. 1 shows an example with five parallel coils made of carbon steel tubes for a large solar thermal storage tank.
Fig. 1 Helical coil heat exchanger under construction, with five parallel coils (Courtesy of Jenni Energietechnik AG, CH-3414 Oberburg).
To limit pressure losses and to avoid flow noise these heat exchangers are often designed for flow velocities below 1.5 m/s. In addition, cooling circuits and solar thermal plants mostly use water-glycol mixtures as a heat transfer medium, which are about 10 times more viscous than water at the same temperature. Therefore, the Reynolds numbers are often quite low and cover the laminar, transitional, and the beginning of the turbulent regions. The width of the
transition region depends on the geometry of the flow channel and on the flow conditions at the inlet. From an engineering point of view, the predictability of the exact location of this region is not important. However, convergence of numerical schemes for thermal-hydraulic pipe network analysis requires continuous interpolation between laminar and turbulent regions.
Since the work of Eustice (1911), Dean (1927) and Dean (1928) on laminar flow in curved tubes, many researchers contributed experimental and/or theoretical work in this field. Ito (1959) derived friction factor correlations for turbulent flow in smooth, curved tubes, based on the 1/7-power velocity distribution law and the logarithmic velocity distribution law. These correlations contain the parameter, d/D, where d is the inner diameter of the tube and D its diameter of curvature. Application of these correlations is limited to a certain range of diameter ratios. Recently, Zhao et al. (2016) published an implicit friction factor correlation for turbulent flow in helical tubes with arbitrary roughness. The critical Reynolds number, Recrit = 2×10⁴∙(d/D)0.32, was taken from Ito (1959, Eq. 11). Their correlations
contain the same parameter, d/D. Consequently, application of these correlations is also limited to a certain range of diameter ratios. Mishra and Gupta (1979) derived friction factor correlations for laminar and turbulent flow in smooth helical tubes which are applicable in the limit of infinite curvature diameter, D → ∞. Based on their correlations a more general friction factor correlation is derived in Section 2, featuring the following properties:
In the limit of infinite curvature diameter the friction factor equals the value for straight pipes.
The correlation covers laminar, transitional and turbulent flow in a continuous way.
The correlation is valid for pipes with arbitrary roughness.
Parts of this article build on the corresponding section of the textbook on thermal hydraulic dimensioning of solar plants by
Eismann (2017, p.39-43).
Frontiers in Heat and Mass Transfer
In the following section, several terms and correlations will be introduced for later use.
1.1 Correlations for laminar and turbulent flow in straight pipes
The pressure loss, Δp, is expressed as a function of the dimensionless Darcy-Weisbach friction factor, λ, the pipe length, l, its inner diameter,
d, and the volumetric kinetic energy of the liquid, ρw2/2, where ρ is the
density and w the average flow velocity:
2 2
l p w
d
(1)
Flow in straight pipes up to a critical Reynolds number of about Recrit = 2200 is considered laminar. The friction factor, derived analytically from the steady form of the Navier-Stokes equation, is
64
with Re Re
lam
wd
. (2)
For turbulent flow in hydraulically smooth, straight pipes and Reynolds numbers in the range Recrit < Re < 105, friction is well described by the correlation of Blasius (1913):
0.25 0.3164 Re turb
(3)
For turbulent flow in pipes with arbitrary roughness the implicit correlation of Colebrook-White (1939) is often used:
10
1 2.51
2log
3.71 Re
turb turb d
(4)
The dimensionless ratio ε/d is the relative roughness of the pipe wall. Equations (1) to (4) are discussed in detail and within a historical context by Brown (2002).
Explicit approximations of the Colebrook-White correlation (4) are preferred because of computational efficiency. Zigrang and Sylvester (1985) provided a review on explicit correlations for the turbulent region and derived several correlations of various accuracy and complexity. Equation (5) shows the corrected form of Zigrang and Sylvester (1985, Eq. 14) as presented in U.S.NRC (2001, Eq. 3.3-206):
10 10 0.9
1 2.51 21.25
2 log 1.14 2 log
3.7 Re Re
turb d d
(5)
Brkic (2011) discussed 21 explicit correlations for the turbulent flow region, among them his own approximation as well as the correlation of Zigrang and Sylvester (1985) and the correlations of Churchill (1977) which are shown in Eqs. (7) and (8). Winning and Coole (2013) extended the review to 28 explicit correlations. All authors defined the accuracy of these correlations by the relative difference to the Colebrook-White correlation (4).
The conditions for the transition between laminar and turbulent flow are discussed in detail by Mullin (2011). There exists a critical Reynolds number of the order Recrit = 2000, below which any disturbances decay exponentially and the flow will eventually become laminar. On the other hand, there is no critical Reynolds number above which arbitrarily small disturbances will cause transition to turbulent flow. Draad et al. (1998) have shown experimentally that laminar flow in very smooth pipes can persist up to Re ≈ 6 × 10⁴ if the inlet
disturbances are thoroughly minimized and vibrations are kept from the pipe. In real-world installations, however, flow disturbances induced by non-ideal inlet conditions of pipe sections cause transition to fully
turbulent flow above Returb ≈ 3000 to 4000. In the transition region between Recrit and Returb the probability of turbulent flow increases with rising Reynolds number.
1.2 Continuous correlations covering laminar, transitional, and turbulent flows in straight pipes
Continuous modelling of the transition region is a prerequisite for the convergence of numerical schemes used in pipe network analysis. In this section, three different approaches are presented. The thermal-hydraulic system code RELAP5 (see U.S.NRC 2001; p. 139) uses the correlation of Zigrang and Sylvester (1985), Eq. (5), with a linear interpolation between Recrit = 2200 and Returb = 3000 for the transition region:
,3000 ,2200
,22008250 3.75
Re turb lam lam
(6)
Churchill (1977) proposed an explicit correlation for straight pipes with an arbitrary roughness,
1 12 123 2
8 1
8
Re A B
, (7)
with coefficients A and B defined as follows:
16 4 16
0.9
1 3.753 10
2.457 ln ;
Re
7 Re 0.27
A B
d
(8)
This correlation is implemented in the thermal-hydraulic system code TRACE as shown in U.S.NRC (2007; p. 172).
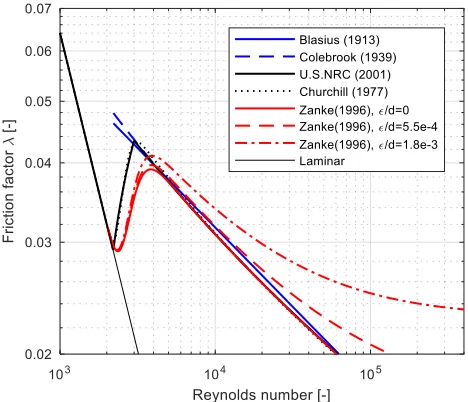
Fig. 2 Friction factors for straight pipes with a relative roughness of
ε/d = 0, 5.5×10⁻⁴ and 1.8×10⁻³, calculated by different
correlations.
1.2 2 1010
2.7 log Re 2log
Re 3.71
turb
d
(9)
exp exp 6.75 0.0025Re 1
turb lam
P P (10)
The friction factor is defined as a linear combination of the laminar and the turbulent values, weighted by their respective probabilities:
1 Pturb
lam Pturb turb (11)
Fig. 2 shows the friction factors as a function of Reynolds number as calculated by the correlations above. The two curves for a relative roughness larger than zero refer to a pipe with 0.027 m inner diameter and absolute roughness values of ε = 0.015 mm and ε = 0.05 mm. In the transition region the interpolation used in RELAP5 and the correlation of Churchill (1977) are practically identical.
1.3 Fully developed flow in smooth helical tubes
Helical tubes as shown in Fig. 3 are characterized by the inner diameter,
d, of the tube, the diameter, DH, of the helix, and the pitch, h.
DH
d
h
Fig. 3 Helical tube with helix diameter, DH, inner tube diameter, d, and pitch, h.
In his article about pressure loss in helical tubes Gnielinski (1986) expressed the diameter, D, of the tube curvature, as function of the helix diameter, DH , and the pitch, h:
2 1
H
H
h D D
D
(12)
In most cases the ratio of helix diameter and pitch, h/DH, is far below 0.3 so that in practice no distinction is made between curvature and helix diameter. The constant change of flow direction in helical tubes causes a secondary flow, which results in additional friction. On the other hand, this secondary flow has a damping effect on turbulence so that laminar flow can persist up to higher Reynolds numbers compared to straight pipes. The critical Reynolds number is given by Schmidt (1967) as follows:
0.45
,
Recrit H Recrit 1 8.6 d
D
(13)
Based on experiments with hydraulically smooth plastic tubes and diameter to curvature ratios, 0.003 ≤ d/D ≤ 0.15, Mishra and Gupta (1979, Eq.5 and Eq.10) derived friction factor correlations for laminar
and turbulent flow, valid for Reynolds numbers up to Re = 105. These
correlations were reformulated by Gnielinski (1986) as presented in Eq. (14) and Eq. (15). The friction factor for laminar flow is a function of the Dean number, De:
4, 64 Re 1 0.033 10De ; De Re
lam H
d log
D
(14)
The friction factor for turbulent flow in the range Recrit,H < Re < 105 is,
0.25
, 0.25
0.3164
1 0.095 Re Re
turb H
d D
. (15)
For the limit of infinite curvature, the laminar friction factor, Eq. (16), reduces to the laminar friction factor, Eq. (2), for straight pipes, while the friction factor for turbulent flow, Eq. (15), reduces to the Blasius correlation, Eq. (3). The contribution of secondary flow to the pressure loss depends on both the Reynolds number and the curvature,
D, of the helix. Fig. 4 shows a series of lines for curvature values, calculated with Eqs. (13), (14) and (15). Discontinuity between laminar and turbulent regions is illustrated, as well as the shift of the transition region to higher Reynolds numbers and the increase of friction factors as the diameter of curvature decreases.
Fig. 4 Laminar and turbulent friction factors for different ratios of pipe diameter, d, and curvature diameter, D.
2. DERIVED EQUATION FOR HELICAL TUBES WITH
ARBITRARY ROUGHNESS
Based on the following two hypotheses, the correlations of Mishra and Gupta (1979) can be extended for helical tubes with arbitrary roughness:
The effect of roughness on pressure loss in helical tubes is the same as with straight pipes.
By replacing the critical Reynolds number for pipe flow, Recrit, with the critical Reynolds number for curved tubes, Recrit,H, Eq. (10), can be adapted to describe the probability of turbulent flow in helical tubes.
4 10 ,64 Re 1 0.033 log De ; De 1
64 Re ; De 1
lam H
(16)
The correlation for the turbulent friction factor, Eq. (15), is modified by replacing the leading term, 0.3164/Re0.25, with the
correlation of Zanke (1996), Eq. (9):
1.2 210
, 10
0.5 0.25 2.7 log Re 2log
Re 3.71
1 0.095 Re
turb H
d
d D
(17)
The numbers in the probability function, Eq. (10), are replaced by constants a and b:
exp exp Re 1
turb lam
P a b P (18)
It is thus possible to adjust the location of the transition region as required. Fig. 5 shows the friction factors in the transition region calculated by the correlations of Churchill (1977), (U.S.NRC 2001), and Zanke (1996) using constants a and b as listed in Table 1.
Table 1 Constants within the probability function, Eq. (18), for turbulent flow and the associated transition range.
Source Transition range a [-] b [-] Zanke (1996) 2320 < Re < 4000 6.75 0.0025 Zanke (1996) adapted 2200 < Re < 3000 10.45 0.0043
Fig. 5 Friction factors in the transition region for straight, smooth pipes, calculated by different correlations.
The transition region defined by the probability function, Eq. (18), is shifted to the transition region for helical tubes using the ratio of the critical Reynolds numbers Recrit and Recrit,H :
, ,
, Re
exp exp Re 1
Re crit
turb H lam H
crit H
P a b P
(19)
Fig. 6 shows the probability for turbulent flow for straight pipes and for a helical tube with a curvature diameter of 0.9 m and a tube diameter of 0.0272 m.
The friction factor for helical tubes with a circular cross section, Eq. (20), is calculated analogously to straight pipes, using the respective probability function and the friction factors for laminar and turbulent flow:
1 ,
, , ,H Pturb H lam H Pturb H turb H
(20)
Fig. 6 Probability for turbulent flow in a straight pipe and in a helix with d = 0.0272 m and D = 0.9 m.
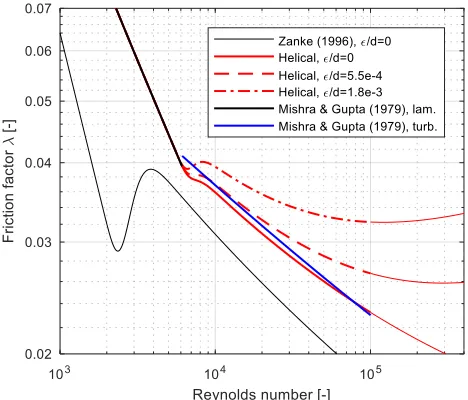
Fig. 7 shows the friction factors for a helical tube with 0.0272 m tube diameter and a curvature diameter of 0.9 m. The probability of turbulent flow is calculated by Eq. (18) using the parameters a = 10.45 and b = 0.0043. In the limit of infinite curvature the friction factors for any helical tube reduces to the friction factor for straight pipes.
3. DISCUSSION
3.1 Range of application
The new correlation, Eq. (17), was derived by replacing the Blasius pre-factor, Eq. (3), of the original correlation, Eq. (15), by the correlation of Zanke (1996) which can be used up to Re = 108. However, as the
following discussion shows, it is not advisable to extend the range of application to Reynolds numbers above Re = 105, which is the upper
limit of the experimental range covered by Mishra and Gupta (1979): Above a certain Reynolds number, which depends on the relative roughness, ε/d, the friction factor for a straight pipe becomes constant. One would expect the same characteristics with helical tubes, as stated by Zhao et al. (2016, p. 533). However, evaluation of Eq. (17) shows an increase of friction factor above Re ≈ 3 × 10⁵ for ε/d = 5.5 × 10⁻⁴ and
above Re ≈ 105 for ε/d = 1.8 × 10⁻³, as can be seen in Fig. 7. This is due
to the second term in Eq. (17) which characterizes the influence of curvature. However, there is no experimental data available to justify application of the correlation above Re = 105. It is therefore suggested
to limit the application range of Eqs. (16) and (17) to the range of values shown in Table 2.
Table 2 Application range of Reynolds number, relative roughness and diameter/ curvature ratio.
Reynolds number Re ≤ 105
Relative roughness 0 ≤ ε/d ≤ 1.8 × 10⁻³
Diameter/curvature ratio 0 ≤ d/D ≤ 0.15
3.2 Uncertainty of friction factors for smooth helical tubes
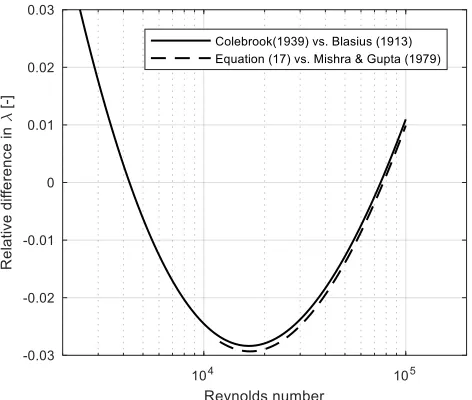
In accordance with the procedure of many authors including Zigrang and Sylvester (1985), Brkic (2011), and Winning and Coole (2013), the Colebrook-White correlation is taken as a benchmark against which all other correlations for straight pipes are tested. The deviation of the Blasius correlation from the Colebrook-White formula for hydraulically smooth pipes shown in Fig. 8 (continuous line) can be interpreted as error. On the other hand, Mishra and Gupta (1979) correlated their experimental data using the Blasius correlation. Consequently, their correlation can be taken as a benchmark for smooth helical tubes in a similar way. Replacing the Blasius pre-factor by the correlation of Zanke (1996), and comparing it to Eq. (17), will lead to an error of the same magnitude, which is also shown in Fig. 8 (dashed line).
Fig. 8 Relative friction factor differences for smooth, straight pipes and a smooth helical tube with d = 0.027 m and D = 0.9 m.
3.3 Effect of tube cross section deformation on pressure loss
Mishra and Gupta (1979) eliminated systematic errors of their experimental setup and the uncertainty of the pipe dimensions by measuring the pressure drop in straight and coiled configurations of the same pipe. They assumed the effect of cross section deformation due to bending forces negligible. In order to assess the validity of their assumption and to compare the magnitude of this effect to the uncertainty discussed in Section 3.2 the relative change of pressure loss as a function of small deformation is estimated as follows:
Small deformations of an initially circular cross section with radius, r, due to bending forces can be approximated by an ellipse characterized by the semiminor and semimajor axes, a and b. The deformation, c, is defined as c = r – a, and the relative deformation as
δ = c/r. The relative deformation is assumed to be in the range of 0 < δ ≤ 0.1, as shown in Fig. 9.
a
b
c r
p
δ = c/r= 0.1
Fig. 9 Deformation of a circular cross-section into an ellipse.
For small deformations of a thin-walled pipe the wetted perimeter,
P, can be considered constant. The semimajor axis, b, can be calculated iteratively using the approximation of the perimeter length by Ramanujan (Hardy et al. 1962; p.23-39), Eq. (21).
2
2 3
( ) 1 ;
10 4 3
a b P a b
a b
(21)
This can be further simplified with the approximation, c ≈ b – r,
which results in an error relative to the above-mentioned iterative approach of less than 0.5 % within the range considered here.
With this approximation the cross section of the deformed tube becomes Aδ = πab ≈ πr2(1– δ)(1+δ) = πr2(1– δ2). Turbulent momentum
transfer perpendicular to the flow direction causes a rather flat velocity profile and a practically homogeneous distribution of wall shear stress within a thin boundary layer along the perimeter. Therefore, the suitable scaling length is the hydraulic diameter,
4 h
A d
P
, (22)
which replaces the inner diameter in the turbulent friction factors for circular tubes. For other shapes of cross section, different definitions of the characteristic length are better suited (Duan et al. 2012).
In the case of laminar flow, however, wall shear along the perimeter of non-circular ducts is not uniform because the velocity gradient at the boundary depends on the velocity field of the whole cross section. Therefore, using the hydraulic diameter as the characteristic length in laminar friction factors for circular tubes will lead to errors. Based on the work of Karas (1959), Brauer (1971) derived a correction function, φ, for the laminar friction factor which is valid for 0 ≤ μ ≤ 1:
, ; 1.12 0.12cos 2.9
lam lam
For small deformations δ = c/r ≤ 0.1 the ratio, μ, as defined in Eq. (21), can be replaced by the relative deformation δ. Substituting the hydraulic diameter for the pipe diameter yields the Reynolds number in terms of volumetric flux, Q, and wetted perimeter, P,
4 4
Re w dh QA Q
A P P
, (24)
which is independent of the deformation.
For a given volumetric flux, constant fluid properties and small deformations δ < 0.1, the laminar and the turbulent friction factors, Eqs. (16) and (17), can be considered constant. Thus, the pressure losses for laminar and turbulent flow are inversely proportional to the cube of the flow area and, in the case of laminar flow, proportional to the correction function, Eq. (23).
2 2
3 3
1 1
;
turb lam
h h
w w
p p
d A d A
(25)
The relative changes of pressure loss due to deformation are
3
3 3
2
3 2
1
1 1
1
1
( ) 1
1 turb
lam
p p A p
p A
p
. (26)
Fig. 10 shows the influence of relative deformation on the laminar and turbulent pressure loss. As long as the relative deformation is below 0.1 the effect on the laminar and turbulent pressure loss is of the same magnitude as the maximum relative difference between the turbulent friction factors as shown in Fig. 8 and, therefore, negligible in accordance with Mishra and Gupta (1979).
Fig. 10 Effect of deformation on the flow area and the laminar and turbulent pressure loss.
4. CONCLUSIONS
Based on literature and theoretical considerations a correlation for the friction factor of helical tubes with arbitrary roughness was derived.
The correlation is valid for Reynolds numbers up to Re = 105, diameter
to curvature ratios d/D ≤ 0.15 and relative roughness ε/d ≤ 1.8 × 10⁻³. In
the limit of infinite curvature, the correlation reduces to the explicit correlation of Zanke (1996) for straight pipes.
The correlation covers laminar, transitional, and turbulent flow regions in a continuous way, thus fulfilling an essential precondition for the convergence of numerical schemes for pipe network analysis. Furthermore, the proposed correlation is explicit and thus avoids computational expense of implicit calculations. For these two reasons, the correlation is well suited for implementation into computer programs used to simulate and analyze pipe networks.
At present there is no experimental data for validation available. New experiments are necessary to prove the assumption that the effect of surface roughness on the pressure loss is the same as with straight pipes, and to extend the range of Reynolds numbers to values above Re = 105. Furthermore, experiments with different but carefully
controlled inlet conditions could provide valuable insight into the onset of turbulence in the transition region, and thus the means to validate the probability function, Eq. (19), for turbulent flow in helical tubes.
ACKNOWLEDGEMENTS
We would like to express our thanks to the Swiss Federal Office of Energy SFOE for the funding of the project SI/501007-01, in whose framework the correlation was derived.
NOMENCLATURE
A flow area [m3]
Aδ deformed flow area [m]
a semi minor axis [m]
b semi major axis [m]
c deformation [m]
D curvature diameter [m]
DH helix diameter [m]
d inner diameter [m]
dh hydraulic diameter [m] De Dean number [-]
h pitch [m]
l length [m]
P perimeter [m]
Plam probability for laminar flow [-]
Pturb probability for turbulent flow [-] Δp pressure loss [Pa]
Q volumetric flux [m3/s]
Re Reynolds number [-]
r radius [m]
w average flow velocity Q/A [m/s]
Greek Symbols
δ relative deformation [-]
δp relative change of pressure loss due to deformation [-]
ε wall roughness [m]
λ friction factor [-]
μ parameter in ellipse perimeter formula [-]
ν kinematic viscosity [m2/ s]
ρ density [kg/ m3]
φ pressure loss correction parameter [-]
Subscripts
H helix
h hydraulic
δ deformed cross-section
REFERENCES
Brauer, H., 1971, "Grundlagen der Einphasen- und Mehrphasen-strömungen," Sauerländer, Aarau, Frankfurt a.M.
Brkic, D., 2011, "Review of Explicit Approximations to the Colebrook Relation for Flow Friction," Journal of Petroleum Science and Engineering, 77 (1), 34-48.
http://dx.doi.org/10.1016/j.petrol.2011.02.006
Brown, G. O., 2002, "The History of the Darcy-Weisbach Equation for Pipe Flow Resistance," In: Environmental and Water Resources History, Washington, D.C., November 3-7 2002, 34-43, American Society of Civil Engineers.
https://doi.org/10.1061/40650(2003)4
Churchill, S. W., 1977, "Friction-Factor Equation Spans All Fluid-Flow Regimes," Chemical Engineering, 84 (24), 91-92.
Colebrook, C. F., 1939, "Turbulent Flow in Pipes, with Particular Reference to the Transition Region between the Smooth and Rough Pipe Laws," Journal of the Institution of Civil Engineers, 11 (4), 133-156.
https://doi.org/10.1680/ijoti.1939.13150
Dean, W., 1928, "LXXII. The Stream-Line Motion of Fluid in a Curved Pipe (Second Paper)," The London, Edinburgh, and Dublin Philosophical Magazine and Journal of Science, 5 (30), 673-695.
Dean, W., 1927, "XVI. Note on the Motion of Fluid in a Curved Pipe," The London, Edinburgh, and Dublin Philosophical Magazine and Journal of Science, 4 (20), 208-223.
Draad, A. A., Kuiken, G., Nieuwstadt, F., 1998, "Laminar–Turbulent Transition in Pipe Flow for Newtonian and Non-Newtonian Fluids," Journal of Fluid Mechanics, 377, 267-312.
https://doi.org/10.1017/S0022112098003139
Duan, Z., Yovanovich, M. M., Muzychka, Y. S., 2012, "Pressure Drop for Fully Developed Turbulent Flow in Circular and Noncircular Ducts," Journal of Fluids Engineering, 134 (6), 061201-061210. https://doi.org/10.1115/1.4006861
Eismann, R., 2017, "Thermohydraulische Dimensionierung von Solaranlagen : Theorie und Praxis der kostenoptimierenden Anlagenplanung," Springer Vieweg, Wiesbaden. ISBN: 978-3-658-07124-0.
https://doi.org/10.1007/978-3-658-07125-7
Eustice, J., 1911, "Experiments on Stream-Line Motion in Curved Pipes," Proceedings of the Royal Society of London Series A, Containing Papers of a Mathematical and Physical Character, 85 (576), 119-131.
Gnielinski, V., 1986, "Correlations for the Pressure Drop in Helically Coiled Tubes," International Chemical Engineering, 26 (1), 36-44.
Hardy, G. H., Aiyar, P. S., Wilson, B. M., 1962, "Collected Papers of Srinivasa Ramanujan," Chelsea Publishing Company, New York.
Ito, H., 1959, "Friction Factors for Turbulent Flow in Curved Pipes," Journal of Basic Engineering, 81 (2), 123-134.
Karas, K., 1959, "Stationäre Laminarströmungen durch Kanäle von elliptischem Querschnitt bei konstantem Druck oder statischer Druckverteilung," Ingenieur-Archiv, 28 (1), 117-153.
https://doi.org/10.1007/BF00536106
Mishra, P., Gupta, S., 1979, "Momentum Transfer in Curved Pipes. 1. Newtonian fluids," Industrial & Engineering Chemistry Process Design and Development, 18 (1), 130-137.
https://doi.org/10.1021/i260069a700
Mullin, T., 2011, "Experimental Studies of Transition to Turbulence in a Pipe," Annual Review of Fluid Mechanics, 43, 1-24.
https://doi.org/10.1146/annurev-fluid-122109-160652
Schmidt, E. F., 1967, "Wärmeübergang und Druckverlust in Rohrschlangen," Chemie Ingenieur Technik, 39 (13), 781-789. http://dx.doi.org/10.1002/cite.330391302
U.S.NRC, 2001, "RELAP5/MOD3.3 Code Manual Volume I: Code Structure, System Models, And Solution Methods," Division of Systems Research, Office of Nuclear Regulatory Research, U. S. Nuclear Regulatory Commission, Washington, D. C.
U.S.NRC, 2007, "TRACE V5. 0 Theory Manual. Field Equations, Solution Methods, and Physical Models," Division of Risk Assessment and Special Projects, Office of Nuclear Regulatory Research, US Nuclear Regulatory Commission, Washington, D. C.
Winning, H. K., Coole, T., 2013, "Explicit Friction Factor Accuracy and Computational Efficiency for Turbulent Flow in Pipes," Flow, turbulence and combustion, 1-27.
https://doi.org/10.1007/s10494-012-9419-7
Zanke, U., 1996, "Zum Übergang hydraulisch glatt: hydraulisch rauh," Wasser und Boden, 48 (10), 32-36.
Zanke, U., 1993, "Zur Berechnung von Strömungswiderstands-beiwerten," Wasser und Boden, 45 (1), 14-16.
Zhao, H., Li, X., Wu, X., 2016, "New Friction Factor Equations developed for Turbulent Flows in Rough Helical Tubes," International Journal of Heat and Mass Transfer, 95, 525-534.
https://doi.org/10.1016/j.ijheatmasstransfer.2015.12.035
Zigrang, D. J., Sylvester, N. D., 1985, "A Review of Explicit Friction Factor Equations," Journal of Energy Resources Technology, 107 (2), 280-283.