VOL. 1, NO. 2, December 2014, pp. 127-132
127
I. INTRODUCTION
Electromagnetic (EM) field probes are used in the measurement of electromagnetic compatibility (EMC) testing. To ensure that the measurements are reliable, the EM field probes must be calibrated. The conventional EM field probes calibration methods are defined in terms of theoretical and experimental models of EM field generation [1-4]. Using standard gain horn antennas to establish a standard field inside an anechoic chamber is one of the most widely used methods for calibrating probes for IEC61000-4-3 applications [5]. Also, the standard IEC61000-4-20 [6] provides the procedure for carrying out the calibration by using the transverse electromagnetic (TEM) cell.
However, the EM field probe calibration results may show differences when the probe is calibrated in different environments. Therefore the environment and method for an EM field probe calibration are very important. In that sense, the TEM cell has become popular test apparatus to calibrate the EM field probes. Because the TEM cell, which is isolated from outside electromagnetic waves, can provide TEM mode wave with specified electric and
magnetic field strengths [7-14].
The IEC61000-4-20 is to be describing verification methods of the TEM cell for EMC tests. The measurement information is taken into account by the statistical approach, which is Normal distribution. The TEM mode is taken into account as dominant, if statistically at least 75 % of the measured secondary components are at least 6 dB smaller than the primary components of the field. The statistical description of the ratio of secondary and primary field component is based on the assumption of a normal distribution. However, this normal distribution is not applicable for the verification of TEM mode.
In this paper, the verification of TEM mode with the statistical approach in TEM cell is suggested. We present various statistical distributions of electromagnetic fields in a four-port TEM cell.
This paper is organized as follow. In section II, this paper explains the TEM mode verification for each mode. Section III concludes this paper.
II. TEM MODE VERIFICATION
The four-port TEM cell used for the TEM mode
Study of statistical distribution for four-port TEM cell
Author: Sangbong Jeon
1,*and Jong-Hwa Kwon
1Abstract
The transverse electromagnetic (TEM) cells are widely used for electromagnetic compatibility (EMC) testing and field probe calibrations. We propose the verification of TEM mode with statistical method using a four-port TEM cell. The verification results are compared with Normal, Rayleigh, and Gamma distribution. As a result, the 75 % quantile of the Rayleigh distribution is excellent agreement with the true quantiles for a number of calibration points.
Key Words: Electromagnetic compatibility testing, field probe calibration, statistical distribution, TEM cell
Manuscript Received December 30, 2014; Revised January 20, 2015; Accepted January 31, 2015. (ID No. JMIS-2014-0013) Corresponding Author (*): sangbong Jeon, Electronics and Telecommunications Research Institute (ETRI), 218 Gajeong-ro, Yuseong-gu, Daejeon, 305-700, +82-42-860-6408, [email protected]
128 verification is shown in Figure 1. The four-port TEM cell
has two parallel septa connected to four ports at each end. We set the lengths of regions A and B to be equal, that is,
lc=lt. The overall size (lc+2lt) of the cell is 900 mm in
length, 435 mm in width and 450 mm in height. The characteristic impedance is 50 ohms at each port.
Fig. 1. Geometry of a four-port TEM cell.
Fig. 2. Operational method to generate TEM mode of the four-port TEM cell.
Fig. 3. Field evaluation positions using a field probe.
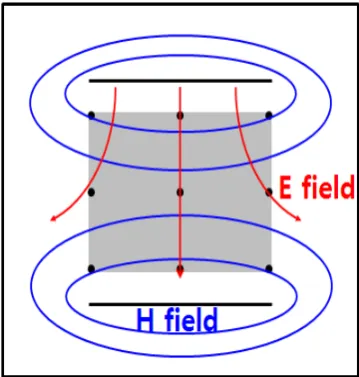
Fig. 4. Distribution of Electric and Magnetic fields inside TEM cell.
TABLE 1. FOURMULAS FOR NORMAL, RAYLEIGH, AND GAMMA DISTRIBUTION.
Normal distribution
Rayleigh distribution
Gamma distribution
cdf
75 %
quantile -
The operation method to generate TEM mode is shown in Figure 2. To generate the TEM mode wave in usable test volume, the input signal should be applied to ports 1 and 2 with a reversed phase, and a 50 ohms load resistance allows for termination at each other port, that is, 3 and 4. Because of the symmetry, ports 1 and 2 are interchangeable with ports 3 and 4, with no change in the generated TEM wave property.
Figure 3 shows setup of the four-port TEM cell for TEM mode verification. Field evaluation area is shown as the shaded square in Figure 3, which is 250 mm x 250 mm. Electric fields are measured at intervals of 10 mm both in the x- and y-directions using a field probe, which provides total 676 measurements. It means 676 measurements points are taken for the TEM mode verification.
VOL. 1, NO. 2, December 2014, pp. 127-132
129
Fig. 5. Statistical analysis for the four-port TEM cell.
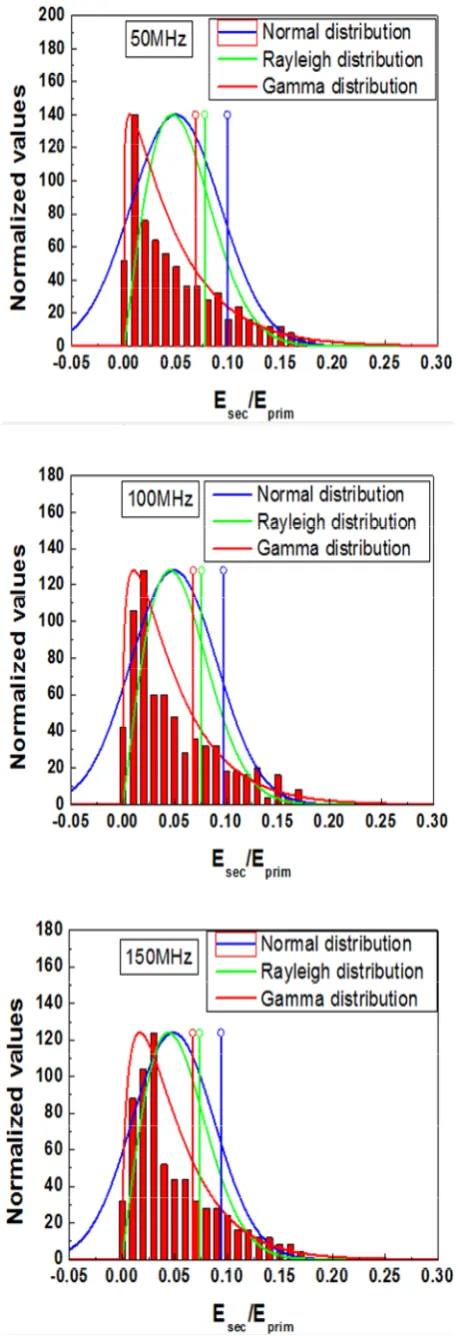
Table 1 shows the formulas of probability distribution function (pdf), cumulative distribution function (cdf) and quantile function for Normal, Rayleigh, and Gamma distribution.
We investigate field distribution at different frequencies using the CST Microwave Studio as shown in Figure 5 [15]. At test point i the measured primary field component is given as Eprim and the secondary field component as Esec.
130 parameter of variance. However, the gamma distribution is
calculated from two parameters which are α and β have to be calculated numerical. Also, the 75 % quantile is determined using Table 1.
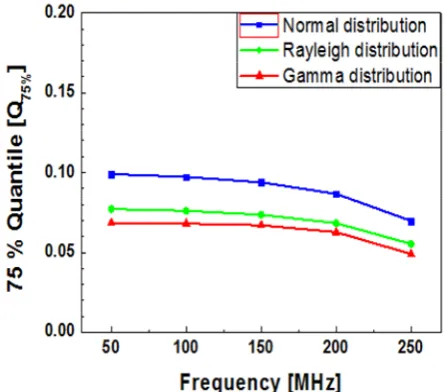
Fig. 6. 75 % quantile for the four-port TEM cell.
As shown in results, the pdf of Normal distribution does not correspond to measurement data. But the Gamma distribution represents the best result. However, its 75 % quantile cannot easily be estimated from a set of data. Because, the Gamma distribution two parameters have to be calculated numerical and its cdf function cannot be solved analytically. Therefore this is not practicable for a standard calibration procedure. However, the one parameter of the Rayleigh distribution can easily be estimated from the measurement data. Furthermore its 75 %
quantile can be calculated analytical from σ. The 75 %
quantile evaluated at five measured frequencies are also calculated in Figure 6.
III. CONCLUSION
We analyzed the verification of TEM mode with statistical approach in four-port TEM cell, which is, used the calibration of EM field probe. The verification of TEM mode with the statistical approach is investigated. We presented Normal, Rayleigh, Gamma statistical distributions of electromagnetic fields in a four-port TEM cell. As shown in this paper, the Rayleigh distribution is good agreement with the measurement data and the verification of the TEM mode shall be carried out with the 75 % quantile of the Rayleigh distribution.
Acknowledgement
This work was supported by the IT R&D program of MSIP/IITP (12-911-01-103, study on electromagnetic safety for major infrastructure including information communication technology).
REFERENCES
[1] N. A. Nahman, M. Kanda, E. B. Larsen, and M. L. Crawford, “Methodology for standard electromagnetic
field measurements.” IEEE Transactions on
Instrumentation and Measurement, vol. IM-34, no. 4,
pp. 490-503, Dec. 1985.
[2] M. Kanda, “Standard probes for electromagnetic field
measurements,” IEEE Transactions on Antennas and
Propagation, vol. 41, no. 10, pp. 1349-1364, Oct. 1993.
[3] J. H. Yun, H. J. Lee, and H. J. Hwang, “Straight coupled transmission-line cell for generating standard
electromagnetic fields” IEEE Trans. Electromagnetic
Compatibility, Vol. 44, no. 4, pp. 515-521, Nov. 2002.
[4] T. H. Hubing, “Performance-based EMC design using a maximum radiated emissions calculator,” Journal of Electromagnetic Engineering and Science, Vol. 13, no.
4, pp. 197-207, Dec. 2013.
[5] Testing and measurement techniques-Radiated, radio-frequency, electromagnetic field immunity test,
IEC61000-4-3, Apr. 2010.
[6] Testing and measurement techniques-Emission and immunity testing in transverse electromagnetic (TEM) waveguides, IEC61000-4-20, Aug. 2010.
[7] M. L. Crawford, “Generation of standard EM field
using TEM transmission cells,” IEEE Trans.
Electromagnetic Compatibility, Vol. 16, no. 9, pp.
189-195, Nov. 1974.
[8] M. T. Ma, E. B. Larsen, and M. L. Crawford, “Electromagnetic fields with arbitrary wave impedance generated inside a TEM cell,” IEEE Trans. Electromagnetic Compatibility, Vol. 33, no. 9, pp.
358-362, Nov. 1991.
[9] J. H. Yun, H. J. Lee, and J. K. Kim, “Generation of the standard EM fields with arbitrary wave impedance at
the center of a TEM cell,” IEICE Trans.
Communications, Vol. E81-B, no. 6, pp. 1286-1289,
Jun. 1998.
[10] J. H. Yun, J. S. Kim, W. S. Cho, and J. K. Kim, “Performance of coupled transmission line cell for generating standard EM fields,” Electronics Letters,
vol. 34, no. 12, pp. 1210-1211, Jun. 1998.
VOL. 1, NO. 2, December 2014, pp. 127-132
131
Radio Science, Vol. 45, no. 4, RS4002, Aug. 2010.
[12] S. B. Jeon, J. H. Yun, and S. K. Park, “On the new design of a 4-port TEM waveguide with a higher cutoff frequency and wider test volume,” ETRI Jour.,
Vol. 34, no. 4, pp. 621-624, Aug. 2012.
[13] S. B. Jeon, S. K. Park, and D. H. Kim, “Simple method to generate dominant E- and H-field inside a
four-port TEM cell,” IEEE Transactions on
Electromagnetic Compatibility, vol. 55, no. 5, pp.
979-982, Oct. 2013.
[14] S. B. Jeon, S. K. Park, J. H. Kwon, and D. H.
Kim, “Analysis of electromagnetic interference under different types of near-field environments,”
Electronics Letters, vol. 50, no. 9, pp. 652-654, Apr.
2014.
[15] CST Microwave Studio: Workflow & Solver Overview, CST studio Suite 2012, CST-GmbH, 2012.
Authors
Sangbong Jeon received his B.S., M.S., and Ph.D. degrees in Electronic Engineering from Yeungnam University in 2001, 2003, and 2007, respectively. From 2008 to 2010, he was a senior research engineer at the Korea Radio Promotion Association (RAPA), during which he conducted research in the field of
electromagnetic compatibility technology. Since 2010, he has been with the Electromagnetic environment research section, Electronics and Telecommunication Research Institute (ETRI). His work has been in the fields of electromagnetic compatibility for protecting radio service and standard field generation technology.