Rail Track Irregularity Detection Method Based
on Computer Vision and Gesture Analysis
https://doi.org/10.3991/ijoe.v12i12.6444
Jian Rong, Shiyang Song, Zhen Dang, Hongliang Shi
and Yong Cao
SouthWest Forestry University, Kunming, ChinaAbstract—In this paper, rail track irregularity detection system based on computer vision and SVD analysis is pro-posed and located in the train's operator cabin near the front. Images are captured by FLEA3 camera of Point-Grey, and vibration signals are collected by sensor device MPU6050 integrating 3-axis accelerometer and 3-axis gyro-scope. Root mean square of gray-scale threshold Pulse Cou-pled Neural Network (RMS-PCNN) is used for segmentation of the rail track's image in a single loop, and the improved coupled map lattice(CML) is used for filtering the image and signifying the rail track. After perspective, the track radius can be fetched by analysis of regression. Vibration signal filtered by SVD-unscented Kalman filter(UKF) can reflect the wagon movements. In unscented Kalman filter, Cholesky is replaced by SDV in UT(unscented transform), which can solve negative definite matrix caused by covari-ance matrix on account of calculation error and round-off error. Also numerical stability is improved under the guar-antee of filtering accuracy and the same complexity level of algorithm based on SVD-UKF. Looking up the radius rec-ord table, the corresponding threshold in gyroscope signal can be selected, and Compared to the super elevation, the invisible irregularity defects of rail bed will be found out.
Index Terms—computer vision, rail track irregularity, RMS-PCNN, SVD-UKF, gyroscope signal, super elevation.
I. INTRODUCTION
With the spread of high-speed trains and the increasing costs of road transport, railway research for technical improvements and cost reduction has increased notably during the last decade. One of the main focuses has been on the rail track irregularities. Rail track irregularities have a large effect on different aspects of railway opera-tion, mainly system safety, train speed optimizaopera-tion, movement behavior and passenger comfort especially focusing on non-loaded and loaded track. To ensure a good maintenance of the rails, measurements are needed frequently, which are costly and require specific tools for different aspects of the rails geometry, and many methods are proposed.
Consequently, railway infrastructure companies in-vest large amounts of money in rail track maintenance yearly. A key point in this activity is regular inspection of the rail status which can avoid performance problems or unsafe situations. The critical factors of this inspection are speed and accuracy of the rails geometry measurement system. Actual developments in rail track inspection methods have been reviewed. These methods are divided into contact and non-contact measurements. The major problems with contact techniques are that they produce rail wear and due to speed requirements, and they limit the operability of the train corridor. On the other hand, the
non-contact methods include accelerometer and gyroscope devices which are affected by the train vibrations and cannot assess the wear of the rail surface. Therefore opti-cal methods seem to have advantages and have been used for accurate measurements of the rails profile. Of course the importance of acquiring accurate geometry of the rails is not only limited to railway inspection, but also involves providing information for further research on deterioration modeling.
In order to obtain this data, railway companies often use manual inventories, hand devices or the aforementioned contact tools. The manual techniques are dependent of the operator criteria and experiences, and the required long interruptions of the track operation results in costly. Whereas for the contact tools, it requires different and specific machines for every parameter to be measured, increasing the maintenance costs. In contrast, mobile laser scanning seems to be suitable in order to gather all the required data at same time, independent of lighting limita-tions, and providing better measurement accuracy[1]. The problem is that a methodology to classify and model the rail track from laser data did not exist up to now.
Computer vision techniques have been applied to ex-tract some objects of the railway scene[2,3]. Some re-searches have focused on recognizing the bolts in the rails, and they face clear limitations to generate accurate meas-urements of rails and other objects.
Vertical dynamic model for the rail track and wagon in-teraction was researched and rail mode was proposed for predicting the dynamic responses of both the wagon and the rail track components[4]. Irregularities in wheel and/or rail generate sharp peak responses in the track–wagon system. Some irregularities cause periodic excitation whilst others cause non-periodic or localized excitation defined as impulse excitation in this paper. The periodic irregularities include the rail corrugations, the out-of-round wheels or the flat out-of-rounded wheels, and the non-periodic irregularities include the indentation on the rail-head due to the spall or the defect of welded-joint and the dipped-joint.
(par-ticularly over-voltages) in traction system is of considera-ble importance[7]. A two- dimensional finite/infinite ele-ment model with plane strain condition for railway track was analyzed, and the vertical displacement, velocity, and accelerations of track vibrations were examined by chang-ing the values of ballast layer stiffness. The results show that as the rail bed modulus or stiffness increases, the acceleration of track vertical vibration increases, but the vertical vibration velocity of track, the induced ground displacement, velocity, and acceleration decreases[8]. A MCDA method based on "multi-criteria analysis" with GIS support for optimizing the choice of the corridors/line of "high speed rail" (HRS)[9] safety system that will sole-ly depend on train-based sensors and communication devices that can coexist with CBTC/ PTC systems for broken rail detection is provided[10]. Temperature force and vehicle load can cause the continuous welded rail track to buckle the influence of the lateral and longitudinal ballast resistance, one of important factors to calculate the critical values of the track using special finite element program. Also, the sensitivity of the track irregularities such as the alignment defect and the gauge irregularity are investigated[11]. The practical monitoring of wheel de-fects for trains could be done through track mounted sen-sors and the measured data are processed by an advanced calculation program before being combined with the iden-tification tag of a locomotive or a coach. This technique is employed by existing condition-monitoring systems and determines precisely which part of the train is faulty/damaged and to what extent. Some of these wayside monitoring devices have encouraged the adoption of con-dition-based maintenance thereby saving the industry valuable time and costs. Sensors can also be mounted on the rolling stock in order to monitor the condition of the railway vehicle infrastructure. So modern rolling stock is fitted with high-capacity communication buses and multi-ple sensors, which will results in the potential for ad-vanced processing of collected data. This approach re-quires intelligent image acquisition and analysis systems which are capable of processing large amounts of data and various ongoing research projects are tackling this task. This paper is an attempt to collate and critically appraise the techniques used for condition monitoring of railway vehicle dynamics[12]. Quats are associated with high frequency vibrations of the wheel-rail system and can be registered using axle box acceleration (ABA) measure-ments. In this paper a three- dimensional finite-element (FE) model is proposed to capture the dynamic features of the ABA related to squats in the high frequency range. The FE model is validated relying on a set of real-life ABA measurements at two characteristic rail surface de-fects (light and severe squats), located in a section of the railway network in Assen, Netherlands. The FE model managed to properly capture the dynamic features in the range of frequencies up to 2,000Hz[13]. An integrated model called DARTS (Dynamic Analysis of Railway Track Structures) has been applied for evaluating car body accelerations, track deflections and wheel/rail forces which are acquired from the passage of a Thalys high-speed train, traveling on a conventional ballasted track or non- conventional embedded rail structure[14]. The dy-namic component of vertical wheel–rail contact forces, as generated by irregularities in track geometry (longitudinal level, isolated defects, insulated joints, rail corrugation, switches & crossings, etc) and track stiffness (transition zones, hanging sleepers, culverts, etc), is an important
source to ground-borne vibration and ground-borne noise[15]. Relatively short vertical drains would be suffi-cient to dissipate cyclically induced pore pressures, curtail the lateral movements, and increase the shear strength and bearing capacity of the sub-grade. In summary, this invit-ed Special Paper describes in detail the large-scale labora-tory tests imperative for material characterization, full-scale instrumented field trials for performance verifica-tion, elasto- plastic finite element analyses for predicting the behavior of tracks stabilized using shock mats, and photosynthetic products including grids and prefabricated drains[16].
II. STRUCTURE OF PROPOSED VISION SYSTEM FOR
DATA ACQUISITION
A. the structure of Data Acquisition system
The chapter will demonstrate some issues of design and modeling of a part of a modern vision system for a rail transport. This vision system is intended for capturing the rails and wagon gesture, and it consists of the micro- controllers, the developed software, the vision capturing system, sensor system and GPS is shown in Figure1. FLEA3 camera of Point-Grey is used for video capture connected with laptop by usb3.0 interface. Sensor box consists of accelerometer and gyroscope with 3-axis re-spectively named MPU6050 and CPU unit is S3-6410, also it is connected PC with COM port. The sensor box is shown Figure.2. All these system operate simultaneously.
Figure 1. The structure of Data Acquisition system
Figure 2. The structure of sensor box
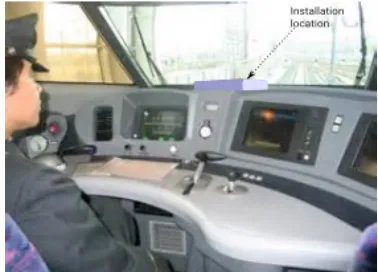
B. the installation location of Data Acquisition system
The proposed system is located in the train's operator cabin near the front. When the train is running, data acqui-sition start operating. The installation is shown in Figure3.
III. RAIL TRACK DETECTION AND RADIUS FETCH
A. Image Segmentation
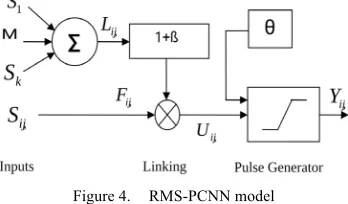
A simpled PCNN(pulsed coupled neural network) model called root mean square of gray-scale threshold pulse coupled neural network (RMS-PCNN) is applied for image segmentation[17]. The simplified PCNN model of neuron is shown in Figure4.
Figure 4. RMS-PCNN model
The simplified PCNN model of neuron (i,j) is shown in Figure4, where Fi,j is the feeding, Si,j is the input impulse
signal which is the gray scale level of pixel (i,j),
!
is the linking constant, and M is the connection matrix in feed-back input domain. Li,j is the linking which is the constantthreshold related to the gray scale statistics of the image. Yi,j is the pulse output, and Ui,j is the internal activity. The
feeding accepts the original image gray scale:
Fi,j=Si,j (1)
Each neuron is connected with the linking neurons. The linking output is based on the gray scale levels of the neurons in the linking field,as follows:
!
"=
G
k k k
j
i
M
S
L
, (2)where G is the linking matrix of neuron Ni,j which can
be 3!3 or 4!4 linking field. Figure.5 shows a 3!3 linking field.
Figure 5. the neuron of 3X3
The linking inputs are biased and then multiplied with the feeding input to form the internal activity U(i,j):
Ui,j=Fi,j(1+!*Li,j) (3)
The pulse generator of the neuron consists of a step function generator and a threshold signal generator. At each firing step, the neuron output Yi,j is set to 1 when the
internal activity Ui,j is greater than the threshold !,
other-wise the output is set to 0, as the following:
! "
# >
= $ =
others j Ui U
step
Yi j ij 0,
, , 1 ] [ , ,
%
% (4)
Regards root mean square of the gray scale level of each pixel as threshold !, which is based on the gray scale statistics of the image. Just as the following:
n
m
S
I ji i j
!
=
"
,# 2,
$
(5)where I is the m!n gray-scale-matrix of the image,and m and n are the number of the pixel of the rows and col-umns in the image respectively.
B. coupled map lattice
A coupled map lattice (CML) is a dynamical system that models the behavior of non-linear systems (especially partial differential equations)[18]. They are predominantly used to qualitatively study the chaotic dynamics of spatial-ly extended systems. Features of the CML are discrete time dynamics, discrete underlying spaces (lattices or networks), and real (number or vector), local, and contin-uous state variables. Studied systems include populations, chemical reactions, convection, fluid flow and biological networks. More recently, CMLs have been applied to computational networks identifying detrimental attack methods and cascading failures including image segmen-tation. A overall map is established with gray-level. Four pixels neighbored xi,j couple with xi,j shown in Eq6.
)] 1 , ( ) , 1 ( ) 1 , (
) , 1 ( [ 4 ) , ( ) 1 ( ) , (
1
+ +
+ +
!
+
!
+
!
= +
j i f j i f j
i f
j i f j
i f j
i X
n n
n
n n
n " " (6)
A CML generally incorporates a system of equations (coupled or uncoupled), a finite number of variables, a global or local coupling scheme and the corresponding coupling terms. The underlying lattice can exist in infinite dimensions. Mappings of interest in CMLs generally demonstrate chaotic behavior. Logistic map is used widely in coupled map lattice shown in Eq7.
)
1
(
1 n n
n
a
x
x
x
+=
"
"
!
(7) In Eq8, the next x is split as threshold 0.5.! " ! # $
<
% & &
' %
& &
= +
5 . 0 ), 1
(
5 . 0 ), 1
( 4
4
1
n n n
n n n
n
x x x
a
x x x
a
x (8)
Compared with coupled map lattice and directed binary, the rail-track is segmented obviously from rubble bed shown in Figure6.
Figure 6. The binary image after Figureure 7 Edge Detection RMS-PCNN and CML image after box filter
C. Rail track Detection
Bi-nary tree is searched for finding rail tracks as shown in Figure8.
According to the rail track's characteristic, the distance between the two rail tracks is invariable(omitted extended width in the curve), this can be a criterion for view morph-ing to determine transform matrix. Because the camera is fixed in the front of operate cabin, assumed it is paralleled to rail tracks at the nearest point. By perspective, figure can be obtained. then the radius can be fetched by analysis of regression as shown in Figure9.
Figure 8. Railtrack extracttion Figure 9. railtracks by by binary tree searching perspective and radius fetch
IV. UKF-SVD FOR GYROSCOPE DATA
A. UKF-SVD introduction
UKF(unscented Kalman Filter) is widely used for state estimation. But UKF often encounters the ill-conditioned problem when solving the square root of the co-variance matrix in practice. The improved UKF based on SVD(singular value decomposition) is proposed focus on sigma samples[20,21,22]. The standard UKF is as follows:
! " # + = + = k k k k k k v x h y x f x ) ( )
(
$
(9)where,
x
k!
R
is the states vector, andy
k!
R
are the input and output vectors at time instant k , respectively.k
v
and!
kare the process noise and measurement noise such that. kj k T j k kj k T k k k Q v v E R E E v Ej
!
!
"
"
"
= = = = ] [ , ] [ 0 ] [ , 0 ][ (10)
Here supposed that
!
k,
v
k,
x
kare not correlated to each other. Where!
i,j is Kronecker-!
function. UKF algorithm for the associated noisy nonlinear system is described as follows:1) Initialization
! ! ! ! " ! ! ! ! # $ + = = + % + + = + = % % = = ) ( 2 1 ) 1 ( ] ) )( [( ], [ 2 0 0 0 0 0 0 0 & ' ( & & & & n W W n W n W x x x x E P x E x m i c i c m T (11)
2) sigma points
UKF often encounters the non positive definite when solving the square root of the co-variance in practice. Therefore, unscented Kalman filter based on SVD over-come this problem for computing sigma points[20, 21].
! ! " !! # $ % % + & & % % + + = = & & & & & & & & & & & ] 1 , , ˆ [ 1 1 1 1 1 1 1 1 1 1 1 k k k k k k k T k k k k S U m Xk S U m X X V S U P ' '
( (12)
3) time update
! ! " !! # $ + % & % = = =
'
'
= % % % % % = % % % % m i k T k k k k i k k k k i c i k k mi ikk
m i k k k k k Q x x W P W x f 2
0 ,| 1 | 1 ,| 1 | 1
1 |
2
0 ,| 1
1 | 1 1 | ) ˆ ( ) ˆ ( ˆ ), (
(
(
(
(
(
(13)4) measure update
!
!
"
!!
#
$
+
%
&
%
=
=
=
'
'
= % % = % % % m i k T k k k i k k k i c i yy mi ikk m i k k k k k
R
y
y
y
y
W
P
y
W
y
h
y
20 , | 1 , | 1 2
0 ,| 1 1 | 1 |
)
ˆ
(
)
ˆ
(
),
(
(
(14)5) filter update
! ! ! " ! ! ! # $ % = % + = = % & % = % % % % = % %
'
T k yy k k k k k k k k k k yy xy k T k k k i mi ikk kk
c i xy K P K P P y y K x x P P K y y x W P 1 | 1 | 1 1 | , 2
0 ,| 1 | 1
) ˆ ( ˆ ˆ ) ˆ ( ) ˆ (( (15)
B. Data Processing
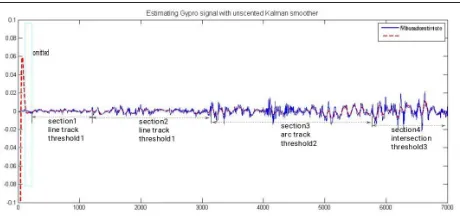
Data of gyroscope and accelerometer are collected by UART with fixed Bps. In fact, the transmit speed varies from 30 to 120 per second. For acquiring same sampling rate, data should be interpolated by linear interpolation method. Also the vibration signal may be noised during the running period. There is interception from the gyro-scope sensor of 12,000 data points, and the sampling fre-quency is 120Hz.
The measure points are selected as input for UKF-SVD, and the estimated points are treated as real gesture of wagon vibration. Each 7000 points are selected for each filtering by UKF based on SVD include 1000 points which are selected for overlap. The real wagon gesture is shown in Figure10 , and the error limit is in 10-3. From
the results of radius fetch the line track or arc track can be distinguished and radius of arc can be calculated. Looking up the radius record table, the corresponding threshold in gyroscope signal can be selected. In line track and arc track, when exceed the threshold as Eq.16. Eq.17 shows the super elevation related to speed and radius.
!
!
"
!
!
#
$
<
<
<
<
<
%
=
<
...
2
,
,
3
1
,
,
2
,
,1
3 2 2Arc
R
R
R
threshold
Arc
R
R
threshold
Line
R
threshold
(16)R
V
E
=
7
.
6
max2 (17)Figure 10. section example of signals based SVD-UKF
V. CONCLUSION
Vision system consists of vision capturing system, sen-sor system and GPS, is intended for capturing the rails and wagon gesture. RMS-PCNN is used for image binary in a single loop using root mean square as threshold, and the improved couple map lattice with asymmetric is used for filtering the image and signifying the rail track. By binary tree searching, the rail tracks can be founded out. After perspective, radius is fetched by regression.
The vibration signal is filtered by UKF-SVD can reflect the wagon gesture status, and Cholesky is replaced by SVD in UT(unscented transform), which can solve nega-tive definite matrix caused by co-variance matrix on ac-count of calculation error and round-off error. Compared to threshold and super elevation which are obtained from the standard for constructional quality acceptance of rail-way track engineering, the rail defects can be found while exceeding the maximum or less than minimum of super elevation.
ACKNOWLEDGMENT
Authors are thankful to NSFC of China(61261013) and graduate student’s project of Yunnnan Provincial Educa-tion Department for financial support.
REFERENCES
[1] Penatesanchez A, Morenonoguer F, Andradecetto J. LETHA: Learning from High Quality Inputs for 3D Pose Estimation in Low Quality Images[J]. , 2014: 517-524.
[2] Francescomaria Marino and Ettore Stella, Vision Systems: Appli-cations [B], 2007.
[3] Mazzeo, P. L., Nitti, M., Stella, E., Distante, A Visual Recognition of fastening Bolt in Railway Maintenance Context by using Wave-let Transform. International Journal on Graphics,Vision and Image Processing, v.SI1, pp. 25-32, 2005.
[4] Qsun Y, Dhanasekar M. A dynamic model for the vertical interac-tion of the rail track and wagon system[J]. Internainterac-tional Journal of Solids and Structures, 2002, 39(5): 1337-1359.
https://doi.org/10.1016/S0020-7683(01)00224-4
[5] Hu M, Cheng X, Miao L. Advanced Stochastic Modeling of Railway Track Irregularities[J]. Advances in Mechanical Engi-neering, 2013.
[6] Thendry M, Derekmartin C, Leebarbour S. Measurement of cyclic response of railway embankments and underlying soft peat foun-dations to heavy axle loads[J]., 2013.
[7] Ziemba R. Computer Simulation of Fast Transients in Railway Systems[J]. Przegl" d Elektrotechniczny, 2012: 60-62.
[8] Zakeri J, Esmaeili M, Mosayebi S. Effects of vibration in desert area caused by moving trains[J]., 2013, 20(1):16-23..
[9] De Luca M, Dellacqua G, Lamberti R. High-Speed Rail Track Design Using GIS And Multi-Criteria Analysis[J]., 2012, 54(0). [10] Wirtu;Bayissa L;Dhanasekar M, High speed detection of broken
rails, rail cracks and surface faults. SPQRK[Web],2012.
[11] Samavedam G, Kish A, Jeong D. PARAMETRIC STUDIES ON LATERAL STABILITY OF WELDED RAIL TRACK[J]., 1983. [12] Wngigi R, Pislaru C, Ball A. Modern techniques for condition
monitoring of railway vehicle dynamics[J]. Journal of Physics: Conference Series, 2012, 364(1).
[13] Molodova M, Li Z, Nunez A. Validation of a finite element model for axle box acceleration at squats in the high frequency range[J]. Computers & Structures, 2014: 84-93. https://doi.org/10.1016/j.co mpstruc.2014.05.005
[14] Esveld C, Kok A. INTERACTION BETWEEN MOVING VEHICLES AND RAILWAY TRACK AT HIGH SPEEDS[J]., 1998, 27(3).
[15] Lombaert G, Degrande G, Francois S. Ground-Borne Vibration due to Railway Traffic: A Review of Excitation Mechanisms, Pre-diction Methods and Mitigation Measures[J]., 2015.
[16] Indraratna B, Nimbalkar S, Rujikiatkamjorn C. Track stabilisation with geosynthetics and geodrains, and performance verification through field monitoring and numerical modelling[J]., 2012. [17] Luping Ji , Zhang Yi, Lifeng Shang,An improved pulse coupled
neural network for image processing,Neural Computing and Ap-plications. June 2008, Volume 17, Issue 3, pp 255-263.
https://doi.org/10.1007/s00521-007-0119-5
[18] Harris M, Coombe G, Scheuermann T. Physically-based visual simulation on graphics hardware[J]. International Conference on Computer Graphics and Interactive Techniques, 2005.
https://doi.org/10.1145/1198555.1198791
[19] Marino F, Distante A, Luigimazzeo P. A Real-Time Visual In-spection System for Railway Maintenance: Automatic Hexagonal-Headed Bolts Detection[J]. IEEE Transactions on Systems, Man, and Cybernetics, 2007, 37(3): 418-428. https://doi.org/10.1109/ TSMCC.2007.893278
[20] Zhang X, Hu W, Zhao Z. SVD based Kalman particle filter for robust visual tracking[J]. International Conference on Pattern Recognition, 2008. https://doi.org/10.1109/icpr.2008.4761153
[21] Ma Y, Wang Z, Zhao X. A UKF algorithm based on the singular value decomposition of state covariance[J]., 2010.
[22] Nguyen V, Pyun J. Location Detection and Tracking of Moving Targets by a 2D IR-UWB Radar System[J]. Sensors, 2015, 15(3): 6740-6762. https://doi.org/10.3390/s150306740
AUTHORS
Jian Rong is with the school of Computer & Infor-mation Sciences, SouthWest Forestry University, Kun-ming, China, (e-mail:[email protected]). Associate Professor, Major in Rail Communication Safety engineer-ing.
Shiyang Song was with the School of Machinery & Transportation, Southwest Forestry University, Kunming , China. Master degree candidate.
Zhen Dang is with the School of Computer & Infor-mation Sciences, SouthWest Forestry University, Kun-ming, China. Master degree candidate.
Hongliang Shi was with the School of Machinery & Transportation, Southwest Forestry University, Kunming, China. Master degree candidate.
Yong Cao is with the School of Computer & Infor-mation Sciences, SouthWest Forestry University, Kun-ming, China, (e-mail: [email protected]).