RESEARCH
Early-life DNA methylation profiles are
indicative of age-related transcriptome changes
Niran Hadad
1,2,7, Dustin R. Masser
2,3, Laura Blanco‑Berdugo
4, David R. Stanford
2,3,5and Willard M. Freeman
1,2,3,5,6*Abstract
Background: Alterations to cellular and molecular programs with brain aging result in cognitive impairment and susceptibility to neurodegenerative disease. Changes in DNA methylation patterns, an epigenetic modification required for various CNS functions are observed with brain aging and can be prevented by anti‑aging interventions, but the relationship of altered methylation to gene expression is poorly understood.
Results: Paired analysis of the hippocampal methylome and transcriptome with aging of male and female mice demonstrates that age‑related differences in methylation and gene expression are anti‑correlated within gene bod‑ ies and enhancers. Altered promoter methylation with aging was found to be generally un‑related to altered gene expression. A more striking relationship was found between methylation levels at young age and differential gene expression with aging. Highly methylated gene bodies and promoters in early life were associated with age‑related increases in gene expression even in the absence of significant methylation changes with aging. As well, low levels of methylation in early life were correlated to decreased expression with aging. This relationship was also observed in genes altered in two mouse Alzheimer’s models.
Conclusion: DNA methylation patterns established in youth, in combination with other epigenetic marks, were able to accurately predict changes in transcript trajectories with aging. These findings are consistent with the develop‑ mental origins of disease hypothesis and indicate that epigenetic variability in early life may explain differences in aging trajectories and age‑related disease.
Keywords: DNA methylation, Aging, Epigenetics, Gene regulation, Hippocampus
© The Author(s) 2019. This article is distributed under the terms of the Creative Commons Attribution 4.0 International License (http://creat iveco mmons .org/licen ses/by/4.0/), which permits unrestricted use, distribution, and reproduction in any medium, provided you give appropriate credit to the original author(s) and the source, provide a link to the Creative Commons license, and indicate if changes were made. The Creative Commons Public Domain Dedication waiver (http://creativecommons.org/ publicdomain/zero/1.0/) applies to the data made available in this article, unless otherwise stated.
Introduction
Epigenetic modifications, chromatin, and direct DNA modifications are key genomic regulatory processes required for proper development [1], gene imprinting [2–4], X chromosome inactivation [5–7], gene expression regulation [8], and genomic organization [9–11]. Disrup-tions to the epigenome can alter basic cellular regula-tion leading to a wide range of dysfuncregula-tional molecular programs [10–12]. Dysregulated epigenetic control with aging has been proposed as an etiological factor com-mon to age-related diseases ranging from diabetes to
neurodegenerative diseases such as Alzheimer’s disease [13–18]. DNA methylation has been widely studied in geroscience research as methylation at specific loci is indicative of chronological age [19–22] and can poten-tially be an indicator of ‘biological’ aging [23, 24]. DNA methylation primarily occurs in a CpG context; however, non-CpG methylation is abundant in the central nervous system (CNS) [1, 25] and has only been minimally exam-ined with aging [26, 27]. With the growing understanding that DNA methylation is dynamic, the role of alterations in DNA methylation patterns in regulating gene expres-sion changes during development, aging, and disease is of particular interest.
DNA methylation changes with aging demonstrate both tissue specificity and conservation across tissues depending on the specific genomic location [28–30].
Open Access
*Correspondence: [email protected]
2 Reynolds Oklahoma Center on Aging, SLY‑BRC 1370, 975 NE 10th St,
Oklahoma City, OK 73104, USA
Conserved changes with aging across tissues in the form of epigenetic clocks have proved to be a powerful tool for estimating chronological age and are predictive of all-cause mortality [24, 31, 32]. Tissue-specific DNA methylation changes with aging on the other hand may underlie organ/cell-specific deficits. For example, in the liver, gene body hypermethylation occurs primarily in genes involved in lipid metabolism [33], while in the brain age-related methylation changes occur in genes involved in synaptic transmission and cellular integrity [26]. It is important to note that changes in methylation also occur in pathways implicated to be dysregulated with aging systemically, such as the insulin-signaling pathway and cellular senescence [34–37]. Recent studies show that age-related DNA methylation changes in blood [38, 39], kidney [40], liver [33, 37], and the hippocampus [26], can be partially prevented by dietary, genetic, and pharmacological pro-longevity interventions providing further support for the association between DNA meth-ylation and aging.
In the CNS, DNA methylation plays an important role in cellular differentiation [41–43], synaptic formation and function [44, 45], and in molecular mechanisms underly-ing learnunderly-ing and memory formation [46]. These processes are known to be impaired with aging [47]; however, whether age-related methylation differences contribute to the decline of these processes is unknown. Global lev-els of DNA methylation have been proposed to decrease with aging [48], but this has not been observed in brain samples using modern sequencing techniques [49, 50]. Rather specific loci in the genome undergo hypermethyl-ation and hypomethylhypermethyl-ation with aging [27]. In addition to differences in methylation, with aging there is increased variability in CpG methylation [51]. Similar findings are observed in Alzheimer’s disease (AD) patients, specifi-cally in genes directly linked to AD [17]. Thus, epigenetic mechanisms may contribute to age-related impairments and disease through altering gene expression, but lit-tle is known about the effects of age-related changes in methylation on gene expression regulation in the brain. Understanding the role age-related differential methyla-tion plays in brain aging may allow for identificamethyla-tion of regulatory processes contributing to the development of neuropathologies.
In previous studies we have characterized changes in methylation and transcription with aging in the hip-pocampus of male and female mice, finding a core of sex common changes with the majority of age-related changes being sexually divergent [27, 52]. Here we sought to understand the effect of age-related differential meth-ylation on gene expression using paired DNA methyla-tion, by whole-genome bisulfite sequencing (WGBS), and transcriptome, by RNA-sequencing, data from the same
samples. We find that differential methylation in gene body and enhancer elements inversely correlates with aging gene expression. This relationship is generally weak and accounts for a small fraction of the differentially expressed genes with aging. A stronger correlation was observed between age-related differential gene expres-sion and early-life promoter and gene body methyla-tion patterns, an associamethyla-tion that was independent of age-related differential methylation. Furthermore, DNA methylation levels were able to predict whether tran-scriptional changes with age will undergo up- or down-regulation with aging. The predictive ability increased when combined with other epigenetic marks. The broad implication of our findings is that early programming of the epigenome during development and/or early adult-hood may impact transcriptional trajectories late in life. Understanding epigenetic differences that occur dur-ing development may help explain late-life molecular responses in the CNS and possibly differences in suscep-tibility to adverse conditions between individuals.
Results
Characterization of differential methylation in the hippocampus using whole‑genome bisulfite sequencing
To assess the relationship between hippocampal age-related differential methylation and age-age-related transcrip-tional changes we first analyzed differential methylation with aging using WGBS in both male and female mice. Previous studies characterizing differential methylation in the hippocampus with aging focused on just global levels of methylation or used approaches that allowed for high-resolution analysis of portions (~ 10%) of the genome [27, 49]. Whole-genome bisulfite sequencing provides the most comprehensive analysis of gene meth-ylation by covering the majority of CpG sites across the genome. Sequencing methods that examine smaller por-tions of the genomic CpG sites provide a limited and incomplete view of genic methylation (Additional file 1: Figure S1).
The average methylation level across all CpGs in young (3 months) and old (24 months) animals demonstrate no differences with aging (FY 74% ± 0.2, FO 73.5% ± 0.4, MY 74.1% ± 0.5, MO 72.5% ± 1.4, Additional file 2: Figure S2). Similarly, no difference in transposable element CpG methylation with age was evident. No differences in aver-age methylation levels between males and females were observed. These agree with previous findings that there is no hypomethylation with aging in the murine hippocam-pus [49, 50].
per CpG were retained yielding 979,603 regions ana-lyzed for differential methylation with aging. Both males and females had roughly similar numbers of age-related differentially methylated regions (age-DMRs: 7702 in females vs 7029 in males) and showed a slight bias towards hypomethylation (Fig. 1a–d). Only 2% of all age-DMRs were common to both males and females (Fig. 1b). Of these sex-common changes, 68% were com-monly regulated, e.g., hypermethylated in both males and females (χ2 test of independence p value = 1.3 × 10⁻⁶).
These results demonstrate that genome-wide, age-related changes in DNA methylation are predominately sex-spe-cific, in agreement with prior findings [27].
Functional enrichment of genes containing age-DMRs revealed that although age-DMRs in males and females occurred in different genomic locations, genes contain-ing age-related differential methylation are enriched in pathways with functional similarities, for example, genes containing age-DMRs in females are enriched in inosi-tol phosphate metabolism, while genes containing age-DMRs in males are enriched in phospholipid metabolism and phosphoinositol metabolism (Fig. 1e, f, Additional file 3: Table S1, Additional file 4: Table S2). Gener-ally, pathways common to both males and females are involved in glucose and lipid metabolism, neuronal inter-actions, and cellular integrity. These results suggest that while sex-divergence occurs at the level of the genome, the pathways affected by aging may still be functionally similar.
Age-DMRs were assessed for their enrichment across genomic features and gene regulatory elements. Over-representation of age-DMRs was observed in CpG islands and shelves, and within gene bodies (Fig. 1g, h). Gener-ally, DMRs were not enriched in promoter regions, but when separated according whether the promoter con-tained a CpG island, significant enrichment of age-DMRs is observed in promoters without a CpG island. This is consistent with previous studies indicating that methyla-tion of promoter CpG islands generally does not change with aging [53, 54]. Age-DMRs were over-represented in active and poised distal gene regulatory regions, namely active enhancers and promoter flanks. This was also evident by enrichment of age-DMRs in hippocampal H3K27ac and H3K4me1 peaks, both indicators of active and poised enhancers [55, 56] (Fig. 1e). Hypomethylated age-DMRs were also over-represented in H3K36me3, a marker of exons and transcriptional elongation [57, 58] shown to be altered with aging and associated with lon-gevity [59, 60], and in H3K27me3, a marker associated with gene repression (Fig. 1g, h). Overall, enrichment of age-DMRs in genomic regions suggest that methylation of certain genomic regions is more susceptible to change with age as compared with others.
Association between differential gene expression and differential methylation with aging
DNA methylation functions to modulate genomic archi-tecture and regulate gene expression. However, the rela-tionship of differential methylation to altered steady state gene expression with aging has not been comprehen-sively addressed. We used RNA-sequencing to analyze transcriptional differences with aging in the same sam-ples used for methylation analysis and correlated age-DMRs with age-related differentially expressed genes (age-DEGs) in the hippocampus. With aging 781 genes were differentially expressed with aging in males and 433 in females (multiple linear regressions, fdr < 0.05 and |FC| > 1.25) (Fig. 2a, b). Approximately 1/3 of the genes upregulated with aging were common between males and females (Fig. 2b), and only 22 downregulated genes were common between the sexes (χ2 test of independence
p value < 2.2 × 10⁻¹⁶). This is consistent with previous
findings reporting sexual divergence in transcriptional profiles in addition to a common core set of genes with aging [52].
In both males and females, only a small number of age-DEGs contained an age-DMR in their pro-moter region (± 1 kb of the TSS). The association
Female
DMRs DMRsMale
3244
4458 32523777
281 51 140 90 0.06 LGI−ADAM interactions
Cell death signalling via NRAGE, NRIF and NADE p75 NTR receptor−mediated signalling Signaling by Rho GTPases Neuronal System Synthesis of IP3 and IP4 in the cytosol NRAGE signals death through JNK Death Receptor Signalling Inositol phosphate metabolism Rho GTPase cycle
0 2 4 6
8 0.02 0.04 0.06
Gene Ratio -Log10(FDR)
Negative regulation of the PI3K/AKT network RET signaling MET promotes cell motility Protein−protein interactions at synapses Neuronal System PI Metabolism Rho GTPase cycle Phospholipid metabolism Axon guidance Signaling by Receptor Tyrosine Kinases
0 2
4 0.02 0.04 FY FO MY MO
Fe
male DMRs
Male DMRs
Common DMRs
Male Female a d e f g −1 0 1 Male Hypo−DMR s −1 0 1 Male Hyper−DMR s Po lII H3K9me 3 H3K4me 3 H3K4me 1 H3K36me3 H3K27me3 H3K27ac DNase1 Repressed_TFBindingSit e Repressed_PromoterFlan k Repressed_Promoter Repressed_OpenChro m Repressed_Enhancer Repressed_CTCFBindingSit e Po ised_TFBindingSit e Po ised_PromoterFlan k Poised_Promoter Po ised_OpenChrom Po ised_Enhancer Poised_CTCFBindingSit e Inacti ve_TFBindingSit e Inacti ve _PromoterFlank Inacti ve _Promote r Inacti ve_OpenChro m Inacti ve _Enhancer Inacti ve _CTCFBindingSit e Acti ve_TFBindingSit e Acti ve _PromoterFlank Acti ve _Promote r Acti ve_OpenChro m Acti ve _Enhancer Acti ve_CTCFBindingSit e Promoters−nonCG I Promoters−CGI Promoters Introns Exon s CGIShore CGIShelf CG I
Genic Regulatory Regions Epigenetic
Lo g( Odds Ra tio) Po lII H3K9me 3 H3K4me 3 H3K4me 1 H3K36me3 H3K27me3 H3K27ac DNase1 Repressed_TFBindingSit e Repressed_PromoterFlan k Repressed_Promoter Repressed_OpenChro m Repressed_Enhancer Repressed_CTCFBindingSit e Po ised_TFBindingSit e Poised_PromoterFlan k Poised_Promoter Poised_OpenChrom Po ised_Enhancer Poised_CTCFBindingSit e Inacti ve_TFBindingSit e Inacti ve _PromoterFlank Inacti ve _Promote r Inacti ve _OpenChrom Inacti ve _Enhancer Inacti ve _CTCFBindingSit e Acti ve _TFBindingSit e Acti ve_PromoterFlan k Acti ve _Promote r Acti ve _OpenChrom Acti ve _Enhancer Acti ve_CTCFBindingSit e Promoters−nonCG I Promoters−CGI Promoters Introns Exon s CGIShore CGIShelf CG I −1 0 1 Fe male Hypo−DMRs −1 0 1 Fe male Hyper−DMRs
Genic Regulatory Regions Epigenetic
NonSig Sig Lo g( Odds Ra tio) h −0.2 0.0 0.2
0.0 0.1 0.2 0.3 0.4 0.5 0.6 0.7 0.8 0.9 1.0 Young Methylation
Meth
ylation Diff
erence (Y − O)
Hyper Hypo
−0.2 0.0 0.2
0.0 0.1 0.2 0.3 0.4 0.5 0.6 0.7 0.8 0.9 1.0 Young Methylation
Me
thy
lation Diff
erence (Y − O)
Hyper Hypo
b
c
Female
Male
Fig. 1 Whole‑genome analysis of age‑related differential methylation in males and females. a Heatmap of age‑related differentially methylated
regions, age‑DMR (Fisher Exact Test with FDR < 0.05, n= 3/group) across all groups. Dot plot showing changes in methylation with aging relative to
baseline methylation in young animals in males (b) and females (c). d Overlap between age‑DMRs in males and in females and the directionality of
methylation changes of common age‑DMRs. Pathway enrichment of genes containing age‑DMR within their gene body in females (e) and in males
(f). Significant enrichment was determined by hypergeometric test (p < 0.05). g, h Over‑ and under‑representation of age‑DMRs in genic regions,
CpG islands, and regulatory elements in the brain divided by their activation state, and regulatory elements annotated by specific histone marks in
with aging and gene repression of genes involved in lipid metabolism and growth hormone signaling [33]. Additionally, DNA methylation changes poorly cor-respond with transcriptional changes in the CNS dur-ing neuronal maturation [41] or following induction of
methylation in culture [61]. Therefore, while the canon-ical regulation of gene transcription by DNA methyla-tion is likely to explain a pormethyla-tion of the age-associated differential gene expression, age-related differential methylation may potentially serve a more complex role
FO v FY MO v MY
DEG Non Sig
Upregulated
Downregulated
378 135
22 321 122 221 MO v MY
FO v FY
FO v FY MO v MY
−2 −1 0 1 2
−20 0.0 20
% Methylation Difference
mRNA(Log2(FoldChange))
FO\FY
−2 −1 0 1 2
−30 −20 −10 0.0 10 20 30
% Methylation Difference
−2 −1 0 1 2
−20 0.0 20
% Methylation Difference
−2 −1 0 1 2
−20 0.0 20
% Methylation Difference
mRNA (Log2(FoldChange))
MO\MY
−2 −1 0 1 2
−20 −10 0.0 10 20
% Methylation Difference
−2 −1 0 1 2 3
−30 −20 −10 0.0 10 20 30
% Methylation Difference
Gene Body
Promoter Enhancer (H3K27ac)
Correlation non-sig Genes - -0.015 (0.68)
Correlation Sig Genes - -0.395 (0.116) Correlation non-sig Genes - -0.051 (<0.001)Correlation Sig Genes - -0.25 (0.01)
Correlation non-sig Genes - -0.054 (<0.01) Correlation Sig Genes - -0.255 (0.04)
Correlation non-sig Genes - -0.003 (0.93)
Correlation Sig Genes - 0.02 (0.891) Correlation non-sig Genes - -0.031 (0.035)Correlation Sig Genes - -0.13 (0.039) Correlation non-sig Genes - -0.071 (<0.0001)Correlation Sig Genes - -0.21 (0.018)
a b
c d e
f g h
Log2(FoldChange)
Log2(Mean Normalized Counts)
0 3 6 9 12
Log2(Mean Normalized Counts)
−2 −1 0 1 2
Log2(FoldChange)
DEG Non Sig
−2 −1 0 1 2
0 3 6 9 12
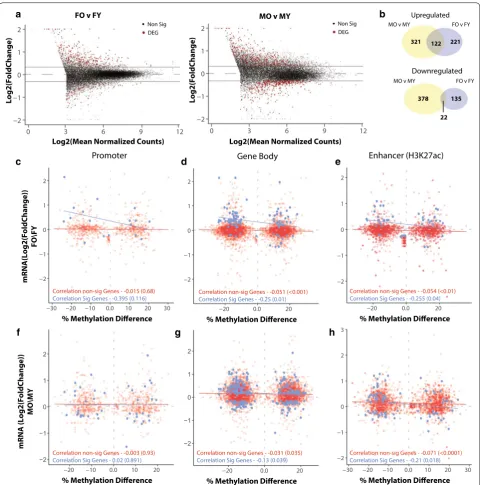
Fig. 2 Differential methylation with aging is anti‑correlated with expression changes in gene body and enhancer regions. a Volcano plots of
mRNA differential expression with aging (multiple linear regression, FDR < 0.05, |FC| > 1.25, n= 6/group) in males and females. b Venn diagrams
of the overlap of upregulated and downregulated differentially expressed genes between males and females. Correlation between age‑DMRs
mapped to promoters (c, f), gene body (D,G) or enhancer regions (e, h) and gene expression fold change (O/Y) in statistically significant (blue) and
in transcriptional regulation than simply induction and suppression of steady-state gene expression.
Age‑related gene expression changes are associated with methylation profiles in early life
DNA methylation can play multiple roles in regulat-ing gene transcription by alterregulat-ing protein bindregulat-ing occu-pancy [62], regulation of alternative splicing [63–67], and through interactions with histone marks [11, 68]. To examine relationships between DNA methylation patterns and gene expression with aging and gene body methylation levels (mean methylation from TSS to TES) (Fig. 3a, b) in early and late life were examined. Intrigu-ingly, genes differentially expressed with aging show a moderate positive association between age-related dif-ferential mRNA expression and gene body methylation levels at both young and old age (Fig. 3a, b). Genes whose
expression does not change with aging do not show a consistent positive association as observed for differen-tially expressed genes. That is, genes that were down-regulated with aging have lower gene body methylation levels in early life, and remained lower to old age as com-pared to genes that were upregulated with aging (Fig. 3c, d). This relationship was consistent in both young and old animals and was not influenced by age-related changes in CpG methylation (Fig. 3c, d). This analysis was repeated for CH methylation to examine whether the relation-ship between early-life methylation and gene expression persists for non-CpGs. Unlike CpGs, CH methylation was comparable between upregulated genes and down-regulated genes (Additional file 6: Figure S4A, B). The lack of interaction between CH methylation and changes in transcription may stem from the differences in func-tions between CpG and CH methylation in transcription
MY MO
FY FO
0.0 0.2 0.4 0.6 0.8 1.0
Down regulate
d N.S Up
regulate d
0.0 0.2 0.4 0.6 0.8 1.0
Down regulate
d N.S Up
regulated
Gene Meth
ylation Ratio
mCG/total co
verage
−0.5 0.0 0.5 1.0
0.00 0.25 0.50 0.75 1.00
mRNA Log2(FoldChange)
MO\MY
Y O N.S. Genes
WG Methylation mCG/CG
−0.5 0.0 0.5 1.0
0.00 0.25 0.50 0.75 1.00
mRNA Log2(FoldChange
)
FO\FY
WG Methylation mCG/CG
Y O N.S. Genes
Gene Meth
ylation Ratio
mCG/total co
verage
Downregulated
Upregulate
d
Upregulated
Downregulated
Upregulated mRNAs Downregulated mRNAs
* * *
* * *
a c
b d
e
f
Correlation non-sig Genes - 0.15 * Correlation Sig Genes - 0.43 *
Correlation non-sig Genes - -0.05 * Correlation Sig Genes - 0.19 *
-5000 star 10000 -5000 10000
t
end star
t
end
5mCG (%)
mRNA (Log2(RPKM+1))
-5000 star 10000 -5000 10000
t
en
d
star
t
en
d
mRNA
Lo
g2(RPKM+1)
Male Young Male Old
Female Young Female Old
100
0
4
1 Upregulated mRNAs Downregulated mRNAs
5mCG (%)
mRNA (Log2(RPKM+1))
100
0
4
1
mRNA
Lo
g2(RPKM+1
)
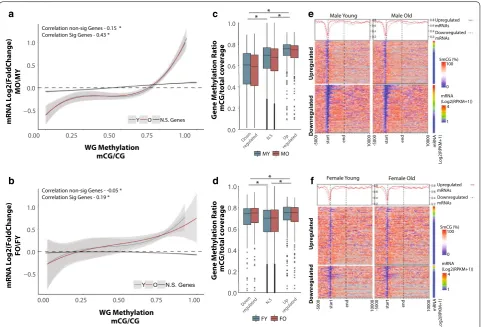
Fig. 3 Age‑related differentially expressed genes are positively associated with gene body methylation. Genes downregulated with aging have
lower gene body methylation at young age (Y, blue regression line) in both males (a) and females (b) compared to genes upregulated with aging.
This relationship is maintained in old age (O, red regression line). Curve corresponds to polynomial regression curve across significant (red and blue) and non‑significant (N.S., black) differentially expressed genes, 95% confidence intervals are shaded by the grey area. Gene body methylation was calculated as methylation of all cytosines between the transcription start site and transcription end site of a given gene. Box plot of whole
gene methylation grouped by genes upregulated, non‑differentially expressed, and downregulated genes in males (c) and females (d) *p < 0.001
(Kruskal–Wallis Test). Heatmaps illustrating the per‑gene gene body methylation patterns of genes upregulated and downregulated with aging in
regulation. Although transcriptional changes with aging are predominately sex-specific, this association was evi-dent in both males and females (Fig. 3), with males show-ing a stronger association as compared to females.
Qualitative assessment of the DNA methylation landscape of up- and downregulated genes with aging revealed that the main difference between up- and down-regulated genes occurs primarily around the transcription start site (Fig. 3e, f). Therefore, we repeated the analysis focusing on promoter methylation defined as ± 1 kb of the TSS. The positive association between differentially expressed genes and baseline DNA methylation was recapitulated when examining only the promoter region
(Fig. 4a, b), and was comparable in both sexes (Fig. 4c– f, Additional file 6: Figure S4C, D). Genes that do not change in expression with aging showed a weaker associ-ation that was not consistent between males and females (Fig. 4a, b). The correlation between promoter methyla-tion levels and gene expression changes was greater com-pared to observed with gene body methylation and was independent of apparent age changes in methylation. Our observation reveals a relationship between age-related gene expression changes and DNA methylation that depends on the methylation patterns established early in life rather than differential methylation with aging. To determine whether the positive association between
Downregulate
d
Upregulated
Upregulate
d
Downregulate
d
Female Young Female Old Male Young Male Old
0.0 0.2 0.4 0.6 0.8 1.0
Gene Meth
ylation Rati
o
mCG/total co
verage
TSS Methylation mCG/CG
Down regulate
d N.S Up
regulate d
FY FO
Down regulate
d N.S Up
regulated
MY MO
0.0 0.2 0.4 0.6 0.8 1.0
Gene Meth
ylation Ratio
mCG/total co
verag
e
0.00 0.25 0.50 0.75
0.00 0.25 0.50 0.75 1.00
0.0 0.4 0.8
0.00 0.25 0.50 0.75 1.00
TSS Methylation mCG/CG
Y O N.S. Genes
Y O N.S. Genes
Log2(FoldChange)
MO\MY
Log2(FoldChange
)
FO\F
Y
* * *
* * *
a c e
b d f
Correlation non-sig Genes - -0.15 * Correlation Sig Genes - 0.43 * Correlation non-sig Genes - 0.23 * Correlation Sig Genes - 0.48 *
-2000 200 -2000
0
2000
star
t
star
t
star
t
star
t
-200
0
2000 -200 2000
0
Upregulated mRNAs Downregulated mRNAs
5mCG (%)
mRNA (Log2(RPKM+1))
100
0
4
1
mRNA
Log2(RPKM+1)
Upregulated mRNAs Downregulated mRNAs
5mCG (%)
mRNA (Log2(RPKM+1))
100
0
4
1
mRNA
Lo
g2(RPKM+1)
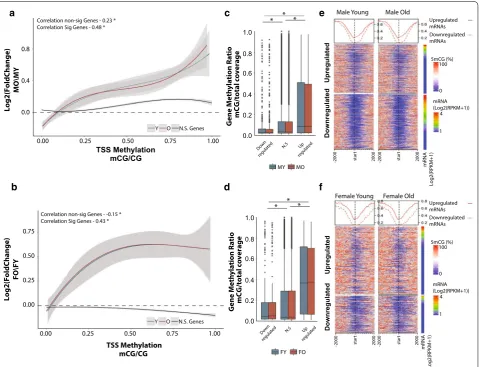
Fig. 4 Age‑related differentially expressed genes are positively associated with promoter methylation. Genes downregulated with aging have
lower promoter methylation at young age (Y, blue) in both males (a) and females (b) compared to genes upregulated with aging. This relationship
is maintained with aging (O, red). Curve corresponds to polynomial regression curve across significant (red and blue) and non‑significant (N.S.,
black) differentially expressed genes, 95% confidence intervals are shaded by the grey area. Promoter is defined as ± 1 kb from transcription start
site. Box plots of promoter methylation grouped by genes upregulated, non‑differentially expressed, and downregulated genes in males (c) and
females (d) *p < 0.001 (Kruskal–Wallis Test). Heatmaps illustrating promoter methylation patterns of genes upregulated and downregulated with
DNA methylation patterns and transcriptional changes with aging is observed in other tissues, we performed our analysis using paired WGBS and RNA-sequencing in the liver [33] (data obtained from GEO:GSE92486). A positive relationship between fold change and gene body methylation was observed with the liver data similar to that observed in the hippocampus (Additional file 7: Fig-ure S5). The lack of whole-genome bisulfite sequencing data with aging in other tissues prevents further exten-sion and validation of relationship at this time.
Association of methylation patterns with transcriptional changes with aging is not random
Differentially expressed genes with aging appear to have a different DNA methylation profile compared to genes that are stably expressed across the lifespan (Figs. 3, 4). To determine whether this observation is unique to genes that are differentially regulated with aging, we used a random sampling approach to correlate gene body DNA
methylation values with their corresponding mRNA fold change with aging. Randomly sampled sets of 500 genes (n= 10,000) showed weak correlation (r < 0.1) similar to that of genes not differentially expressed with aging and much less compared to that observed for genes differen-tially expressed with aging (r > 0.4) (Fig. 5a).
Next we asked whether genes sets that belong to the same pathway present a similar positive associa-tion. Pathways were extracted from the Reactome path-way database [69], and used as gene sets for correlation between methylation levels at young age and mRNA fold change with aging. After filtering pathways contain-ing < 50 genes, 368 pathways remained for the analysis (Fig. 5b). Out of all the pathways analyzed, 35 pathways showed a correlation coefficient that met or exceeded the correlation coefficient of r > 0.4 (Fig. 5c) observed between promoter methylation and genes differentially expressed with aging. For gene body methylation 32 pathways met or exceeded the correlation coefficient
0 2 4 6 8
−0.2 0.0 0.2 0.4
Correlation Coefficient
Density
0 1 2 3
−0.5 0.0 0.5
Female Male
Correlation Coefficient
Density
0.0 0.5 1.0 1.5 2.0 2.5
−0.5 0.0 0.5 1.0
Correlation Coefficient
Density
Female Male
−0.50 −0.25 0.00 0.25 0.50 0.75
0 0.25 0.50 0.75 1.00
Gene Methylation Ratio mCG/total coverage
Log2(FoldChange)
O\Y
−0.50 −0.25 0.00 0.25 0.50 0.75
0 0.25 0.50 0.75 1.00 Gene Methylation Ratio mCG/total coverage
Log2(FoldChange)
O\Y
a b
c d
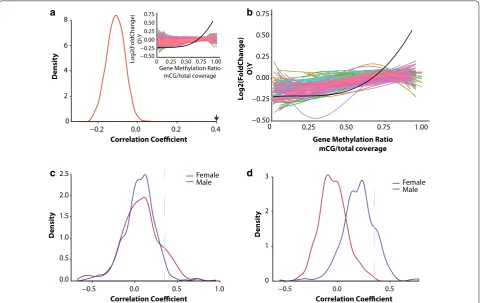
Fig. 5 The association between differential expression and DNA methylation patterns in young animals is not random. a Distribution of the
correlation coefficients generated by correlating log2 fold mRNA change with gene body methylation of 500 randomly sampled genes (N= 10,000).
Arrow indicates the location of the correlation coefficient of gene body methylation and differentially expressed genes in males. Snippet showing
the polynomial regression curves of randomly selected gene sets compared to that observed in males (black regression line). b Correlation
between age‑related differential gene expression and gene body methylation of Reactome pathways gene sets (only pathways with > 50 genes are included). Regression curve through all differentially expressed genes with aging and gene body methylation in males is shown in black.
Distributions of the correlation coefficients generated by correlating log2 fold mRNA change with promoter (c) or gene body methylation (d) for
cutoff (Fig. 5d) and were observed only in males. Path-ways that showed the highest correlation between DNA methylation patterns and transcriptional change with age were pathways previously shown to be involved with aging included inflammatory pathways (transcriptional regulation by RUNX1, MHC II signaling, interferon sign-aling), oxidative stress, proteolysis, cell senescence, epi-genetic regulation, and estrogen signaling (Additional file 8: Table S3, Additional file 9: Table S4).
A central geroscience concept is that age-related changes intersect with those involved with disease patho-genesis, including Alzheimer’s disease [18, 70]. Therefore, we hypothesized that a positive correlation between tran-scriptional changes with neurodegeneration and DNA
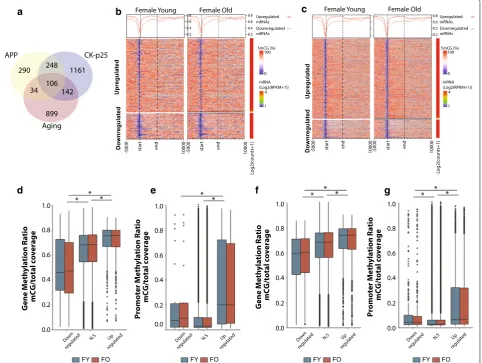
methylation profiles would be observed. To identify genes altered following neurodegeneration in the hippocampus, we used published RNA-sequencing data from two mod-els of AD (APP and Ck-p25) and examined whether gene body and promoter DNA methylation levels in young and old animals are associated with differential gene expres-sion observed in a neurodegenerative disease model. A significant number of genes were unique to each of the models; however, significant overlap was observed between both AD models and with genes altered with aging (APP:Aging χ2 p < 2.2 × 10⁻¹⁶; CK-p25:Aging χ2
p < 2.0 × 10⁻¹⁴; APP:CK-p25 χ2 p < 2.2 × 10⁻¹⁶) (Fig. 6a).
As observed with genes differentially regulated with aging, upregulated genes with both APP and CK-p25
Down regulate
d N.S Up
regulate d
Down regulated
N.S Up regulated Down
regulate d N.S Down
regulate
d N.S Up
regulated 0.0
0.2 0.4 0.6 0.8 1.0
Gene Meth
ylation Ratio
mCG/total co
verag
e
0.0 0.2 0.4 0.6 0.8 1.0
Gene Meth
ylation Ratio
mCG/total co
verage
0.0 0.2 0.4 0.6 0.8 1.0
Promoter Meth
ylation Ratio
mCG/total co
verag
e
0.0 0.2 0.4 0.6 0.8 1.0
Promoter Meth
ylation Rati
o
mCG/total co
verage
Downregulate
d
Upregulated
Downregulate
dU
pregulated
Female Young Female Old Female Young Female Old
Up regulated
a b c
d e f g
APP CK-p25
Aging
290 248 1161
106
899
34 142
* * * * * * *
*
* * *
FY FO
Log2(counts+1)
-5000 star 10000
t
en
d
-5000 star 10000
t
en
d
Log2(counts+1)
-5000 star 10000
t
end
-5000 star 10000
t
end
FY FO FY FO FY FO
Upregulated mRNAs Downregulated mRNAs
5mCG (%)
mRNA (Log2(RPKM+1))
100
0
4
1
0.8 0.6
0.2 0.2
Upregulated mRNAs Downregulated mRNAs
5mCG (%)
mRNA (Log2(RPKM+1))
100
0
4
1
Fig. 6 DNA methylation patterns in hippocampus of young and old animals are associated with genes differentially regulated in models of
neurodegeneration. a Venn‑diagram representing the overlap between genes differentially expressed in two models of neurodegeneration
(APP and CK‑p25) and genes differentially regulated with aging (males and females combined). Heatmaps illustrating the per‑gene gene body
methylation patterns of young and old animals (females only) in genes upregulated and downregulated in two models of neurodegeneration (b
APP, c CK‑p25). Box plots of gene body (d, f) and promoter (e, g) methylation grouped by genes upregulated, unchanged or downregulated in APP
had significantly higher mean methylation in early life compared to downregulated genes (Fig. 6b, c). This was observed for gene body (Fig. 6d, f) and promoter meth-ylation (Fig. 6e, g) as well. Differences in methylation in these models were not examined, therefore a potential difference in methylation due to AD pathology as a driv-ing mechanism of differential gene regulation cannot be excluded; however, our findings suggest that genes differ-entially regulated with neurodegeneration may be more susceptible to change due to their methylation profile in a manner similar to that observed for genes differentially expressed with aging.
DNA methylation‑based prediction of differential expression with aging
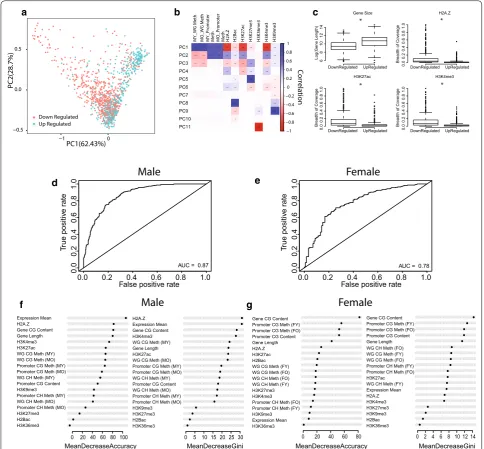
Given the distinction in early-life methylation patterns among age-related differentially expressed genes, we investigated the early-life patterns of other epigenetic marks known to interact with DNA methylation in genes that are up and downregulated with aging. Using publicly available data sets of histone marks maps gen-erated from the young mouse hippocampus and cortex (H2Bac, H3K27ac, H3K27me3, H3K36me3, H3K4me3, H3K9me3, and H2A.Z), we profiled each age-related dif-ferentially expressed gene’s epigenetic landscape using DNA methylation data and the gene’s calculated his-tone breadth of coverage. A principal component analy-sis (PCA) based on genes’ epigenetic profiles revealed a separation between upregulated genes and downregu-lated genes. Combined PC1 and PC2 explained 90% of the variance between upregulated and downregulated genes (Fig. 7a). Correlation of the first component eigen-vectors with the original epigenetic variables showed strong positive correlation with DNA methylation and negative correlation with active transcription marks such as H3K27ac, an active enhancer mark and H3K4me3, an active promoter mark (Fig. 7b). This suggests that at baseline (young age), genes that undergo expression changes with aging are under different epigenetic regu-lation during earlier time-points. Interestingly, the sec-ond principle component (variance explained 28.7%) shown the opposite correlation as the first components and was negatively correlated with gene body methyla-tion and active transcripmethyla-tion marks (Fig. 7b). Together this shows that genes differentially expressed with aging have different epigenetic patterns, starting in early life. This early-life epigenetic landscape may alter these genes’ responsivity to aging. As expected, not all genes differed according to their epigenetic profile. A subset of genes showed a similar epigenetic profile regardless of their expression trajectory.
Next, we set to investigate the associations between different epigenetic marks in age-related differentially
expressed genes. Genes were separated by up and down-regulation with aging and the interactions between the different epigenetic marks were investigated. While the baseline epigenetic profile of genes appear to differ between up and downregulated genes (Figs. 3, 4, 7a, b), the interactions between these epigenetic marks remain consistent between up and downregulated genes. Pro-moter and gene body methylation were positively cor-related with one another in both gene groups, and as expected were negatively correlated with active enhancer and promoter marks, H3K27ac and H3K4me3 (Addi-tional file 10: Figure S6A, B). While the interactions between epigenetic marks did not change between dif-ferentially expressed genes with aging, similar to DNA methylation levels, the baseline levels of different his-tone marks were different between up and downregu-lated genes. Genes that were downregudownregu-lated with aging show higher breadth of coverage of active transcription marks compared to upregulated genes (Fig. 7c). This is consistent with the lower promoter methylation levels observed in these genes. Interestingly, the gene size of up and downregulated genes was also different between up- and down-age-related differentially expressed genes with upregulated genes significantly longer than down-regulated genes (Fig. 7c). Together, these findings further demonstrate that altered epigenetic patterns may con-tribute to the trajectory of change of genes changing with aging.
To strengthen the potential link between differences in epigenetic landscape in young age and differential expression observed late in life we used random forest (RF) modeling to find whether early-life epigenetic pat-terns can predict gene expression changes with aging. The RF models were trained to predict the direction of transcriptional change with age (upregulated or down-regulated) based on methylation data, gene size, relative expression in young age expressed by RPKM, and the epi-genetic marks annotated in the hippocampus and cortex obtained from publicly available data sets (see methods).
prediction included mean expression, DNA methylation levels and gene size (Fig. 7g). Feature importance meas-ures of histone breadth of coverage were much lower in females compared to males. This is likely due to well-doc-umented sex-differences in histone landscape observed in both mice and humans [71], which were not accounted for in the current analysis as most histone data available
for hippocampus obtained for the analysis were collected from male animals.
It should be noted that these different epigenetic marks are not independent of each other as DNA meth-ylation is closely associated with both H3K4me3, an active promoter mark [72], and H3K27ac, an enhancer mark [73]. Regions of H3K4me3 and H3K27ac often
Male
Female
d e
f
Male
gFemale
−0.5 0.0 0.5 −1 0 PC1(62.43%) PC2(28.7%) Down Regulated Up Regulated * * * ** ** ** *** *** *** *** *** *** *** *** *** *** *** *** *** *** *** *** *** *** *** *** *** *** *** *** *** *** *** *** *** *** *** *** *** *** *** *** *** *** *** *** *** −1 −0.8 −0.6 −0.4 −0.2 0 0.2 0.4 0.6 0.8 1 MY_WG Meth MO_WG Meth MY_Promoter Meth MO_Promoter Meth H2A.Z H2Bac H3K27ac H3K27me3 H3K36me3 H3K4me3 H3K9me3
PC1 PC2 PC3 PC4 PC5 PC6 PC7 PC8 PC9 PC10 PC11 DownRegulated UpRegulated 68 10 12 14 Gene Size Log(Gene Length) DownRegulated UpRegulated 0. 00 .2 0. 40 .6 0. 81 .0 H2A.Z
Breadth of Co
ve rage DownRegulated UpRegulated 0. 00 .2 0. 4 0. 60 .8 1. 0 H3K27ac
Breadth of Co
ve rage DownRegulated UpRegulated 0. 00 .2 0. 40 .6 0. 81 .0 H3K4me3
Breadth of Co
ve
rage
a b c
Correlation
* *
* *
False positive rate
Tr
ue positiv
e rate
0.0 0.2 0.4 0.6 0.8 1.0
0. 00 .2 0. 40 .6 0. 81 .0
AUC = 0.78
False positive rate
Tr
ue positiv
e rate
0.0 0.2 0.4 0.6 0.8 1.0
0. 00 .2 0. 40 .6 0. 81 .0
AUC = 0.87
0 20 40 60 80 100 0 5 10 15 20 25 30 MeanDecreaseGini MeanDecreaseAccuracy
H3K36me3 Expression Mean
H3K9me3 Promoter CH Meth (MY)
Promoter CH Meth (MO) H3K4me3
H3K27me3 WG CH Meth (MY)
WG CH Meth (MO) WG CG Meth (MO) WG CG Meth (MY)
H2Bac H3K27ac H2A.Z
Gene Length
Promoter CG Content Promoter CG Meth (MO) Promoter CG Meth (MY) Gene CG Content
H3K36me3 Expression Mean
H3K9me3 Promoter CH Meth (MY) Promoter CH Meth (MO) H3K4me3
H3K27me3 WG CH Meth (MY)
WG CH Meth (MO) WG CG Meth (MO) WG CG Meth (MY)
H2Bac H3K27ac H2A.Z
Gene Length
Promoter CG Content Promoter CG Meth (MO) Promoter CG Meth (MY) Gene CG Content
H3K36me3 Expression Mean H3K9me3 Promoter CH Meth (FY) Promoter CH Meth (FO) H3K4me3 H3K27me3 WG CH Meth (FY) WG CH Meth (FO) WG CG Meth (FO) WG CG Meth (FY) H2Bac H3K27ac H2A.Z Gene Length Promoter CG Content Promoter CG Meth (FO) Promoter CG Meth (FY) Gene CG Content
0 20 40 60 80 0 2 4 6 8 10 12 14 MeanDecreaseGini MeanDecreaseAccuracy
H3K36me3 Expression Mean
H3K9me3 Promoter CH Meth (FY) Promoter CH Meth (FO)
H3K4me3 H3K27me3 WG CH Meth (FY) WG CH Meth (FO)
WG CG Meth (FO) WG CG Meth (FY)
H2Bac H3K27ac
H2A.Z Gene Length Promoter CG Content Promoter CG Meth (FO) Promoter CG Meth (FY) Gene CG Content
Fig. 7 Direction of change of age‑related differentially expressed genes can be predicated based on epigenetic marks in young age. Principle
component analysis of epigenetic profiles of upregulated and downregulated genes with aging in the hippocampus (a). Correlation matrix
representing the correlations between each principle component with epigenetic marks (b). Box plots comparing highly correlated epigenetic
marks with the first principle component in upregulated and downregulated genes with aging (c). Area under the curve of the receive operating
characteristic (ROC) curve showing the classification accuracy of differentially expressed to upregulated and downregulated genes for Random
Forest model in males (d) and females (e). Feature importance of epigenetic marks for classification accuracy (mean decrease accuracy and mean
act coordinately with DNA methylation during gene transcription regulation [74]. Local depletion of DNA methylation is a hallmark of H3K4me3 and H3K27ac [56], and thus these marks are considered to be regu-lated by DNA methylation. Gene size was a significant contributor to the accuracy of the models (Fig. 7c, d), the relationship between gene length and DNA methyl-ation is still not completely understood; however, tran-scription of long genes may be partially regulated by DNA methylation. For example, in the CNS transcrip-tional regulation of long genes is mediated through the DNA methylation binding protein MeCP2 [75]. The results presented here are in agreement with those of Benayoun et al. [76] which examined some of these marks but not DNA methylation in the cerebellum and olfactory bulb. Taken together, these results put for-ward the concept that epigenetic regulation at a young age may direct transcriptional change with aging.
Discussion
These studies reveal, by analyzing the methylation and transcriptional profiles in the hippocampus of young and old animals, evidence for a potentially novel role for DNA methylation in regulating transcriptional changes with age that is independent of age-related changes to the methylome. These data demonstrate a propen-sity for genes to be upregulated or downregulated in expression with aging based on their methylation pro-files established early in life. Additionally, differences in methylation with age are enriched in exonic and intronic regions, and showed a weak inverse correlation with differences in gene expression. The functional role of gene body methylation is not yet well defined but is associated with transcriptional elongation [77], splic-ing [64, 65, 67, 78], regulation of alternative promoters [79], and modulation of expression levels through inter-action with methyl-binding proteins such as MeCP2 [80, 81]. In the CNS, in contrast to other tissues, gene body methylation is inversely correlated with expres-sion levels [1, 82], a relationship observed here. The diverse functional roles of gene body methylation cre-ate a challenge in interpreting the association between gene body age-DMRs and the altered transcriptional profile with aging. Nevertheless, age-related differen-tial methylation within genes is common to various tis-sues; therefore, improved knowledge on how gene body methylation regulates expression is required to under-stand the potential functions age-DMRs play in regula-tion of the aging transcriptome. Together these findings emphasize the importance of gene body methylation, in addition to promoter regions, as a gene expression regulatory mechanism.
Association of promoter age‑DMRs with age‑DEGs is limited
The association between DNA methylation and gene expression is often derived from the inverse correlation between mRNA expression and DNA methylation in promoters under normal conditions [8]. While differ-ences in promoter methylation in the hippocampus occur with aging, the genes associated with these promoters are generally not differentially expressed with age (Fig. 2). A potential explanation is that observed changes to the methylome with age are subtle and therefore insufficient to induce transcriptional differences, however, a weak correlation between gene expression changes and differ-ential promoter methylation is also observed in studies of cancer and cellular differentiation [83, 84], which include disruption to- (cancer) or reprogramming of- (differen-tiation) the methylome. The limited correlation between age-related differential promoter methylation and gene expression changes does not preclude differential pro-moter methylation from altering expression of specific genes, but is insufficient to explain the majority of tran-scriptional changes observed with age in the hippocam-pus. It should also be noted that gene expression changes rapidly with stimuli and the expression levels here were collected to represent steady-state expression levels. As well, examination of specific call types or even single cells is needed as these data represent a mix of cell types pre-sent in the hippocampus.
Enhancer age‑DMRs are related to age‑DEGs
Recent studies identified that altered DNA methyla-tion patterns play a greater role in explaining transcrip-tional changes when they occur in distal regulatory regions, namely enhancers, compared to gene promoters [84]. Age-related differential methylation is enriched in enhancer marks in various tissues [37, 85–87], including in the hippocampus [26]. With aging, altered methylation in differentiating cells, specifically hypomethylation, was shown to be enriched in regions marked by H3K4me1 [88], a marker of active and poised enhancers [89], and is thought to activate gene expression. Consistent with these findings, we found enrichment of both hyper- and hypo-methylated age-DMRs in regions distal to gene promoters, specifically in annotated active and poised enhancers. These age-DMRs were inversely correlated with transcriptional differences with aging in both males and females.
methylation depending on the regulatory nature of the enhancer and the developmental stage of the organism [55, 56, 91]. Enhancers containing transcription factor binding motifs tend to be inversely correlated with DNA methylation late in life, but not during cellular differen-tiation where DNA methylation increases in enhancers proximal to genes that involve cellular specification [74]. Methylation of super-enhancers is thought to contribute to the structural integrity of the genome at these regions [91, 92]. Although alterations in chromatin landscape with aging have been reported, few studies have mapped altered histone marks with age. H2A.Z, a histone variant needed for the acetylation of histone 3 lysine 27 [93], does change with aging in the hippocampus [94], and may be a contributing mechanism to enhancer mark changes with aging. Given these results we hypothesize that changes in methylation can potentially alter transcription through attenuation of enhancer strength rather than facilitat-ing deposition of H3K27ac. Future studies will need to address this hypothesis by mapping the differences in enhancer landscape with age in both male and female and in different cell/tissue types.
A unique feature of genes that were differentially expressed with age was their association with DNA meth-ylation patterns established in early life (i.e., methmeth-ylation levels in young animals). Methylation levels of upregu-lated genes were higher than levels of downreguupregu-lated genes in young animals, this difference persists in old animals and therefore was generally independent of age-related differential methylation. The association between methylation levels and expression was not observed for genes that were not altered with aging or randomly selected genes. Furthermore, gene expression changes with aging were generally different between males and females, yet a similar association was observed in both sexes. This finding supports the concept that, based on their epigenetic patterns established early in life, specific genes have a higher propensity to change with age than others and that their induction/reduction is dependent on the methylation status of the gene. Therefore, suppres-sion or induction of genes with aging is likely to occur downstream of methylation by factors that interact with the methylome such as histone modifications or methyl-binding protein dynamics. An additional finding was that genes that changed with age and correlated with early-life methylation occur in specific gene sets that function in similar pathways. This is consistent with the notion that genes with similar functions are regulated in similar ways [95, 96].
Using the predictive capabilities of machine learn-ing we were able to show that baseline gene expression and DNA methylation levels alone can classify whether differentially expressed genes will be downregulated or
upregulated. When other epigenetic marks from the young/adult brain are added to the model, the classifica-tion accuracy of the model improves. This provides fur-ther support to the idea of early epigenetic programming as a determining factor of expression changes with age. A recent study [76] showed similar results by predict-ing age-related expression changes based on chromatin marks. The authors found that changes in the enhancer mark H3K27ac with age were among the highly impor-tant features for accurate classification. This indicates that age-related alterations to the epigenome contribute to transcriptional changes with age. Although changes in chromatin predict gene expression changes well, we were able to achieve similar predictive capabilities based on early-life DNA methylation alone, and in both males and females. Future studies combining both baseline epi-genetic profiles and age-related alteration to histones are needed to improve the classification accuracy of these models, and perhaps help identify the interplay between mechanisms that underlie epigenetic regulation of tran-scriptional changes with aging.
Aging processes are thought to promote the develop-ment of age-related neurodegenerations like AD and PD [47]. In our study we find that the association between early-life methylation patterns and differential gene expression is also observed in genes that are dysregulated in mouse-models of AD. That is, genes that were upregu-lated in a model of neurodegenerative disease had higher gene body methylation at young age compared to those that were downregulated. Thus, it is plausible that DNA methylation patterns established at young age may facili-tate transcriptional changes and more severe conditions in late life as well. Given that genetic differences are asso-ciated with age-related transcriptional differences [97], and increased longevity in supercentenarians [98, 99] it is entirely plausible that early-life epigenetic patterns could have similar impacts. This raises the question of what may cause epigenetic differences in early life that have late-life outcomes.
to prevent age-related transcriptional changes and pro-mote a pro-longevity phenotype.
Conclusions
Age-related differences in epigenetic marks are likely to contribute to transcriptional alterations, however, these epigenetic differences account for a small subset of the gene expression changes with aging and are dependent on the genomic location, e.g., promoter vs. regulatory region. It is noteworthy that our current knowledge of the exact location of regulatory marks is far from com-plete and is likely to vary between cell types, tissues, and sexes. It would be important to test predictive valid-ity with improved and more complete data sets as well as refined locations of TSSs, alternative splice sites, and gene regulatory marks. Our current findings identify a potential new way in which DNA methylation can influ-ence age-related transcriptional change. The early estab-lishment of DNA methylation patterns of a gene appears to partially determine whether the gene will change with age and the directionality of the change. Interestingly, a recent manuscript identified a similar finding examin-ing histone modifications in the cerebellum and olfactory bulb [76]. We also observed this association with aging in the liver and in Alzheimer’s disease models. Together, these findings indicate that the early-life epigenetic land-scape of a gene may direct its gene expression trajectory with aging and age-related disease. These findings pro-vide a potential mechanism for the developmental ori-gins of disease concept [105].
Materials and methods
Animals and nucleic acid extraction
Male and female C57BL/6 mice were obtained from the NIA aging colony at 2 and 21 months of age. Mice were housed at the University of Oklahoma Health Sciences Center barrier animal facility and maintained under SPF conditions until 3 and 24 months of age. All experimen-tal procedures were performed according to protocols approved by the OUHSC Institutional Animal Care and Use Committee. Mice were euthanized by decapitation and hippocampal tissue was dissected and snap-frozen until used for DNA and RNA extraction. DNA and RNA from young and old animals (n= 6/group) were isolated from hippocampal tissue using Zymo Duet DNA/RNA (Zymo research).
Whole‑genome bisulfite sequencing and DMR calling
Isolated genomic DNA from young and old animals (n= 3/group) was used for Whole-Genome Bisulfite Sequencing (WGBS). Bisulfite conversion was car-ried out using EZ DNA methylation Lighting (Zymo Research, Irvine, CA) and library construction used Swift
Accel-NGS methyl-seq kit reagents (Swift Bioscience, Ann Arbor, MI) following manufacturer’s instructions. Library size was assessed by Tapestation (Agilent Tech-nologies, Santa Clara, CA) and quantified by quantita-tive PCR (Kappa Biosystems, Wilmington, MA) prior to sequencing. BS-seq libraries were sequenced by 100 bp paired-end reads on the Illumina HiSeq-2500 (Illumina, San Diego, California, USA). Sequencing data will be made available upon manuscript submission.
Paired-end reads were trimmed using trimmomatic version 0.35 [106]. Reads were adapter-trimmed and fil-tered based on quality. Bases with a Q-score < 30 were removed from the 5′ and 3′ ends. Reads were quality-fil-tered using a sliding window approach (parameters were set to 5:30). Additionally, reads shorter < 25 bp post-trim-ming were removed. Trimmed PE reads were aligned to the mouse reference genome (GRCm38/mm10) with Bis-mark Bisulfite Mapper version 0.14.4 [107] using default settings. Methylation % and coverage of each CpG site were extracted with bismark methylation extractor. Mean coverage per sample was 5× (± 0.4 SD). For differentially methylated regions calling, sites with < 5× mean cover-age per group were removed resulting based previous sequencing recommendations [108] in > 20 million CG sites analyzed (Additional file 11: Figure S7).
To determine differentially methylated regions (age-DMRs), the genome was binned into consecutive, non-overlapping 500 bp windows. Samples within each group were combined to achieve higher coverage per site, and windows with < 10 CpG sites were omitted from the anal-ysis (Additional file 11: Figure S7). The number of CpGs per widow was determined based on approximation of CpG density, Statistical significance of differential meth-ylation was determined using Fisher’s exact test followed by false-discovery multiple testing correction. Differen-tially methylated regions were considered statistically dif-ferent if FDR-adjusted p value < 0.05.
RNA sequencing and differential gene expression analysis
RNA integrity was quantified by TapeStation (Agilent Technologies, Frankfurt, Germany) and samples had RNA integrity numbers > 8. RNA-sequencing libraries were prepared using Illumina’s TruSeq RNA-seq library prep with a rRNA depletion step according to manu-facturer’s instructions. Libraries were sequenced with 150 bp paired-end (PE) reads on the Illumina HiSeq 4000 platform (Illumina, San Diego, California, USA) (n= 6/ group). Sequence quality control was performed with fastQC. Following QC step PE reads were trimmed simi-larly to the WGBS sequences using trimmomatic.
GENCODE M15 release. STAR Alignment parameters were set to: outFilterScoreMin 2, outFilterMultimapN-max 5, outFilterMismatchNoutFilterMultimapN-max 10, outFilterMatchNmin 20, outSJfilterReads Unique, outSJfilterOverhangMin 25 10 10 10, alignSJoverhangMin 2, alignSJDBoverhangMin 2, chimSegmentMin 25. Reads per gene were counted in R using the ‘summarizeOverlap’ function in the Genomi-cAlignments package. Raw reads were normalized using DESeq 2 R package [110] and transformed using vari-ance stabilized transformation. Differential expression between all groups was assessed using multiple linear regression (R package ‘glm’) using read counts as the dependent variable and age (young and old) and sex (male and female) as the independent variables. Genes with significant age main effect (p < 0.05) were then car-ried on for pair-wise comparisons using Conover post-hoc test followed by false discovery rate adjustment using ‘fdr’ as implemented in the R package ‘lsmeans’.
Enrichment analysis
For pathway enrichment age-DMRs were annotated using ChIPseeker [111], and enrichment analysis was performed using the R package ‘ReactomePA’ [112]. To determine over- and under-representation of DMRs in genomic features, annotated introns, exons, and CpG islands were obtained from UCSC Genome Browser. Promoters were defined as ± 1 kb from the transcription start site. CpG shores were defined as 2 kb upstream and downstream of the annotated CpG island board-ers and CpG shelves were defined as 2 kb upstream and downstream from shores. Of the 18,000 genes identified to be expressed in our set, > 94% had a DMR mapped to their gene body, and > 85% had a DMR mapped to their promoter (Additional file 11: Figure S7). Gene-regu-latory regions in the mouse brain were extracted from Ensemble open database [113]. DMRs were mapped to genomic features using ‘bedtools’ [114]. Statistical sig-nificance of over- or under-representation of DMRs in genomic features was determined using hypergeometric test in R.
Differential expression prediction
Differentially expressed mRNAs with aging were classi-fied based on the directionality of change (upregulated or downregulated) and divided into a training set and a validation set by randomly subsetting 70% of the genes to the training set, the remaining genes were used for model validation. Prediction of gene change direction-ality with aging was performed separately for male and females. Random forest (RF) was used for prediction, and all analysis and cross-validation was performed in R using the ‘randomforest’ package. The RF model was trained based on selected epigenetic features including
mean gene DNA methylation in young and old, mean promoter (± 1 kb of TSS) methylation in young and old, gene size, base expression at 3 months, and breadth of coverage of the following histone marks: H2A.Z from young and old animals, H3K27ac, H3K36me3, H3K4me3, H3K27me3, H2Bac, and H3K9me3. Breadth of coverage was calculated by the breadth sum of all peaks in a gene/ gene length.
Public data acquisition
Paired methylation and differential expression data for liver were obtained from GEO:GSE92486 [33]. Differen-tial genes expression for age-related neurodegenerative disease APPswe/PS1ΔE9 (APP) and Ck-P25 models were obtained from GEO:GSE93678 [115] and GEO:GSE65159 [116]. Only WT control and experimental groups were used. ChIP-sequencing data of hippocampal histone marks were obtained from GEO:GSE85873 (H3K4me3 and H3K27me3) [117], GEO:GSE103358 (H2Bac), and GEO:GSE100039 (H2A.Z) [94]. Cortex epigenetic marks including H3K27ac, H3K36me3, and H3K9me3 were obtained from GEO: GSE103214 [118]. Peak calling was determined with MACS2 [119].
Supplementary information
Supplementary information accompanies this paper at https ://doi.
org/10.1186/s1307 2‑019‑0306‑5.
Additional file 1: Figure S1. Distribution of gene body methylation using RRBS and WGBS. A comparison of the distribution of gene body methylation across all genes in the liver measured by reduced representa‑ tion bisulfite sequencing (RRBS) and whole‑genome bisulfite sequencing (WGBS) obtained from GEO:GSE92486. RRBS covers methylation over por‑ tions of 23,000 genes as compared to near complete coverage of 29,000 genes by WGBS. The gene body methylation profiles obtained by RRBS do not represent the gene body methylation values observed by WGBS, likely in part due to the preference of RRBS for regions of high CG density which often have low levels of methylation (e.g., CpG Islands).
Additional file 2: Figure S2. Global DNA methylation levels measures using WGBS. A) Box plots of whole‑genome methylation in young and old males and females. Box plots showing the methylation levels of cytosines mapped to all transposable element regions (B) or to specific transposable element families. Long interspersed nuclear repeats, LINEs (C), small inter‑ spersed nuclear repeats, SINEs (D), DNA transposons (E), and long terminal repeats, LTRs (F), n= 3/group.
Additional file 3: Table S1. List of Reactome pathways enriched with age‑related DMRs.
Additional file 4: Table S2. List of Reactome pathways enriched with age‑related DMRs separated by hypermethylation and hypomethylation.
Additional file 6: Figure S4. Positive association between methylation and gene expression is limited for CH methylation. Box plots of whole gene (A, B) or promoter (C, D) CH methylation in females (A, C) and males (B, D) grouped by genes that are upregulated, downregulated, or unchanged with aging in the respective group.
Additional file 7: Figure S5. Age‑related differentially expressed genes are positively associated with gene body methylation in the Liver A) Genes downregulated with aging have lower gene body methylation at young age (blue regression line) compared to genes upregulated with aging in the liver. This relationship is maintained with aging (red regression line). Curve corresponds to the polynomial regression curve across significant (red and blue) and non‑significant (black) differentially expressed genes. B) Box plot of whole gene methylation grouped by genes upregulated, non‑differentially expressed, and downregulated genes in the liver. *p < 0.001 (Kruskal–Wallis Test).
Additional file 8: Table S3. Reactome pathways presenting high correla‑ tion between age‑related expression fold change and early life gene body methylation patterns.
Additional file 9: Table S4. Reactome pathways presenting high cor‑ relation between age‑related expression fold change and early life gene promoter methylation patterns.
Additional file 10: Figure S6. Direction of change of age‑related dif‑ ferentially expressed genes can be predicted based on DNA methylation profiles. Correlation matrices of different epigenetic features in down‑ regulated genes with aging (A) and upregulated genes with aging (B). Area under the curve of the receive operating characteristics (ROC) curve showing the classification accuracy of age‑related differentially expressed genes to upregulated and downregulated genes for Random Forest model in males (C) and females (D) trained based on baseline methylation and promoter and gene body DNA methylation. TRatio—gene ratio; wg— whole gene; tss—transcription start site; my—male young; mo—male old.
Additional file 11: Figure S7. Sequencing alignment and differentially methylated region calling summary statistics. A. Boxplots representing the mapping efficiency per group. B. Overall genomic sequencing coverage. C. Boxplots showing the number of CpGs covered. D. Boxplots represent‑ ing the average CpG coverage per group. E. Line plot of the number of DMRs mapped to genes (black and red) and gene promoters (green and blue) passed filtering from RNA‑sequencing. F. Line plot showing the number of CpG in regions passed filtering for differential methylation.
Acknowledgements
The authors would like to acknowledge the University of Oklahoma Super‑ computing Center for Education & Research (OSCER) for allocating computa‑ tional resources used for data analysis and the Oklahoma Medical Research Foundation for sequencing assistance. This work was supported by Veterans Administration (I01BX003906), National Institute on Aging (P30AG050911, R56AG059430, T32AG052363, R01AG0256161), National Institute of General Medical Sciences (P20GM125528) and Oklahoma Center for Adult Stem Cell Research—a program of TSET, funding.
Authors’ contributions
NH performed all post alignment data analysis. DRM performed the library preparations and file processing was performed by NH and DRS. Annotation of transposable elements was performed by LBB. WMF supervised all the work and provided funding. NH and WMF wrote the manuscript. All authors contributed to the interpretation of results and to the review and editing of the manuscript. All authors read and approved the final manuscript.
Funding
This work was funded through Grants from the National Institute of Health, Veterans Administration, and Oklahoma Center for Adult Stem Cell Research. These funding bodies have no role in the design of the study, data collection, analysis, or interpretation of data or in writing of the manuscript.
Availability of data and materials
Raw sequencing data are submitted to the Sequencing Read Archive (SRA) under bioProject number PRJNA523985.
Ethics approval and consent to participate
All animal experimental procedures were performed according to protocols approved by the University of Oklahoma Health Sciences Center Institutional Animal Care and Use Committee.
Consent for publication
Not applicable.
Competing interests
The authors declare that they have no competing interests.
Author details
1 Oklahoma Center for Neuroscience, Oklahoma City, OK, USA. 2 Reynolds
Oklahoma Center on Aging, SLY‑BRC 1370, 975 NE 10th St, Oklahoma City, OK 73104, USA. 3 Department of Physiology, Oklahoma City, OK, USA. 4 The Jack‑
son Laboratory, Bar Harbor, ME 04609, USA. 5 Oklahoma Nathan Shock Center,
University of Oklahoma Health Sciences Center, Oklahoma City, OK, USA.
6 Oklahoma City VA Medical Center, Oklahoma City, OK 73104, USA. 7 Present
Address: The Jackson Laboratory, Bar Harbor, ME 04609, USA.
Received: 2 June 2019 Accepted: 14 September 2019
References
1. Lister R, et al. Global epigenomic reconfiguration during mammalian brain development. Science. 2013;341(6146):1237905.
2. Bourc’his D, et al. Dnmt3L and the establishment of maternal genomic imprints. Science. 2001;294(5551):2536–9.
3. Kaneda M, et al. Essential role for de novo DNA methyltrans‑ ferase Dnmt3a in paternal and maternal imprinting. Nature. 2004;429(6994):900–3.
4. Law JA, Jacobsen SE. Establishing, maintaining and modifying DNA methylation patterns in plants and animals. Nat Rev Genet. 2010;11(3):204–20.
5. Disteche CM, Berletch JB. X‑chromosome inactivation and escape. J Genet. 2015;94(4):591–9.
6. Duncan CG, et al. Dosage compensation and DNA methylation land‑ scape of the X chromosome in mouse liver. Sci Rep. 2018;8(1):10138. 7. Hellman A, Chess A. Gene body‑specific methylation on the active X
chromosome. Science. 2007;315(5815):1141–3.
8. Jones PA. Functions of DNA methylation: islands, start sites, gene bod‑ ies and beyond. Nat Rev Genet. 2012;13(7):484–92.
9. Meng H, et al. DNA methylation, its mediators and genome integrity. Int J Biol Sci. 2015;11(5):604–17.
10. Baylin SB, et al. Aberrant patterns of DNA methylation, chroma‑ tin formation and gene expression in cancer. Hum Mol Genet. 2001;10(7):687–92.
11. Bhattacharjee D, Shenoy S, Bairy KL. DNA methylation and chromatin remodeling: the blueprint of cancer epigenetics. Scientifica (Cairo). 2016;2016:6072357.
12. Yang X, et al. Gene body methylation can alter gene expression and is a therapeutic target in cancer. Cancer Cell. 2014;26(4):577–90.
13. Maghbooli Z, et al. Aberrant DNA methylation patterns in diabetic nephropathy. J Diabetes Metab Disord. 2014;13:69.
14. Maier S, Olek A. Diabetes: a candidate disease for efficient DNA meth‑ ylation profiling. J Nutr. 2002;132(8 Suppl):2440S–3S.
15. Bennett DA, et al. Epigenomics of Alzheimer’s disease. Transl Res. 2015;165(1):200–20.
16. Huo Z, et al. DNA methylation variability in Alzheimer’s disease. Neuro‑ biol Aging. 2018;76:35–44.
17. Wang SC, Oelze B, Schumacher A. Age‑specific epigenetic drift in late‑ onset Alzheimer’s disease. PLoS ONE. 2008;3(7):e2698.
18. Lopez‑Otin C, et al. The hallmarks of aging. Cell. 2013;153(6):1194–217. 19. Horvath S. DNA methylation age of human tissues and cell types.