* Corresponding author.Tel.: +989113278634. E-mail address: [email protected] (R. Mikaeil).
Journal Homepage: ijmge.ut.ac.ir
Evaluation of Cutting Performance of Diamond Saw Machine Using
Artificial Bee Colony (ABC) Algorithm
Masoud Akhyani
a, Farhang Sereshki
a, Reza Mikaeil
b, *, Mohammad Taji
ca Faculty of Mining, Petroleum and Geophysics, Shahrood University of Technology, Shahrood, Iran.
bDepartment of Mining and Metallurgical Eng, Urmia University of Technology, Urmia, Iran
cDepartment of mining Engineering, Shahrood Branch, Islamic Azad University, Shahrood, Iran.
ABSTRACT
Artificial Intelligence (AI) techniques are used for solving the intractable engineering problems. In this study, it is aimed to study the application of artificial bee colony algorithm to predict the performance of circular diamond saw of hard rocks. For this purpose, fourteen types of hard rocks were cut in laboratory using a cutting rig of 5 mm deep cut, feed rate of 40 cm/min and peripheral speed of 3000 rpm. Four major mechanical and physical properties of rocks such as uniaxial compressive strength (UCS), Schimazek abrasivity factor (SF-a), Mohs hardness (Mh), and Young’s modulus (Ym) were determined in rock mechanic laboratory. Artificial bee colony (ABC) was used to classify the performance of circular diamond saw based on mentioned mechanical properties of rocks. Ampere consumption and wear rate of diamond saw were investigated to evaluate the result of ABC algorithm. Ampere consumption was determined during the cutting process and the average wear rate of diamond saw was calculated from the loss of width, length and height. Comparing the results of ABC and cutting performance (ampere consumption and wear rate of diamond saw) indicated the proper ability of metaheuristic algorithm such as ABC to evaluate the cutting performance
Keywords : Ampere consumption, Cutting performance, Metaheuristic algorithm, Wear rate
1.
Introduction
Circular diamond saw has been widely used in dimension stone factories. Predicting the performance of circular diamond saw can be important in estimating the cost and finding the best designs of the plants. The performance of circular diamond saw is affected by many parameters such as the rock properties, sawing properties including saw operating and design characteristics, as well as the operating skills and work condition. Among these factors, sawing characteristics and operating skills can be controlled in the sawing process but the rock properties cannot be controlled in since they are related to the rock’s physical and mechanical properties [1].
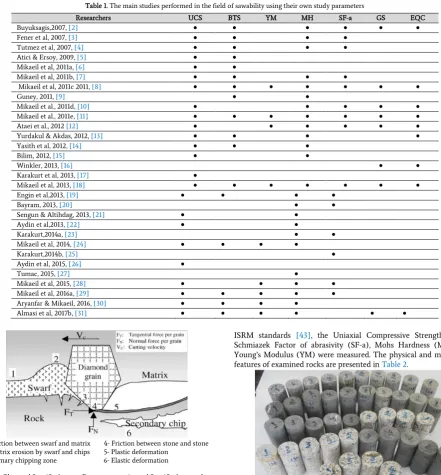
Since 2007, the relationship between rock features and sawability has been addressed in many studies. Table 1 provides a review of the most important and well-known conducted studies. According to Table 1, usually studied parameters consist of Uniaxial Compressive Strength (UCS), indirect Brazilian Tensile Strength (BTS), Schimazek abrasivity factor (SF-a), Mohs hardness (Mh), Young’s modulus (Ym), Grain Size (GS) and Equivalent Quartz Content (EQC). These studies are indicative of the importance of these parameters in cutting performance of diamond saw machine.
In recent years, application of meta-heuristic methods in solving vague and complex systems has been significantly increased due to their ability in adapting optimization concepts to uncertainty problems in the modeling systems [32, 33-34]. Among meta-heuristic techniques, the Artificial Bee Colony Algorithm (ABC) is one of the most widely used evolutionary methods in the area of soft computing. This algorithm was first introduced by Karaboga and inspired by the bees’ lifestyle, and their
attempt to provide food was used for the optimization of different problems in the industry, transportation systems and traffic problems
[35, 36, 37, 38, 39-40].
In this study, it is aimed to study the application of artificial bee colony algorithm for predicting the performance of circular diamond saw in sawing hard rocks based on important physical and mechanical properties of rocks.
2.
Sawing mechanism
Sawing chips form when a work-piece material is destroyed with the use of a circular diamond saw in a way that the saw cuts into the work-piece at a constant traverse rate as it rotates around its center with an angular speed. As a result, the surface of the work-piece is scratched and cracked with the removal of the materials from the segment surface by the diamond particles. There are two cutting mechanisms during these processes. First, tangential forces exert some stresses in front of a grain involved in the process. Therefore, tensile and compressive stresses produce a swarf. This mechanism is referred to as the primary chip formation. The swarf is forced out in front of and from beside the abrasive grain, which usually possesses a small size. The cutting progress should reach a certain minimum thickness of grinding since the rock shows an elastic behavior up to its ultimate stress. The compressive stress under the diamond deforms the rock cut. A brittle fracture as a critical tensile stress is achieved via an elastic revision caused by the load removal. This is the secondary chip formation process induced by a tensile stress as is illustrated in Fig. 1. Finally, the coolant fluid removes the swarf away [41].
Article History:
Table 1. The main studies performed in the field of sawability using their own study parameters
Researchers UCS BTS YM MH SF-a GS EQC
Buyuksagis,2007, [2] ● ● ● ● ● ●
Fener et al, 2007, [3] ● ● ● ●
Tutmez et al, 2007, [4] ● ● ● ●
Atici & Ersoy, 2009, [5] ● ●
Mikaeil et al, 2011a, [6] ● ●
Mikaeil et al, 2011b, [7] ● ● ● ●
Mikaeil et al, 2011c 2011, [8] ● ● ● ● ● ● ●
Guney, 2011, [9] ● ●
Mikaeil et al., 2011d, [10] ● ● ● ● ●
Mikaeil et al., 2011e, [11] ● ● ● ● ● ● ●
Ataei et al., 2012 [12] ● ● ● ● ● ●
Yurdakul & Akdas, 2012, [13] ● ● ● ●
Yasith et al, 2012, [14] ● ● ●
Bilim, 2012, [15] ● ●
Winkler, 2013, [16] ● ●
Karakurt et al, 2013, [17] ●
Mikaeil et al, 2013, [18] ● ● ● ● ● ● ●
Engin et al,2013, [19] ● ● ● ●
Bayram, 2013, [20] ● ●
Sengun & Altihdag, 2013, [21] ● ●
Aydin et al,2013, [22] ● ●
Karakurt,2014a, [23] ● ●
Mikaeil et al, 2014, [24] ● ● ● ●
Karakurt,2014b, [25] ●
Aydin et al, 2015, [26] ●
Tumac, 2015, [27] ●
Mikaeil et al, 2015, [28] ● ● ● ●
Mikaeil et al, 2016a, [29] ● ● ● ● ●
Aryanfar & Mikaeil, 2016, [30] ● ● ● ●
Almasi et al, 2017b, [31] ● ● ● ● ● ●
1- Friction between swarf and matrix 4- Friction between stone and stone 2- Matrix erosion by swarf and chips 5- Plastic deformation
3- Primary chipping zone 6- Elastic deformation
Fig. 1. Observed Specific Ampere Draw versus estimated Specific Ampere for model 3 (test data).
3.
Laboratory studies
To perform the laboratory tests, several blocks of rock samples were collected from the famous Iranian factories. These samples were selected based on their high usage in rock industry. To collect the rock samples, it was attempted to obtain sufficiently big specimens of each rock type for conducting every tests on the same piece (Fig. 2). To prepare the test specimens without any fractures, partings, or alteration zones, each block sample underwent an inspection for any probable macroscopic defects. The test samples were then prepared from these block samples. The main goals in mechanical and physical properties selection are to choose the minimum number of properties, avoid using equivalent parameters, and select only one parameter from a certain group. Therefore, the parameters selected in this paper to evaluate the sawability of hard rocks were as follows: Uniaxial Compressive Strength (UCS) Schimazek’s F-abrasiveness (SF-a) factor Mohs Hardness (MH) Young’s Modulus (YM) [18]. Based on the procedures suggested by
ISRM standards [43], the Uniaxial Compressive Strength (UCS), Schmiazek Factor of abrasivity (SF-a), Mohs Hardness (MH), and Young’s Modulus (YM) were measured. The physical and mechanical features of examined rocks are presented in Table 2.
Fig. 2. Some of prepared specimens for mechanical tests.
Table 2. The physical and mechanical characteristics of studied rocks. Sample
Number (Mpa) UCS Mh (n) (GPa) Ym (Mpa) BTS EQc (%) (mm) Gs (N/mm) SF-a
1 157 5.6 37 15.46 52 1.13 9.1
2 138 6.1 29 8.15 64 1.14 5.95
3 141 6 41.5 10.15 61 1.25 7.74
4 173 5.7 46 15.98 35 1.43 7.99
5 155 5.7 39 13.1 55 2.06 14.84
6 150 5.7 43 11.28 55 2.16 13.4
7 185 5.3 49 17 55 1.16 10.84
8 239 6.4 52 18.86 66.5 0.77 9.65
9 199 5 49.5 16.14 37 0.91 5.44
10 145 5.95 36 9.2 64.3 4.1 24.25
11 173 6.6 49 15 60.06 0.87 7.6
12 133 5.65 29 8.3 32.2 3.9 10.42
13 125 5.6 31 7.4 30.3 3.8 8.5
4.
Classification of studied rocks by Artificial Bee Colony
(ABC) Algorithm
The performance of ABC algorithm was inspired by the honey bee colony procedure. The honey bee colony is generally composed of three sections, including food sources, employed and unemployed bees. In addition, unemployed bees are divided into two sections of onlooker bees and scout bees. In their behavior and lifestyle, honey bees use a complex communicative system. The relationship among bees is made through a dance language. The dance language includes a set of continuous motions done by bees. This dance, called waggle dance, contains information on the quality of source, location and position of bees. First, a set of food sources is randomly selected. Employed bees move toward the sources and compute their amount of honey. Then, these bees return to the hive and share their information with onlooker bees. In the second step, after the information exchange, each employed bee moves toward a source observed before and may select a new source near the previous one based on the information in its mind. Furthermore, scout bees search the surrounding environment for finding new food sources. If the food source is run out or bees leave there and move toward a new source, first the fitness of the new source (solution) is investigated based on the information of previous sources (solutions). If this fitness is more than the previous steps, the new source (solution) is maintained in the memory of the bee, otherwise the computation of the fitness of new food sources is another criterion for assessing the last and best source. This process continues until all the requirements are met (finding the most optimal solution). These steps are computed through Eq. 1.
( )
x x x
ij ij ij ij kj
(1)
{1, 2, 3, ..., } ,
k BN i k
{1, 2, 3, ..., }
j D
Where 𝑣𝑖𝑗 is the position of the initial bee, and 𝑥𝑖𝑗and 𝑥𝑘𝑗are
positions of the initial and other bees (neighbor bees), respectively. The less the value of 𝑥𝑖𝑗− 𝑥𝑘𝑗is, the less the deviation from 𝑥𝑖𝑗 will be. Values
k and j are randomly selected and BN is the number of employed bees which is equal to SN, food source number. In addition, variable k is different from variable i. 𝜙𝑖𝑗 is a random number between interval [-1 &
1] and this variable controls the production of food sources around 𝑥𝑖𝑗.
In fact, in equation (1), it is attempted that in the next movements, the obtained initial position moves toward or against the value of index. 𝜙𝑖𝑗.
The difference between this algorithm and other meta-heuristic ones such as PSO is that in this algorithm, considering the selection of random numbers from index. 𝜙𝑖𝑗, it is attempted to use diversity as
much as possible and it prevents bees from being placed at optimum points [6, 44]. As mentioned, after the end of searching operations, onlookers investigate and evaluate the information obtained from employed bees and then considering the data analysis about the food sources, they select one of the food sources with a proper probability
[34]. Eq. 2 computes this probability.
1 fit i p i SN fit n n (2)
Where Pi indicates a proper probability for the food source. SN is the
number of food sources (the number of existing solutions). fiti is the
fitness function of food sources which corresponds to the ith bee. If a
food source is run out and or lacks a proper quality, employed bees leave it and turn into scout bees. It means that if in the fitness model, a point is not improved after several iterations, the local optimal point must be left and a new random point will be selected. Selection of a proper method and approach for solving complex systems depends on the condition and amount of complexity in the system. A wrong selection of modeling system not only finds a wrong solution for the problem, but also leads to more complexity and creates a reverse approach in solving the problem. Thus, in this research, considering that there is an uncertainty in the nature and characteristics of rocks on one hand, and
an uncertainty in results obtained from experiments on the other hand, the Artificial Bee Colony Algorithm (ABC) is used for evaluation and investigation of results.
4.1.Modeling
In order to investigate and evaluate the experimental results obtained from this research, one of the most important applications of the Artificial Bee Colony Algorithm (ABC) is optimization which is used in data classification. In this procedure, based on eq. 3, Loyd’s Algorithm (k-means) is used and fitted as the objective function in ABC algorithm in order to classify data [45].
. min ( , )
1 1
n
Obj Function d x m
i j j k i (3)
Where mi is the center of cluster and k is the number of clusters. xi is
the data set and value of i is i=[1,2,3,…,n]. Furthermore, d is the Euclidean distance of the center of cluster to each member.
In fact, the aim of this section is to develop an integrated approach using the ABC and Loyd’s Algorithms (k-means). They belong to an appropriate optimized classification, and therefore, the two classification methods are combined.
In the first step of modeling, the pseudo code of ABC algorithm and its objective function are written. Then, the algorithm’s control parameters such as the maximum number of iterations, the population size (colony size) and the minimum acceptable error are considered as 300, 50 and 𝜀𝐿= 0 ∙ 00001, respectively. These control parameters of
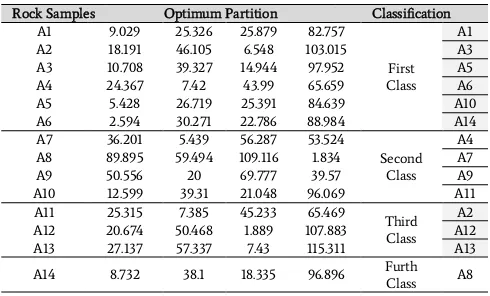
algorithm are important to a suitable optimization which are selected by experts’ suggestions and previous studies [46]. Hence, in this study, these control parameters were selected after several experts’ consultation meetings. In addition, obtained results from laboratory tests on 14 rock samples and four major rocks properties were introduced for evaluation of classes classified as input data in the algorithm. Based on the experienced technicians’ suggestions, in the next step, the classification of 2, 3 and 4 classes are analyzed and investigated using the software. According to the obtained results, the most proper classification is obtained for the fourth class. The obtained results from the ternary classification are shown in Tables 3 and 4 for the minimum acceptable error and the amount of optimization of each data in the class, respectively.
Table 3. Precision level and calculation termination in 300th iteration.
Result ( )n (n1)
L U U
( )n
U
(n1) U
Step (n) Continue 0.0541 > 0.00001 107.1023 107.0482 185
Continue 0 < 0.00001 107.0482 107.0482 186
Stop 0 < 0.00001 107.0482 107.0482 300
Based on the results of Table 3, the algorithm reached the most acceptable possible error in the 185th iteration and this value remained constant by the end of iterations. In fact, the convergence obtained in the 185th iteration remains constant until the 300th iteration, indicating the ability of this algorithm in the fast convergence and its stability. Furthermore, the process of convergence is shown in Fig. 3.
Fig. 3. The minimum cost per iteration by ABC algorithm.
Based on the results obtained from Table 3, 14 rocks were classified by ABC algorithm in 4 classes as 6 samples in the first class, 4 samples in the second class, three sample in the third one and 1 sample in the fourth class. We carried out an optimized classification of 38 different dimension (decorative) stones in 4 separate clusters, according to four important parameters such uniaxial compressive strength (UCS), Schimazek abrasivity factor (SF-a), Mohs hardness (Mh), and Young’s modulus (Ym). Also applying the meta-heuristic algorithm made it possible to evaluate the cutting performance of diamond saw with various operating parameters. More discussions can be obtained in the area of validation of results obtained from this data classification process.
5.
Discussion
In this section, the result of ABC were verified by ampere consumption and wear rate of circular diamond saw. Therefore, the following four main steps were performed.
Step 1. Preparing the fully-instrumented laboratory cutting rig Step 2. Monitoring and calculating the ampere consumption during the sawing tests
Step 3. Calculating the average wear rate of diamond saw from loss of width, length and height
Step 4. Comparing ABC results and cutting performance (ampere consumption and wear rate of circular diamond saw).
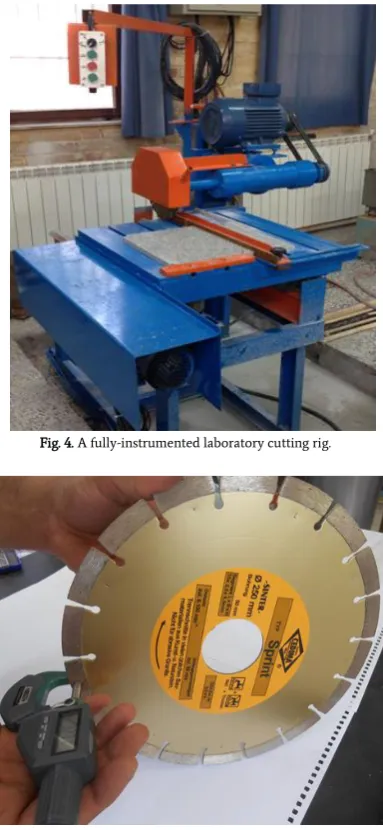
To perform the cutting tests, a fully-instrumented laboratory sawing rig was prepared (Fig. 4). It consisted of 3 major sub-systems, i.e., a sawing unit, instrumentation, and a personal computer. A small side-sawing machine with a maximum spindle motor power of 4 kW was employed to conduct the sawing tests. Cutting parameters included feed rate, cut depth, and controlling the peripheral speed in the monitoring system.
In this study, a circular diamond saw of a 250-mm diameter, and a steel core of 50-mm thickness were utilized. Eighteen pieces of impregnated diamond segments with a size of 35 mm×2.5 mm×6.0 mm were brazed to the periphery of a circular steel core, which had a standard narrow radial slot. Two different saws were applied to 14 rock types in this study. The diamond had a grit size of about 50/60 US mesh at concentration 35. Ampere consumption and wear rate of diamond saw were selected as criteria to evaluate the result of ABC algorithm. Ampere consumption was determined during the cutting process using a digital ampere meter. The average wear rate of diamond saw was calculated from loss of width, length and height using a digital micrometer (Fig. 5). The ABC result and cutting performance parameters such as wear rate of circular diamond saw and ampere consumption are given in Table 5.
Fig. 4. A fully-instrumented laboratory cutting rig.
Fig. 5. A digital micrometer to determine the wear rate.
Table 5. The ABC result and cutting performance parameters.
Classification Cutting performance
Rock
Samples Wr (mm3) I (A)
First Class 15.5
4.50E-07 A1
15.4 8.00E-07 A3
15.7 5.00E-06 A5
15.6 2.50E-06 A6
15.7 3.00E-06 A10
15.6 1.60E-06 A14
Second Class 16.1
1.56E-06 A4
16.2 1.50E-06 A7
16.6 1.00E-06 A9
15.8 2.20E-06 A11
Third Class 15.2
5.00E-07 A2
15.4 6.00E-07 A12
15.5 4.00E-07 A13
Fourth Class 17
7.20E-06 A8
to 15.7 A. However, the wear rates of diamond saw for sample 1 and 3 did not match this class. Similarly, samples 4, 7, 9 and 11 were classified in the second class with medium both wear rate (with a range of 1E-6 to 3E-6 mm3) and ampere consumption (with a range of 15.8 to 16.6 A). The
third class has a good performance of cutting with the lowest wear rate and ampere consumption. Sample 8 with a high value of wear rate and ampere consumption has been classified in fourth class. This sample had a very poor cutting performance. Based on experts comments, the classification accuracy in proposed method is about 92.85% (only 1 fault in 14 samples). In order to compare the results with other methods, based on our best knowledge, no research paper was found on this topic but a similar work, [1] has reported a maximum accuracy of about 84.6% in its classification. This means that metaheuristic method is better than mathematical and theoretical classification in this topic.
6.
Conclusion
In this study, the application of metaheuristic algorithm was studied to evaluate the performance of circular diamond saw in hard rocks sawing process. A total of fourteen types of hard rocks were analyzed at a constant operation condition in laboratory. Artificial bee colony (ABC) was used to classify the performance of circular diamond saw based on four major mechanical properties of rocks such as uniaxial compressive strength (UCS), Schmiazek abrasivity factor (SF-a), Mohs hardness (Mh), and Young’s modulus (Ym). Studied rocks were classified into four classes. Validation of applied metaheuristic algorithm was conducted by comparing the class of each rock with wear rate and ampere consumption. The results of comparison between ABC results and ampere consumption and wear rate of diamond saw showed that the ABC algorithm is properly capable to evaluate the cutting performance only by testing the mechanical properties. For future studies, it is recommended to use other optimization techniques including a combination of Artificial Neural Network and Imperialist Competitive Algorithm (ANN-ICA), Differential Evolution (DE), Genetic Algorithm (GA) for more effectively sensitivity analysis. It leads to the fact that we can overcome complex problems by using these new approaches as the appropriate solution.
Acknowledgments
The authors gratefully acknowledge the supports of the Shahrood University of Technology, Department of Mining, Petroleum and Geophysics for providing the laboratory equipment (Rock mechanics specially).
REFRENCES
[1] Almasi, S. N., et al. (2017). Developing a new rock classification based on the abrasiveness, hardness, and toughness of rocks and PA for the prediction of hard dimension stone sawability in quarrying. Geosystem Engineering, 1-16. DOI: http://dx.doi.org/10.1080/12269328.2017.1278727.
[2] Buyuksagis, I. S. (2007). Effect of cutting mode on the sawability of granites using segmented circular diamond sawblade. Journal of Materials Processing Technology 183(2), 399-406. Doi: org/10.1016/j.jmatprotec.2006.10.034.
[3] Fener, M., Kahraman, S., & Ozder, M. O. (2007). Performance prediction of circular diamond saws from mechanical rock properties in cutting carbonate rocks. Rock Mechanics and Rock Engineering 40(5), 505-517. Doi: 10.1007/s00603-006-0110-y. [4] Tutmez, B., Kahraman, S., & Gunaydin, O. (2007). Multifactorial
fuzzy approach to the sawability classification of building stones. Construction and Building Materials 21(8), 1672-1679. Doi:org/10.1016/j.conbuildmat.2006.05.023.
[5] Atici, U., Ersoy, A. (2009). Correlation of specific energy of cutting
saws and drilling bits with rock brittleness and destruction energy. Journal of Materials Processing Technology 209(5), 2602-2612. Doi: org/10.1016/j.jmatprotec.2008.06.004.
[6] Mikaeil, R., Ozcelik, Y., Ataei, M., & Yousefi, R. (2011). Correlation of specific ampere draw with rock brittleness indexes in rock sawing process. Archives of Mining Sciences 56 (4), 777–788. [7] Mikaeil, R., Yousefi, R., Ataei, M., & Farani, R. A. (2011).
Development of a new classification system for assessing of carbonate rock sawability. Archives of Mining Sciences 56(1), 59-70.
[8] Mikaeil, R., Ataei, M., & Yousefi, R. (2011). Application of a fuzzy analytical hierarchy process to the prediction of vibration during rock sawing. Mining Science and Technology (China) 21(5), 611-619. DOI: 10.1016/j.mstc.2011.03.008.
[9] Güney, A. (2011). Performance prediction of large-diameter circular saws based on surface hardness tests for Mugla (Turkey) marbles. Rock Mechanics and Rock Engineering 44(3), 357-366. Doi: 10.1007/s00603-010-0119-0.
[10] Mikaeil, R., Yousefi, R., & Ataei, M. (2011). Sawability ranking of carbonate rock using fuzzy analytical hierarchy process and TOPSIS approaches. Scientia Iranica 18(5), 1106-1115. Doi: org/10.1016/j.scient.2011.09.009.
[11] Mikaeil, R., Ataei, M., & Yousefi, R. (2011). Evaluating the Power Consumption in Carbonate Rock Sawing Process by Using FDAHP and TOPSIS Techniques. Efficient Decision Support Systems: Practice and Challenges – From Current to Future / Book 2", ISBN 978-953-307-441-2., pp 478.
[12] Ataei, M., Mikaeil, R., Hoseinie, S. H., & Hosseini, S. M. (2012). Fuzzy analytical hierarchy process approach for ranking the sawability of carbonate rock. International Journal of Rock Mechanics and Mining Sciences 50, 83-93. Doi: org/10.1016/j.ijrmms.2011.12.002.
[13] Yurdakul, M., & Akdas, H. (2012). Prediction of specific cutting energy for large diameter circular saws during natural stone cutting. International Journal of Rock Mechanics and Mining Sciences 53, 38-44. Doi: org/10.1016/j.ijrmms.2012.03.008. [14] Yaşıtlı, N. E., Bayram, F.,. Unver, B., & Özçelik, Y. (2012). Numerical
modelling of circular sawing system using discrete element method. International Journal of Rock Mechanics and Mining Sciences 55, 86-96. DOI: 10.1016/j.ijrmms.2012.06.006.
[15] Bilim, N. (2012). Optimum cutting speed of block-cutting machines in natural stones for energy saving. Journal of Central South University 19(5), 1234-1239. DOI: 10.1007/s11771-012-1134-y. [16] Winkler, E. M. (2013). Stone: properties, durability in man’s
environment, (Vol. 4). Springer Science & Business Media. Doi: 10.1007/978-3-7091-4120-5.
[17] Karakurt, I., Aydin, G., & Aydiner, K. (2013). Predictive modelling of noise level generated during sawing of rocks by circular diamond sawblades. Sadhana 38(3), 491-511. DOI: 10.1007/s12046-013-0117-5.
[18] Mikaeil, R., Ozcelik, Y., Yousefi, R,. Ataei, M,. & Hosseini, S. M. (2013). Ranking the sawability of ornamental stone using Fuzzy Delphi and multi-criteria decision-making techniques. International Journal of Rock Mechanics and Mining Sciences 58: 118-126. Doi: org/10.1016/j.ijrmms.2012.09.002. [19] Engin, I. C., Bayram, F., & Yasitli, N. E. (2013). Experimental and
statistical evaluation of cutting methods in relation to specific energy and rock properties. Rock mechanics and rock engineering 46(4), 755-766. DOI: 10.1007/s00603-012-0284-4. [20] Bayram, F. (2013). Prediction of sawing performance based on
index properties of rocks. Arabian Journal of Geosciences 6(11), 4357-4362. DOI: 10.1007/s12517-012-0668-5.
Journal of Geosciences 6(4), 1183-1190. DOI: 10.1007/s12517-011-0429-x.
[22] Aydin, G., Karakurt, I., & Aydiner, K. (2013). Wear performance of saw blades in processing of granitic rocks and development of models for wear estimation. Rock mechanics and rock engineering 46(6), 1559-1575. DOI: 10.1007/s00603-013-0382-y. [23] Karakurt, I. (2014). Application of Taguchi method for cutting
force optimization in rock sawing by circular diamond sawblades. Sadhana 39(5), 1055-1070. DOI: 10.1007/s12046-014-0279-9.
[24] Mikaeil, R., Ataei, M., Ghadernejad, S., & Sadegheslam, G. (2014). Predicting the relationship between system vibration with rock brittleness indexes in rock sawing process. Archives of Mining Sciences 59(1), 139-153. Doi: org/10.2478/amsc-2014-0010. [25] Karakurt, I. (2014). Specific energy optimization in sawing of rocks
using Taguchi approach. Journal of Central South University 21(1), 365-372. DOI: 10.1007/s11771-014-1949-9. [26] Aydin, G., Karakurt, I., & Hamzacebi, C. (2015). Performance
prediction of diamond sawblades using artificial neural network and regression analysis. Arabian Journal for Science and Engineering 40(7), 2003-2012. DOI: 10.1007/s13369-015-1589-x. [27] Tumac, D. (2015). Predicting the performance of large diameter
circular saws based on schmidt hammer and other properties for some Turkish carbonate rocks. International Journal of Rock Mechanics and Mining Sciences 75, 159-168. Doi: org/10.1016/j.ijrmms.2015.01.015.
[28] Mikaeil, R., Abdollahi Kamran, M., Sadegheslam, G., & Ataei, M. (2015). Ranking sawability of dimension stone using PROMETHEE method. Journal of Mining and Environment 6(2), 263-271. Doi: 10.22044/jme.2015.477.
[29] Mikaeil, R., Haghshenas, S. S., Haghshenas S. S., & Ataei, M. (2016). Performance prediction of circular saw machine using imperialist competitive algorithm and fuzzy clustering technique. Neural Computing and Applications, 1-10. Doi: 10.1007/s00521-016-2557-4.
[30] Aryafar, A., & Mikaeil, R. (2016). Estimation of the amper consumption of dimension stone sawing machine using the artificial neural networks. Int. J. Min & Geo – Eng 50: 121-130. Doi: 10.22059/ijmge.2016.57861.
[31] Almasi, S. N., et al. (2017). Predicting the Building Stone Cutting Rate Based on Rock Properties and Device Pullback Amperage in Quarries Using M5P Model Tree. Geotechnical and Geological Engineerin, 1-16. DOI: 10.1007/s10706-017-0177-0.
[32] Mikaeil, R., Haghshenas, S. S., Shirvand, Y., Hasanluy, M. V., & Roshanaei, V. (2016). Risk Assessment of Geological Hazards in a Tunneling Project Using Harmony Search Algorithm (Case Study: Ardabil-Mianeh Railway Tunnel). Civil Engineering Journal 2(10), 546-554. DOI: orcid.org/0000-0001-8404-3216. [33] Mikaeil, R., Ozcelik, Y., Ataei, M., & Shaffiee Haghshenas, S. (2016).
Application of harmony search algorithm to evaluate performance of diamond wire saw. Journal of Mining and Environment. DOI: 10.22044/jme.2016.723.
[34] Haghshenas, S. S., Haghshenas, S. S., Barmal, M., & Farzan, N. (2016). Utilization of Soft Computing for Risk Assessment of a Tunneling Project Using Geological Units. Civil Engineering Journal, 2(7), 358-364.
[35] Kang, F., Li, J., & Xu, Q. (2009). Structural inverse analysis by hybrid simplex artificial bee colony algorithms. Computers and Structures 87: 861–870. DOI:10.1016/j.compstruc.2009.03.001. [36] Sonmez, M. (2011). Articial Bee Colony algorithm for optimization
of truss structures. Applied Soft Computing 11, 2406–2418. DOI:10.1016/j.asoc.2010.09.003.
[37] Karaboga, D. (2005). An idea based on honey bee swarm for numerical optimization, Technical Report-TR06. Erciyes University, Engineering Faculty, Computer Engineering Department.
[38] Dell’Orco, M., Başkan, Ö., & Marinelli, M. (2014). Artificial Bee Colony-based algorithm for optimizing traffic signal timings. In Soft Computing in Industrial Applications. Springer International Publishing: 327-337. DOI: 10.1007/978-3-319-00930-8_29. [39] Zhang, S., Lee, C. K. M., Choy, K. L., Ho, W., & Ip, W. H. (2014).
Design and development of a hybrid artificial bee colony algorithm for the environmental vehicle routing problem. Transportation Research Part D: Transport and Environment 31, 85-99. DOI:10.1016/j.trd.2014.05.015.
[40] Ozturk, C., Hancer, E., & Karaboga, D. (2015). Improved clustering criterion for image clustering with artificial bee colony algorithm. Pattern Analysis and Applications 18(3), 587-599. DOI:10.1007/s10044-014-0365-y.
[41] Ersoy, A., Buyuksagis, S., & Atici, U., (2005). Wear characteristics of circular diamond saws in the cutting of different hard and abrasive rocks. Wear 258, 1422–1436. Doi: org/10.1016/j.wear.2004.09.060.
[42] Tonshoff, H.K., Hillmann-Apmann, H., & Asche, J. (2002). Diamond tools in stone and civil engineering industry: cutting principles. wear and applications, Diamond and Related Materials 11, 736–741. Doi: org/10.1016/S0925-9635(01)00561-1.
[43] ISRM. ISRM suggested methods. In: Brown ET, editor. Rock characterization testing and monitoring. Oxford: Pergamon; 1981. [44] Kahraman, S., Altun, H., Tezekici, B. S., & Fener, M. (2006). Sawability prediction of carbonate rocks from shear strength parameters using artificial neural networks. International Journal of Rock Mechanics and Mining Sciences 43(1)
:
157-164. DOI: 10.1016/j.ijrmms.2005.04.007.[45] Stuart, P. (1982). Lloyd. Least squares quantization in pcm. IEEE Transactions on Information Theory 28, 129-137. Doi: 10.1109/TIT.1982.1056489.