AUT J. Mech. Eng., 3(2) (2019) 205-216 DOI: 10.22060/ajme.2019.14992.5755
Multi-objective optimization of the structure of triangular chevron channels
H. Dolatabadi, A. Hajizadeh Aghdam*Department of Mechanical Engineering, Arak University of Technology, Arak, Iran
ABSTRACT: Chevron channels are one of the popular techniques that are extensively used in different heat exchangers such as plate heat exchangers and solar air heaters. Numerical studies were carried out on turbulent heat transfer and friction factor loss through a triangular chevron channel for a uniform wall heat flux 3000 W/m2 using air as a working fluid. The results of the average Nusselt number, friction factor and thermal enhancement factor in different phase shifts (ϕ) are presented. Reynolds number were varied from 10000 to 30000 and horizontal moving of the plates were horizontally moved with regards to each other (phase shift) at the range of 0° ≤ϕ≤180° whereas, distance between chevron surfaces was constant (D=5 mm). The channels with phase shift angle of ϕ = 18.28º, are the most attractive from the viewpoint of energy saving. The genetic algorithm optimization using non-dominated sorting genetic algorithm II showed that with increasing Reynolds number, Nusselt number increased and the thermal enhancement factor decreased. It also proved that ϕ=18.28º was the optimum phase shift. The results also indicated that the triangular chevron channels with (Dv=7.43mm) have maximum Nusselt number and thermal enhancement factor and minimum friction factor.
Review History:
Received: 23 September 2018 Revised: 25 December 2018 Accepted: 3 February 2019 Available Online: 11 March 2019
Keywords:
Heat transfer Pressure drop
Thermal enhancement factor Genetic algorithm
205
1- Introduction
The flow and heat transfer in chevron channels have been extensively investigated in recent years. Using chevron surfaces for hot plate is a scientific way to increase thermal performance. Chevron surfaces make laminar sub-layer of turbulent flows. As a result heat transfer increases. When friction factor increases, the fan power will increase until stable velocity of fluid flow is achieved. Todays, some company use chevron surfaces for increasing heat flux rate in nuclear reactors, turbine’s blades and electronic devices. Dellil et al. [1] conducted geometrical parametric study by changing the amplitude-to-wavelength ratio. Comparison of results predicted for a wavy wall with that of a straight channel indicates that with increase in amplitude wave, the averaged Nusselt number (Nu) increases until a critical value is reached while. However, this heat transfer enhancement is accompanied by an increase in the pressure drop.
The characteristics of fluid flow and heat transfer in periodic fully developed region of the corrugated duct were numerically obtained using the finite element software by Islamoglu el al. [2]. Both the heat transfer coefficient and the pressure drop for the corrugated ducts were in good agreement.
Eiamsa-ard et al. [3] found the desirable modification of rib surface by reducing degree of sudden change of the main flow that results in the suppression of flow separation and thus a decrease of the corner separation bubble in front and rear surfaces of the rib. The streamlines signify that ribs with concave surfaces give unrecognized corner separation bubble while the ones with modified convex surface generate the corner separation bubble with comparable size to that of the unmodified square ribs. All ribs with concave surfaces induce larger recirculation zone resulting in ahigh turbulence
intensity. With good conformation of the streamlines, the rib with concave-concave surfaces gives the highest Nusselt number and friction factor while the one with convex-concave surface provides the lowest friction factor with moderate Nusselt number. Due to the prominent effect of its low friction factor, the rib with convex-concave surface offers the highest Thermal Enhancement Factor (TEF) with maximum value of 1.19.
Xie et al. [4] studied flow structure and heat transfer in a square passage with offset mid-truncated ribs. The heated surface of 135º V-shaped mid-truncated ribs provided the highest heat transfer enhancement. While the heated surface of 90º mid-truncated ribs with no staggered arrangement behaved best in reducing the pressure loss penalty.
Moon et al. [5] proved the new boot-shaped rib gives the best heat transfer performance with an average friction loss performance, and the reverse pentagonal rib gives the best friction loss performance.
Al-Shamani et al. [6] investigated the effect of rib groove shape on thermal and fluid fields. Results show that Trapezoidal with increasing height in the flow direction Rib-Isosceles Trapezoidal Groove (Trap+R-TrapG) gives the highest Nusselt number in comparison with other types of Trapezoidal channel. They also studied the effect of nano particle type, (Al2O3, CuO, SiO2, and ZnO). Results show that SiO2 gives the highest Nusselt number followed by Al2O3, ZnO, and CuO respectively while pure water gives the lowest value of Nusselt number. The Nusselt number increased with increasing the volume fraction of nanoparticles. The Nusselt number increases gradually when decreasing the nano particles diameter. Results also revealed that the Nusselt number increased gradually by increasing the Reynolds number, Re in the range of 10000–40000.
Khoshvaght-Aliabadi et al. [7] found that a significant
H. Dolatabadi and A. Hajizadeh Aghdam, AUT J. Mech. Eng., 3(2) (2019) 205-216, DOI: 10.22060/ajme.2019.14992.5755
improvement in the heat transfer coefficient is achieved using the pure water compared to the water–ethylene glycol mixtures.
However there is a lack of research and information for optimized shape considering both maximum Nu and minimum friction factor. Present study focuses on the optimized triangular chevron channel and phase shift angle with best thermal enhancement factor.
2- Physical Model
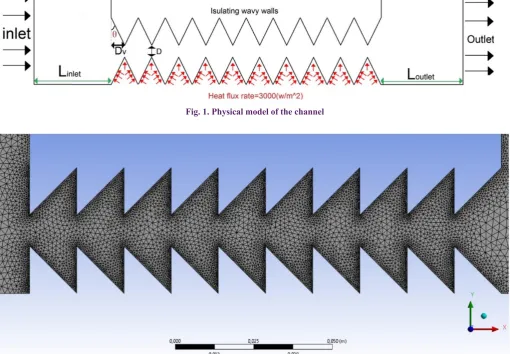
Fig.1 illustrates physical model of the channel. The physical properties of air have been assumed to remain constant at average bulk temperature. Impermeable boundary and no-slip wall conditions have been assumed over the channel walls as well as the chevron surfaces.
The distance between the apexes of the triangle with the vertical axis coordinates (Dv) is the optimization parameters. The length of channel before test section Linlet is 30 cm and length of channel after test section Loutlet is 25 cm and length of test section is (Ltest section) is 15 cm and both height and length of ribs are 15 mm. The next step is entering boundary condition where heat flux rate of heater is 3000 (W/m2) and
other wall is considered insulated. Also the initial temperature of the working fluid (air) was kept constant at 298.15 K. Fig. 2 shows mesh element of triangular chevron channel, the grid
size of mesh element near the wall is smaller than where they located away from the walls.
The following assumptions are applied in the simulations: the flow is steady, the flow is fully developed and turbulent, the thermal conductivity of the channel wall and material chevron does not change with temperature, and the channel wall and material of the chevron walls are homogeneous and isotropic with enhanced wall treatment function.
A grid independence test was performed for the channel with chevron wall using air as a working fluid to analyze the effect of grid sizes on the results as shown in Fig. 3. It is found that the further increase of element beyond 22978 cells results in variation in Nusselt number less than 1%. Thus, this element number is taken as criterion for grid independence. This fine mesh size will be able to provide good spatial resolution for the distribution of most variables within the channel. The grids were concentrated at the chevron wall region to resolve the high velocity gradient near the wall.
Fig. 4 shows evaluation of how much valid the present simulation is. In this figure, Nusselt number vs Reynolds number has been compared with reported results by sakr [8]. Distance between chevron surfaces is D=17.5 mm.
As can be seen from Fig. 1, the maximum difference between present work and sakr [8] is less than 1.7% which proves the validity of the current simulation.
Fig. 1. Physical model of the channel
207
3- Numerical Model
The numerical analysis of thermal behavior and flow dynamic characteristics for the chevron channel has been carried out to predict the performance of heat transfer and pressure drop. The governing equations were solved using a finite volume approach. The time-independent incompressible Navier– Stokes equations and the turbulence model were discretized using the finite volume method. Many studies predicted the turbulent forced convection in a rectangular duct with periodic chevron shapes by utilizing different turbulence models, such as the k−ε, k−ω, Reynolds stress model (k-ɛ) and Large Eddy Simulations (LES) models and they showed that k−ε model can offer more accurate results in predicting flow patterns of revolving flows [5-9]. In the present study, the k−ε model was used for the turbulence modeling, and the Semi Implicit Method for Pressure-Linked Equations (SIMPLE) algorithm was used to handle the pressure-velocity coupling. The discretized nonlinear equations were implemented implicitly. To evaluate the pressure field, the pressure–velocity coupling algorithm SIMPLE was selected. The solutions converged when the normalized residual values were less than 10−6 for all variables but less than 10−5 only for the continuity equation.
4- Mathematical Modeling
The data needed for performing the Multi-Objective Optimization (MOO) in this paper has been obtained by means of numerical modeling. The details of this procedure are described in this section.
4- 1- Performance parameters
Parameters of interest in the present work were the Reynolds number, friction factor and Nusselt number.
2 0.25 0.33 2 1 2 0.8 0.4 Re 2 1 fs=0.085R 0 e TEF= ( )
.( ) 0
( ) .024 ( ) 2 . ( ) ( ) h h x h x x t
t ij ij s t k uD D p f L u h D Nu k
Nu Nu x
L Nu Nus f fs V
div U div grad
t
C E E C
k k
k div kU div grad k
Nu R t e pr ε ε ε ρ µ ρ ρ µ ρε ρε ε σ ε µ ρε µ ρ ρ σ − = ∆ = = = ∂ ∇ = ∂ + = ∂ + − ∂ + = ∂ =
∫
2 . .( ) .( )t ij ij
P E E
VC T k T
µ ρε
ρ
+ −
∇ = ∇ ∇
(1)
where u is velocity of fluid, Dh hydraulic diameter, ρ fluid density and µ is dynamic viscosity of the fluid.
2 Dimensional simulation was performed therefore; Dh was the average diameter of the channel.
2 0.25 0.33 2 1 2 0.8 0.4 Re 2 1 fs=0.085R 0 e TEF= ( )
.( ) 0
( ) .024 ( ) 2 . ( ) ( ) h h x h x x t
t ij ij s t k uD D p f L u h D Nu k
Nu Nu x
L Nu Nus f fs V
div U div grad
t
C E E C
k k
k div kU div grad k
Nu R t e pr ε ε ε ρ µ ρ ρ µ ρε ρε ε σ ε µ ρε µ ρ ρ σ − = ∆ = = = ∂ ∇ = ∂ + = ∂ + − ∂ + = ∂ =
∫
2 . .( ) .( )t ij ij
P E E
VC T k T
µ ρε
ρ
+ −
∇ = ∇ ∇
(2)
Fig. 3. Grid independence analysis
H. Dolatabadi and A. Hajizadeh Aghdam, AUT J. Mech. Eng., 3(2) (2019) 205-216, DOI: 10.22060/ajme.2019.14992.5755
The friction factor was computed from pressure drop (ΔP)
across the length of the duct (L) where ρ is density of fluid. The local heat transfer coefficient was obtained from local Nusselt number which can be written as Eq. (3)
2 0.25 0.33 2 1 2 0.8 0.4 Re 2 1 fs=0.085R 0 e TEF= ( )
.( ) 0
( ) .024 ( ) 2 . ( ) ( ) h h x h x x t
t ij ij s t k uD D p f L u h D Nu k
Nu Nu x
L Nu Nus f fs V
div U div grad
t
C E E C
k k
k div kU div grad k
Nu R t e pr ε ε ε ρ µ ρ ρ µ ρε ρε ε σ ε µ ρε µ ρ ρ σ − = ∆ = = = ∂ ∇ = ∂ + = ∂ + − ∂ + = ∂ =
∫
2 . .( ) .( )t ij ij
P E E
VC T k T
µ ρε
ρ
+ −
∇ = ∇ ∇
(3)
where Nu is Nusselt number, k is conductivity factor and hx
is local heat transfer coefficient. The average Nusselt number can be obtained by Eq. (4)
2 0.25 0.33 2 1 2 0.8 0.4 Re 2 1 fs=0.085R 0 e TEF= ( )
.( ) 0
( ) .024 ( ) 2 . ( ) ( ) h h x h x x t
t ij ij s t k uD D p f L u h D Nu k
Nu Nu x
L Nu Nus f fs V
div U div grad
t
C E E C
k k
k div kU div grad k
Nu R t e pr ε ε ε ρ µ ρ ρ µ ρε ρε ε σ ε µ ρε µ ρ ρ σ − = ∆ = = = ∂ ∇ = ∂ + = ∂ + − ∂ + = ∂ =
∫
2 . .( ) .( )t ij ij
P E E
VC T k T
µ ρε ρ + − ∇ = ∇ ∇ (4) 2 0.25 0.33 2 1 2 0.8 0.4 Re 2 1 fs=0.085R 0 e TEF= ( )
.( ) 0
( ) .024 ( ) 2 . ( ) ( ) h h x h x x t
t ij ij s t k uD D p f L u h D Nu k
Nu Nu x
L Nu Nus f fs V
div U div grad
t
C E E C
k k
k div kU div grad k
Nu R t e pr ε ε ε ρ µ ρ ρ µ ρε ρε ε σ ε µ ρε µ ρ ρ σ − = ∆ = = = ∂ ∇ = ∂ + = ∂ + − ∂ + = ∂ =
∫
2 . .( ) .( )t ij ij
P E E
VC T k T
µ ρε ρ + − ∇ = ∇ ∇ (5) 2 0.25 0.33 2 1 2 0.8 0.4 Re 2 1 fs=0.085R 0 e TEF= ( )
.( ) 0
( ) .024 ( ) 2 . ( ) ( ) h h x h x x t
t ij ij s t k uD D p f L u h D Nu k
Nu Nu x
L Nu Nus f fs V
div U div grad
t
C E E C
k k
k div kU div grad k
Nu R t e pr ε ε ε ρ µ ρ ρ µ ρε ρε ε σ ε µ ρε µ ρ ρ σ − = ∆ = = = ∂ ∇ = ∂ + = ∂ + − ∂ + = ∂ =
∫
2 . .( ) .( )t ij ij
P E E
VC T k T
µ ρε
ρ
+ −
∇ = ∇ ∇
(6) And Nus and fs stand for Nusselt number and friction factor for the smooth duct, respectively. And thermal efficiency factor is defined as presented in Eq. (7)
2 0.25 0.33 2 1 2 0.8 0.4 Re 2 1 fs=0.085R 0 e TEF= ( )
.( ) 0
( ) .024 ( ) 2 . ( ) ( ) h h x h x x t
t ij ij s t k uD D p f L u h D Nu k
Nu Nu x
L Nu Nus f fs V
div U div grad
t
C E E C
k k
k div kU div grad k
Nu R t e pr ε ε ε ρ µ ρ ρ µ ρε ρε ε σ ε µ ρε µ ρ ρ σ − = ∆ = = = ∂ ∇ = ∂ + = ∂ + − ∂ + = ∂ =
∫
2 . .( ) .( )t ij ij
P E E
VC T k T
µ ρε
ρ
+ −
∇ = ∇ ∇
(7)
4- 2- Governing equations
In this paper, the geometry of the chevron surfaces varied in the way that the fluid flow throughout the optimization process would remain continuous and the governing equations would constitute the continuity, Navier-Stokes and energy equations as presented in Eqs. (8) to (10)
• Continuity equation:
2 0.25 0.33 2 1 2 0.8 0.4 Re 2 1 fs=0.085R 0 e TEF= ( )
.( ) 0
( ) .024 ( ) 2 . ( ) ( ) h h x h x x t
t ij ij s t k uD D p f L u h D Nu k
Nu Nu x
L Nu Nus f fs V
div U div grad
t
C E E C
k k
k div kU div grad k
Nu R t e pr ε ε ε ρ µ ρ ρ µ ρε ρε ε σ ε µ ρε µ ρ ρ σ − = ∆ = = = ∂ ∇ = ∂ + = ∂ + − ∂ + = ∂ =
∫
2 . .( ) .( )t ij ij
P E E
VC T k T
µ ρε
ρ
+ −
∇ = ∇ ∇
(8)
• Momentum equation including k-ε equations:
2 0.25 0.33 2 1 2 0.8 0.4 Re 2 1 fs=0.085R 0 e TEF= ( )
.( ) 0
( ) .024 ( ) 2 . ( ) ( ) h h x h x x t
t ij ij s t k uD D p f L u h D Nu k
Nu Nu x
L Nu Nus f fs V
div U div grad
t
C E E C
k k
k div kU div grad k
Nu R t e pr ε ε ε ρ µ ρ ρ µ ρε ρε ε σ ε µ ρε µ ρ ρ σ − = ∆ = = = ∂ ∇ = ∂ + = ∂ + − ∂ + = ∂ =
∫
2 . .( ) .( )t ij ij
P E E
VC T k T
µ ρε
ρ
+ −
∇ = ∇ ∇
(9)
Where U represents velocity component in the corresponding direction, Eij represents component of rate of deformation,
µt represents eddy viscosity and σk, σε, C1ε, C2ε are some adjustable constants.
• Energy equation:
2 0.25 0.33 2 1 2 0.8 0.4 Re 2 1 fs=0.085R 0 e TEF= ( )
.( ) 0
( ) .024 ( ) 2 . ( ) ( ) h h x h x x t
t ij ij s t k uD D p f L u h D Nu k
Nu Nu x
L Nu Nus f fs V
div U div grad
t
C E E C
k k
k div kU div grad k
Nu R t e pr ε ε ε ρ µ ρ ρ µ ρε ρε ε σ ε µ ρε µ ρ ρ σ − = ∆ = = = ∂ ∇ = ∂ + = ∂ + − ∂ + = ∂ =
∫
2 . .( ) .( )t ij ij
P E E
VC T k T
µ ρε
ρ
+ −
∇ = ∇ ∇ (10)
5- Genetic Algorithm (GA)
Genetic Algorithm is an optimization method based on the mechanics of natural genetics and natural selection. Genetic Algorithm mimics the principle of natural genetics and natural selection to constitute search and optimization procedures. GA is used for scheduling to find the near to optimum solution in a short time. In a genetic algorithm representation is done with variable length of sub-chromosome. GA is developed to generate the optimal order scheduling solution. GA is used as tool in different processes to optimize the process parameters. This paper reviews the genetic algorithms that are designed for solving multiple problems in applications of material science and manufacturing in field of mechanical engineering. Genetic algorithm is a multi-path algorithm that searches many peaks in parallel, hence reducing the possibility of local minimum trapping and solve the multi-objective optimization problems. Bejan and Sciubba [10] applied the asymptotic method to determine the optimum geometry of a stack of parallel plates cooled by forced fluid flow. They demonstrated that the thermal conditions of channel walls, with the temperature or flux being constant, don’t make much of a difference in the final results. They used a single-objective optimization, and their goal was to increase the amount of heat transfer in the stack of plates. By combining numerical, analytical and experimental studies and employing the asymptotic analysis method. To achieve the optimal thermal behaviors in the channels, a multi-objective optimization approach should be used to discover the best possible design points with maximum heat transfer and minimum pumping power. Non-dominated Sorting Genetic Algorithm-II (NSGAII) is one of the best and most complete multi-objective optimization algorithms, which was used in this paper as well.
6- Result and Discussion
6- 1- Effect of the geometry
Multi-objective optimization using NSGA II algorithms was employed. The two conflicting objective functions were Nusselt number (Nu) and friction factor (f) that should be optimized simultaneously for 0 ≤ Dv ≤ 15mm (distance from vertical coordinate) .The vertical distance between chevron surfaces (D) was kept constant (D=5 mm). The optimized values were achieved by two main targets: 1-minimum pressure drop and friction factor, 2- maximum Nu and heat transfer coefficient (Table 1).
209
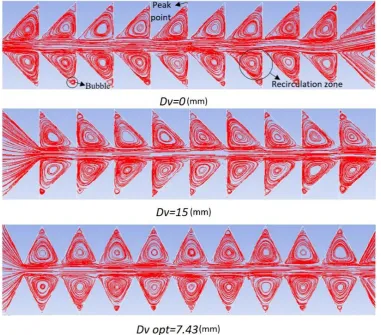
Fig. 5. The geometry of the optimized set with other geometries
Dv [mm] Angle of tilt D [mm] f h [W/(m2K)] Nu ΔP(Pa) Nu
s Nu/Nus fs (f/fs)(0.33)
Near zero 0˚ 5 0.54 32.08 40.8 939.44 26.24 1.74 0.03 2.71
7.43 mm 26.35˚ 5 0.59 46.07 58.6 824.86 26.24 2.31 0.03 2.66
8.62 mm 29.88˚ 5 0.64 49.83 63.4 847.51 26.24 2.42 0.03 2.71
10.72 mm 35.55 5 0.6 47.59 60.56 821.12 26.23 2.23 0.03 2.64
15 mm 45˚ 5 0.63 35.9 45.66 798.25 26.24 1.56 0.03 2.56
Table 3. Optimized values for triangular chevron channel
H. Dolatabadi and A. Hajizadeh Aghdam, AUT J. Mech. Eng., 3(2) (2019) 205-216, DOI: 10.22060/ajme.2019.14992.5755
Moreover, there was a big difference between minimum and maximum local friction factor (f) on the chevron walls. In general, the value of f at the separation point was extremely low and the value of f at the bottom of triangular shape was extremely high because there were vortexes in these locations. Fig. 8 shows the streamlines associated by modified various geometries at Re = 10000.
Focusing on the upstream flow structures for various triangular
shapes the decrease of flow separation can be observed. Hence, the volume of bubble increased and consequently heat transfer decreased. Eventually, the optimized set obtained from genetic algorithm (Dvoptimized=7.43 mm) induced larger recirculation zones which provided higher turbulent intensity than the others. This might be related to disruption of the laminar sub-layer leading to the maximum heat transfer for optimized set.
Fig. 7. Variation of local friction factor along the lower triangular chevron wall
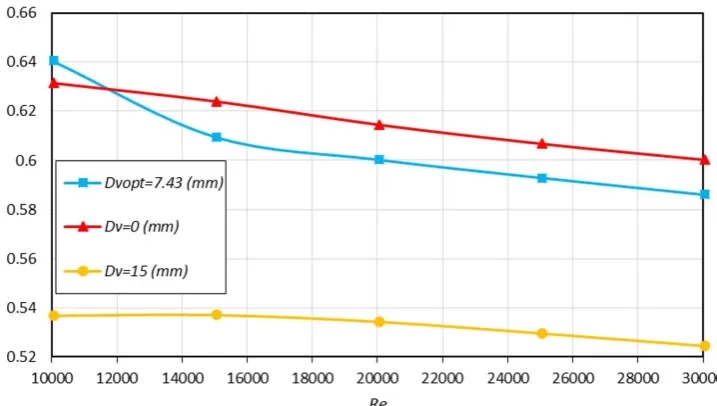
211 Fig. 9 shows the variation of Nusselt number with increasing Reynolds number for various triangular chevron channels. Since Nusselt number increases with increasing Reynolds number, the maximum Nusselt number was obtained at the highest Reynolds number (Re=30000) for all shapes. It provides a periodic redevelopment of the boundary layers and causes more effective heat transfer. In fact, thermal boundary layers for grooved flow became thinner than the case of the triangular chevron surfaces, where secondary vortices inside the optimized triangular chevron surface contributed to the enhancement of the heat transfer. The higher Nu for Dv=0 mm in comparison with Dv=15 mm can be attributed to the larger recirculation zone and bubbles which cause disruption of the laminar sub-layer and making it possible to have higher
Nu.
Fig. 10 shows friction factor versus Reynolds for all geometries. It can be observed that friction coefficient
decreases gradually with increasing Reynolds number for chevron surfaces because of increasing pressure drop. Based on the same pumping power consumption, the TEF
is shown and compared with various tested shape chevron surfaces in Fig. 11. These types of plots may be helpful to choose the working range in order to provide the best TEF. When considering the heat transfer and the pressure drop simultaneously at constant pumping power, the working conditions should incline to high TEF.
It is seen from Fig. 11 that for all cases the thermal efficiency factor tends to decrease as Re increases. The present optimized set of chevron surface consistently possesses higher thermal efficiency factor, TEF in comparison with other sets illustrated in the figure, thus the optimized shape plays an important role as transferring more heat by conduction and providing more fluid mix.
Fig. 9. Variation of Nusselt number with Reynolds number for various triangular channels
H. Dolatabadi and A. Hajizadeh Aghdam, AUT J. Mech. Eng., 3(2) (2019) 205-216, DOI: 10.22060/ajme.2019.14992.5755
6- 2- Effect of the phase shift angle for optimized geometry
The effect of the phase shift in the range of 0º<ϕ<180º for optimized geometry with Dv=7.43 mm and D=5 mm is described in this section (Fig. 13). Optimum phase shift was ϕ=0º, because it creates the maximum of Nu/Nu0 coefficient and minimum (f/f0)(1/3) for this phase difference.
Fig. 12 shows optimized phase difference and also phase differences of 0º, 90º,180º for the optimized geometry with
Dv=7.43 mm and D=5 mm.
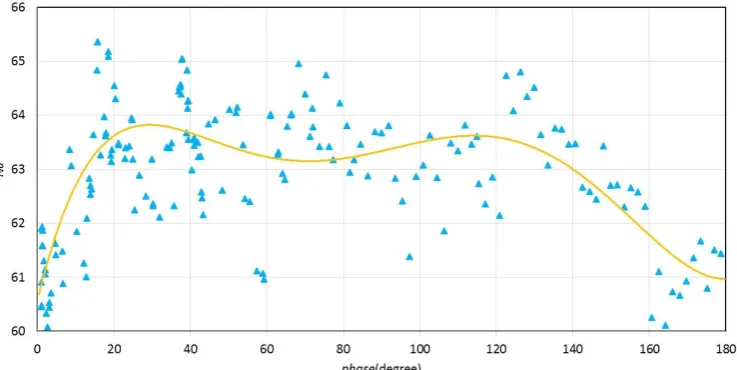
Fig. 13 shows the effect of phase shift angle on the average Nusselt number with q"= 3000 W/m2. After optimization, it is
obvious that optimized phase angles were around the highest
Nu numbers. Optimum point (ϕ =18.28º) can be found with the maximum Nu number in Fig. 13.
The friction factor is another important parameter to be considered in design of heat exchangers. The variation of the friction factor vs Reynolds number for phase shift at triangular
chevron surfaces is shown in Fig. 14. It can be seen that the friction factor increases with an increase of the phase shift, because the triangular chevron channel surface produces drag forces exerted on the flow field and also produces turbulence augmentation and rotational flow leading to fluid trap between the triangular chevron surfaces. Three sets earned from optimization with ϕ =18.28º had the lowest friction. A higher value for a desirable factor means that more heat transfer is obtained with the same pumping power and same heat transfer area. These two parameters were used to detect the area of the feasibility factor for flow in such channels. It is clear from these figures that TEF increases with the decrease of the phase shift. It was found that the maximum values of performance were obtained by using the channel phase shift ϕ=18.28º. This indicated that. ϕ=18.28º is the most attractive phase shift angle of energy saving. The TEF of these chevron channels is depicted in Fig. 15 versus phase shift angle.
Fig. 11. Variation of friction factor with Reynolds number for various triangular channels
213 Table 2 shows the optimized point which earned from optimization and compares it with phase differences 0º, 90º, 180º where point ϕ=18.28º was chosen as the optimized point Fig. 16 shows the streamlines associated by modified various phase shift at Reynolds number of 10000. Focusing on the
upstream flow structures of various triangular shapes, it can be observed that decreasing of flow separation and hence the size of bubble, makes an increase in volume of bubble and therefore it results a decrease in heat transfer.
Fig. 13. Effect of phase shift angle on the average Nusselt number
Fig. 14. Effect of phase shift angle on the friction factor
H. Dolatabadi and A. Hajizadeh Aghdam, AUT J. Mech. Eng., 3(2) (2019) 205-216, DOI: 10.22060/ajme.2019.14992.5755
Eventually, the optimized set obtained from genetic algorithm would induce larger recirculation zones providing a higher turbulent intensity. This may be related to a decrease in laminar sub-layer and having maximum heat transfer for the optimized set. While phase differences close to optimized point would create more vortex and decrease bubble from triangular chevron surfaces. When phase shift angle increases friction factor increases too, because fluid is frequenting between chevron surfaces.
The calculated average surface Nusselt number versus Reynolds number for triangular chevron surfaces is plotted in Fig. 17. This figure shows that the Nusselt number increases with increasing Reynolds number.
Also it should be noticed that the Nusselt number for optimized phase shift is higher than that for other values of phase shift. The percentage of heat transfer enhancement increased with approaching the optimized phase shift angle. The higher fluid re-circulation swirls flow intensity in the chevron channel in larger surface area and make more transverse vortices of the bulk flow field in the chevron wall trough. Also the turbulent intensity is enhanced when compared to the other phase shift angle. This behavior results in higher local wall temperature gradients.
The friction factor is a prominent parameter to be considered in heat exchanger design. The variation of the friction factor vs the Reynolds number for phase shift at triangular chevron surfaces is shown in Fig. 18. It can be seen that the friction factor decreases with increasing Reynolds number. It also decreases with getting farther from the optimized phase shift, because the triangular chevron channel surface produces drag forces exerted on the flow field and also produces turbulence augmentation and rotational flow and therefore less fluid trapped between the triangular chevron surfaces.
TEF (f/f0)1/3
f Nu/Nu0 Nu
ϕ
0.89 2.73
0.64 2.42
63.39 0º
0.9 2.48
0.67 2.75
65.09 18.28º(Opt)
0.85 2.97
0.75 2.43
63.84 90º
0.82 2.88
0.75 2.35
61.61 180º
Table 2. Effect of phase difference on Nu, f and TEF
215 Fig.19 shows thermal efficiency factor vs Reynolds number 10000≤Re≤30000 for phase differences.When Reynolds number (velocity inlet) increases Nusselt number increases and friction factor decreases. As a result heat performance
coefficient decreases because when phase differences are close to the optimized phase differences. moreover, with Reynolds decrease fluid`s flow of turbulence increases and bubble creation and heat resistance in fluid decrease.
Fig. 17. Variation of Nusselt number with Reynolds number for various phase differences
Fig. 18. Variation of friction factor with Reynolds number for various phase differences
H. Dolatabadi and A. Hajizadeh Aghdam, AUT J. Mech. Eng., 3(2) (2019) 205-216, DOI: 10.22060/ajme.2019.14992.5755
7- Conclusions
Triangular chevron channel is a good alternative instead of smooth channel for high heat flux applications or for more efficient heat exchanging devices used in a wide variety of engineering applications like heating and air conditioning units. In this paper, by employing the NSGA II algorithm optimized geometry of triangular surfaces (Dv=7.43mm) was specified. Next, the optimized phase shift angle (ϕ=18.28º) for optimized geometry was obtained. The governing equations were solved using finite volume methods, with certain assumptions, to provide a clear condition for the targeted case study. The results of the average Nusselt number, friction factor in different phase shifts (ϕ) were presented. Furthermore, the flow characteristics have been visualized using streamlines. The thermal enhancement factor is closely related to the distribution of velocity streamline and breaking and destabilizing in the thermal boundary layer which are occurred as fluid flowing through the chevron surfaces. The channels with phase shift angle ϕ = 18.28º, are the most attractive state from the viewpoint of energy saving compared with the phase shift of ϕ = 0, and 90.
Nomenclature
Cp Specific heat (J kg-1 K-1)
D Distance between surfaces
Dh Hydraulic diameter (m)
Dv Distance of vertical axis
f Friction factor
fs Friction factor of smooth surface
g Gravitational acceleration (m s-2)
hx Local heat transfer coefficient (W/m2K)
k Thermal conductivity (W m-1 K-1)
L Length of Ducts (m)
Linlet Length of inlet`s channel
Loutlet Length of outlet`s channel
Lu Length of up line`s boot`s shape
m Mass flow rate (m3/ hr)
Nu Average Nusselt number (=hDh / k)
Nus Nusselt number of Smooth surface
Re Reynolds number
T Temperature (K)
TEF Thermal Enhancement Factor
u Velocity (m s-1)
x Axial coordinate
Greek Symbols
α Thermal diffusivity (=k/ρCp)
β Volumetric expansion coefficient (K-1)
μ Dynamic viscosity (N s m-2)
υ Kinematic viscosity (m2 s-1)
ρ Density (kg m-3)
z Thermal efficiency factor ϑ Angle of slant line
References
[1] A.A. Aziz. Dellil, B.A. Jubran, Turbulent flow and convective heat transfer in a wavy wall channel, Heat and Mass Transfer, 40 (2004) 793–799.
[2] C.P. Yasar Islamoglu Numerical investigation of convective heat transfer and pressure drop in a corrugated heat exchanger channel, Applied Thermal Engineering, 24 (2004).
[3] S.E.-a.a.W. Changcharoen, Analysis of Turbulent Heat Transfer and Fluid Flow in Channels with Various Ribbed Internal Surfaces, Journal of Thermal Science, 20 (2011) 260-267.
[4] J.L.a. GongnanXie a, Phillip M. Ligrani b, BengtSunden, Flow structure and heat transfer in a square passage with offset mid-truncated ribs, International Journal of Heat and Mass Transfer, 71 (2014) 44-56.
[5] M.-J.P. Mi-Ae Moon, Kwang-Yong Kim, Evaluation of heat transfer performances of various rib shapes,
International Journal of Heat and Mass Transfer, 71 (2014) 275-284.
[6] K.S. A. NajahAl-Shamani, H.A.Mohammed, SohifMat , MohdHafidzRuslan, Azher, M.Abed, Enhancement heat transfer characteristics in the channel with Trapezoidal rib–groove using nano fluids, Case Studies in Thermal Engineering, 5 (2015) 48-58.
[7] M.S. M. Khoshvaght-Aliabadi, M. Hesampour, O. Sartipzadeh, Experimental study on cooling performance of sinusoidal–chevron mini channel heat sink, Applied Thermal Engineering, 92 (2016) 50-61.
[8] M. Sakr, Convective heat transfer and pressure drop in V-chevron channel with different phase shifts, Heat Mass Transfer,, 51 (2015) 129-141.
[9] S.P. B. Bonhoff, J. Leusch, B.V. Johnson, J. Schabacker, A. Bolcs, Experimental and numerical study of developed flow and heat transfer in coolant channels with 45 degree ribs, Int. J. Heat Fluid Flow, 20 (1999) 311-319.
[10] E.S. A. Bejan, The optimal spacing of parallel plates
cooled by forced convection, Int. J. Heat Mass Transfer, 35 (1992) 3259-3264.
Pleasecitethisarticleusing:
H. Dolatabadi and A. Hajizadeh Aghdam, Multi-objective optimization of the structure of triangular chevron channels, AUT J. Mech. Eng., 3(2) (2019) 205-216.
DOI: 10.22060/ajme.2019.14992.5755
![Fig. 4. Comparison of the variation of Nu vs. Re for present study with Sakr [8]](https://thumb-us.123doks.com/thumbv2/123dok_us/8955478.1864846/3.595.112.471.287.479/fig-comparison-variation-nu-vs-present-study-sakr.webp)