Http://www.ijetmr.com©International Journal of Engineering Technologies and Management Research [59]
USER INTERFACE DESIGN AND INFORMATION SYSTEMS USAGE: A
CASE STUDY OF TVET INFORMATION SYSTEM AT IPRC KIGALI
MugumeNkuranga David *1, Raymond Wafula Ongus 2, Mbaabu Morris Gitonga 3, MukuruSsessaazi Alfred 4*1
Director of ICT Workforce Development Authority (WDA)
2
Associate Professor in Information Science
3
Lecturer in Computing and Informatics, School of Pure and Applied Sciences
4
Associate Lecturer in Information Science, Mount Kenya University, Rwanda, P. O. Box 5826, Kigali, Rwanda
Abstract:
Http://www.ijetmr.com©International Journal of Engineering Technologies and Management Research [60]
Keywords: Information; Information Systems; Usage; User Interface; Technical Vocational and Educational Training TVET; Workforce Development Authority WDA.
Cite This Article:MugumeNkuranga David, Raymond Wafula Ongus, Mbaabu Morris Gitonga, and MukuruSsessaazi Alfred. (2018). “USER INTERFACE DESIGN AND INFORMATION SYSTEMS USAGE: A CASE STUDY OF TVET INFORMATION SYSTEM AT IPRC KIGALI.” International Journal of Engineering Technologies and Management Research, 5(1), 59-80. DOI: https://doi.org/10.29121/ijetmr.v5.i1.2018.46.
1. Introduction
This chapter explains the background of the study, the statement of the problem, objectives of the study, research questions, significance of the study, limitations of the study, scope of the study and organization of the study.
According to Galitz (2007), a computer’s ability to deal with human communication was inversely related to what was easy for people to do. The computers designers have been developing with varying degrees of success, other than human-computer interaction methods that utilize more general, widespread, and easier to learn capabilities: voice and handwriting. In 1970’s, research at Xerox’s Palo Alto Research center in the United States of America provided an alternative of typewriter- an interface that uses a form of human gesturing, the most basic of all human communications method. The Xerox systems Altus and Star introduced the mouse and pointing and selecting as the primary human-computer communication method.
Research in Human-Computer Interaction (HCI) has been spectacularly successful, and has fundamentally changed computing. Just one example is the ubiquitous graphical interface used by Microsoft Windows 95, which is based on the Macintosh, which is based on work at Xerox PARC, which in turn is based on early research at the Stanford Research Laboratory (now SRI) and at the Massachusetts Institute of Technology in the USA (Demetry, 2005).
The design of user interface software is not only expensive and time-consuming, but it is also critical for effective system performance. To be sure, users can sometimes compensate for poor design with extra effort. Probably no single user interface design flaw, in itself, caused system failure. But there was limit to how well users can adapt to a poorly designed interface. As one deficiency is added to another, the cumulative negative effects may eventually result in system failure, poor performance, and/or user complaints (Azizah&Hesamaddin, 2017).
DOI: 10.5281/zenodo.1171467
Http://www.ijetmr.com©International Journal of Engineering Technologies and Management Research [61]
in the most effective way possible. The best interface is one that it not noticed, one that permits the user to focus on the information and task at hand, not the mechanisms used to present the information and perform the task (Sofia &Elinor, 2004).
User interface design is a subset of a field of study called human-computer interaction (HCI). Human-computer interaction is the study, planning, and design of how people and computers work together so that a person’s needs are satisfied in the most effective way. Human-Computer Interface designers must consider a variety of factors: what people want and expect, what physical limitations and abilities people possess, how their perceptual and information processing systems work, and what people find enjoyable and attractive. Technical characteristics and limitations of the computer hardware and software must also be considered (Michalski, et al, 2012). The user interface is the part of a computer and its software that people can see, hear, touch, talk to, or otherwise understand or direct. The user interface has essentially two components: input and output. Input is how a person communicates his or her needs or desires to the computer. Some common input components are the keyboard, mouse, trackball, one’s finger (for touch-sensitive screens), and one’s voice (for spoken instructions). Output is how the computer conveys the results of its computations and requirements to the user. Today, the most common computer output mechanism is the display screen, followed by mechanisms that take advantage of a person’s auditory capabilities: voice and sound (Heukelman&Obono, 2009)
Many information systems have been developed and a lot of resources invested in building these systems, however they end up not fully utilized and one contributing factor is the poorly designed interface that are complex, un attractive, poorly designed that means that the core principles of a good user interface are not met and this leads to less utilization of the system developed. One of the difficulties in striving towards having a good user interface knows when to elaborate and when to be concise. The quicker and easier something can be explained without losing any of the semantic meaning or factual information, the better. While a user interface should be designed so that users can easily run tasks without the help of a manual, it doesn’t hurt to implement some clearly labeled help documentation just in case (Galitz, 2007).
According to Platiša and Balaban (2009) the necessity to evaluate the functionality performances of Information System has emerged from the importance of Information Technology in effectiveness and efficiency of work processes in an organization, causing rapid growth of demands in terms of resources performances in Information System.
In this study the researcher is embarking on the core principles of good user interfaces, technologies and tools used in meeting these principles to come up with good user interface.
DOI: 10.5281/zenodo.1171467
Http://www.ijetmr.com©International Journal of Engineering Technologies and Management Research [62]
The government of Rwanda vision through vision 2020 and EDPRS documents is to become a regional hub in ICT through service delivery. In the government’s National Information Communication Infrastructure (NICI) III Plan 2015, the central government and all public institutions are to use to embark on e-Government for service delivery. This could be attained by development and use of information systems for all institutions render to the citizens online.
Workforce Development Authority (WDA) is a public Institution that is charged with promoting technical and vocational education in Rwanda. It established training centers in each of the five regions of Rwanda called Integrated Polytechnic and Regional Centre (IPRC). One of them being IPRC Kigali situated in Kigali City which is the training institution in technical and vocational education in Rwanda. The TVET information system is the application developed to help these IPRCs capture the data regarding TVET education in general which in the end help WDA and the Ministry of Education tell the status of TVET education through data collected into the system and reports generated as one may wish. The TVET-IS would also help in particular the IPRC Kigali staff and administration to tell the information regarding the academic staff, administrative staff, students and general infrastructure of the school through this system as data is captured. The research is to embark on this study to establish the effect and impact of the user interface in usage of this TVET Information system putting into consideration the design and technologies that have been used for its development
1.1.Statement of Problem
The user interface design has a very effective role in the usage of information systems.
According to Kalet (2009) user interface is the representation of the software to the user and its where the communication with the user on behalf of the system is performed.
The TVET information system has been designed to help the school authorities, staff and students capture the necessary information so that this can help in the management of the TVET schools after all the necessary information is available. The information system of TVET has been found to have some shortfalls. The graphics used at times makes the system heavy to respond in time while there is no Kinyarwanda version of the system. The terminologies used are not customizable to a Rwandan context and also the heaviness of the system itself and character display on the interface (Mugabo, 2015).Other issues cited are little knowledge of the system, unawareness of the system, lack of ICT skills by the users needed and poor good internet connectivity. Despite these challenges, there is no evidence that an empirically oriented study has been carried out to try to understand the poor usage of TVET information system though at national level is one of the pillars for the country’s vision 2020.
DOI: 10.5281/zenodo.1171467
Http://www.ijetmr.com©International Journal of Engineering Technologies and Management Research [63]
staff and their qualifications as well the infrastructure status of the TVET schools in Kigali province yet this is the mandate of IPRC Kigali and the system can help in this.
1.2. Objectives of Study
The study consists of the general objective and the specific objectives:
General Objective was to assess the impact of user interface design on information system usage taking a case study of TVET information system at IPRC Kigali
Specific Objectives were as follows:
To examine the design of the user interface of TVET information systems at IPRC Kigali.
To evaluate the usage of the TVET information system at IPRC Kigali.
To establish the relationship between TVET Information system user interface design and its usage.
2. Review of Related Literature
The study was based on the activity theory of Vygotsky and the Technology Acceptance Model (TAM) of Fred Davis. The original foundations for Activity Theory were laid down by Vygotsky in the period from 1924. His basic idea was that human activity is mediated by cultural signs: words and tools, which causes changes in a person's activity, and thus its mental reflection. The structure ofexternal and internal activity thus constituting a unity. Activities are initially carried out on the external plane, and are then internalized with many psychological functions such as attention, memory, and thinking (Vygotsky, 1981). Vygotsky's work was continued by A.N. Leontiev who developed a conceptual framework for the theory of Activity based on mental reflection and the corresponding activities evident in the evolution of animals and humans.
Leontiev (1978) developed the inner structure of activity based on the principle of analysis by units, meaning that all main properties are inherent in the whole. The units of activity are actions and operations organized in a hierarchical structure. Activities are distinguished on the basis of their motive; actions, on the basis of their goals; and operations on the basis of the conditions under which actions are carried out. The conceptualization of these 'units' makes it is possible to identify: (a) the reason for an activity by defining its motive; (b) the aim of an activity by defining the goal toward which the subject strives and (c) the means by which an activity is carried out by defining the conditions under which the action takes place.
DOI: 10.5281/zenodo.1171467
Http://www.ijetmr.com©International Journal of Engineering Technologies and Management Research [64]
Computer systems should support both initialization of new ways of action and articulation of mental processes, when necessary, to facilitate problem solving and social coordination.
Fred Davis (1989; 1993) presented the technology acceptance model based on theory of reasoned action to better explore acceptance of information systems (IS). Davis claims that perceived usefulness is one of the reasons a user will accept or reject a system and the other is perceived ease of use, which is the easiness or free of effort the user interpret the system. According to Mathieson, Peacock, and Chin (2001)compares the TAM with Theory of Planned Behavior (TPB) and concludes that Theory of Acceptance Model (TAM) better explains the attitude towards IS than TPB, and that it is easier to apply. It may be claimed that the theory is a rather old theory in a rapid change area as information technology, but it is still used and valid, although there are trends in to diversify the research where task-related information system is one and the other two are ecommerce and hedonic IS, for example online gaming and surfing (Hsiaoa, Hua, &Yanga, 2011).
The usage of the information system in this study is based on performance expectancy of the user in that they approach the information system with the expectation that it will better their performance. It is expected that once a user perceives that the information is useful, they will use it for data entry, to generate reports, trust its security for data storage and expect quick retrieval than in a manual system.
2.1.Use of Information System in IPRC Kigali
Integrated Polytechnic and Regional center (IPRC) Kigali is a Technical training college in different technical some of its mandates are to coordinate all the training school activities in Kigali Province on behalf of Workforce Development Authority which is an educational public institution in charge of promoting technical and vocational education.
Figure 2.1 gives snapshots of the TVET Information System and the main features.
DOI: 10.5281/zenodo.1171467
Http://www.ijetmr.com©International Journal of Engineering Technologies and Management Research [65]
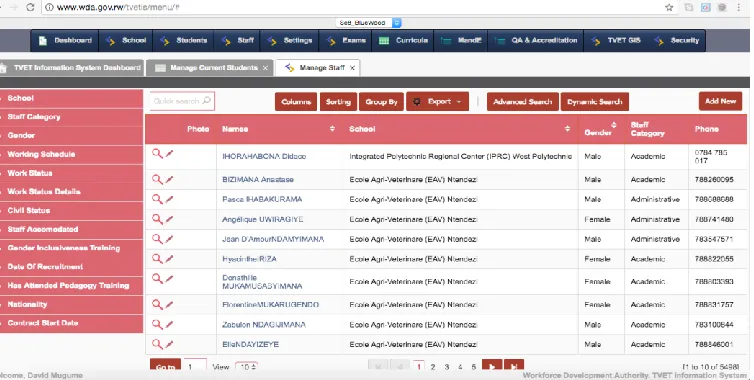
Staffs of IPRC Kigali use the TVET Information system by entering data regarding their educational level, qualifications and trainings done, the courses they teach or the assignment they hold within the institution. The staff also uses the TVET IS to entre data into the system regarding the students they teach by the names and courses they are offering. The administrative staffs are also supposed to use the TVET IS to enter data regarding their assignment and their qualification. The administrations of IPRC Kigali are required to retrieve the data in the system and be able to assess the number of students, the staff in each discipline of studies. Figure 2.1 shows data entry features of the TVET- IS
Figure 2.2: Student Module of the TVET-IS Source: TVET Information System 2017
The Administration of IPRC Kigali is also supposed to apply through the TVET Information system to Workforce Development Authority (WDA) for accreditation of new courses/trades. WDA is able to monitor and tell the status of the school by knowing the number of students in the school, the staff and their qualifications for better planning and improvement of TVET Education. Figure 2.2 shows the staff module and the accreditation capabilities of the TVET-IS
DOI: 10.5281/zenodo.1171467
Http://www.ijetmr.com©International Journal of Engineering Technologies and Management Research [66]
Figure 2.4: The Accreditation and quality assurance Source: TVET Information System 2017
A significant volume of research has been conducted on the field of computer human interaction and even in the interface design. Most of the studies have experimentally determined how user interface affects the user interaction with the system and recommended possible design factors to be considered.
However in the volumes of available literature there is still scarcity in the relationship between interface design and information system usage. Näsänen and Ojanpää (2003) and subsequent studies concentrated on the effect of graphical object’s contrasts on speed of search of specified icon and not on how it motivated the user to use the systems.
The current study seeks to investigate the effect of user interface design on the usage of information system. The usage was determined by the level at which the user was willing to use the system for data entry, retrieval of data, report generation and securing data. The cited studies have concentrated on an experimental design that controlled the environment in which the subject was studied. Such environments make the respondent aware of the study objectives and may act in a predetermined manner. The study therefore was designed to utilize descriptive methods and was only to examine the dependent and independent variables and then try to mathematically analyze the relationships. This eliminated the respondent tendency to behave as to please the researcher hence making the results more authentic.
DOI: 10.5281/zenodo.1171467
Http://www.ijetmr.com©International Journal of Engineering Technologies and Management Research [67]
2.2.Conceptual Framework
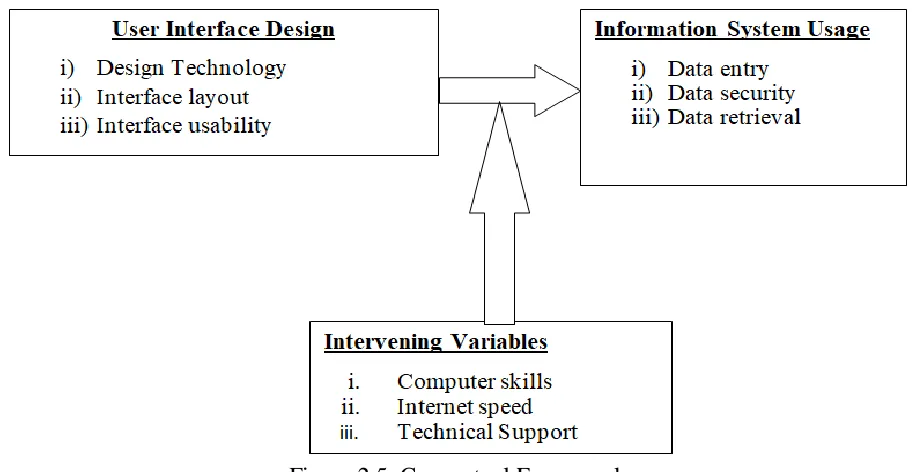
The conceptual framework shows the independent variables, dependent variables and intervening variables of the study as depicted in the figure below. Independentvariable was User Interface Design which comprises of design technologies, interface layout, user interface design principles and interface usability. Dependent variable was Information System Usage which comprises of data entry, display and report generation and data security. All the variableswere measured using the data collection instruments developed for the study.
Figure 2.5: Conceptual Framework
3. Research Methodology
Methodological approach, the techniques and instruments used in conducting the research. The research methodology various methods were used in research design, sampling and sampling strategy or plan, target population, data collection methods and techniques and the source of data, analysis, processing, and interpretation and drawing inferences.
3.1.Research Design
Descriptive research design was used in this study and it helped to determine the impact of user interface design on information system usage. A descriptive study is concerned deep study what, where and how of a phenomenon.
3.2.Target Population
DOI: 10.5281/zenodo.1171467
Http://www.ijetmr.com©International Journal of Engineering Technologies and Management Research [68]
3.3.Sample Design
A simple random sampling was used in the study. With the sample size estimation and sampling technique described thence.
Sample size refers to the number of units or people that are chosen from which the researcher wish to gather information or data (Evans et al., 2000). The sample size was determined using Slovin’s formula (1960);
= 𝑁
1 + 𝑁(𝑒)2
Where n = the sample size
N = the total population (was 308 in this study) e = the accepted sample error (is 0.05%)
𝑆𝑎𝑚𝑝𝑙𝑒 𝑠𝑖𝑧𝑒 (𝑛) = 308
1 + 308(0.05)2 = 174
The sample size was174 participants as shown in the formula. These were sampled and selected means of sampling techniques; simple random sampling and purposive sampling.
3.4.Data Collection and Analysis
The study used questionnaires as the tool for collecting data. The questionnaires emphasized mainly on the objectives of the study and the need to ascertain the positive or negative effect of User interface design and Information systems usage. The questionnaires used contained both open and closed ended questions with questions rated using five level likertscale of 5 = strongly agree to 1 = strongly disagree and 0 to 4 scale where 0 = most negative 1 moderately negative, 2 was neutral, 3 moderately positive and 4 most positive for the item measured. Primary data was analyzed and presented using frequencies, percentages, weighted means, standard deviations, test and multiple regression analysis. Statistical Package for Social Science (SPSS) V.19 was used as a tool of analyzing and the results presented in tables and graphs.
4. Research Findings and Discussion
4.1.Examination of the Design of the User Interface of TVET Information Systems at IPRC Kigali
DOI: 10.5281/zenodo.1171467
Http://www.ijetmr.com©International Journal of Engineering Technologies and Management Research [69]
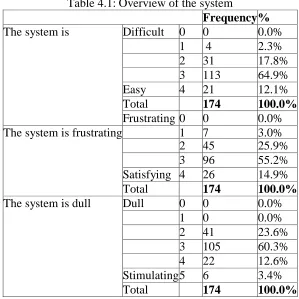
Table 4.1: Overview of the system
Frequency %
The system is Difficult 0 0 0.0% 1 4 2.3% 2 31 17.8% 3 113 64.9% Easy 4 21 12.1% Total 174 100.0%
Frustrating 0 0 0.0% The system is frustrating 1 7 3.0% 2 45 25.9% 3 96 55.2% Satisfying 4 26 14.9% Total 174 100.0%
The system is dull Dull 0 0 0.0% 1 0 0.0% 2 41 23.6% 3 105 60.3% 4 22 12.6% Stimulating 5 6 3.4% Total 174 100.0%
Source: Primary data
According to Table 4.1, the respondents were asked to evaluate the system in terms of difficulty level, satisfaction and appeal. A total of 2.3% found it moderately difficult, 17.8% were not sure about the difficulty level, 64.9% found the system moderately easy while 12.1% said it was easy. The finding shows that majority found the system generally easy.
A majority indicated by 55.2% found the system moderately satisfying, 14.9% found it satisfying while on the negative side, 25.9% were neutral and the remaining three percent found it moderately frustrating. It is evident that generally the system was satisfying to the users.
Found that 60.3% of the users of the system indicated that it was moderately stimulation, 3.4% saw it as stimulating while 23.6% found it moderately dull. This means that the system was moderately stimulating.
DOI: 10.5281/zenodo.1171467
Http://www.ijetmr.com©International Journal of Engineering Technologies and Management Research [70]
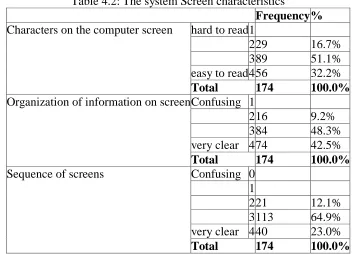
Table 4.2: The system Screen characteristics
Frequency %
Characters on the computer screen hard to read 1
2 29 16.7% 3 89 51.1% easy to read 4 56 32.2%
Total 174 100.0%
Organization of information on screen Confusing 1
2 16 9.2% 3 84 48.3% very clear 4 74 42.5%
Total 174 100.0%
Sequence of screens Confusing 0 1
2 21 12.1% 3 113 64.9% very clear 4 40 23.0%
Total 174 100.0%
Source: Primary data
According to Table 4.2, the characters on the computer screen was easy to ready according to 32.2%, moderately easy to read by the majority, 51.1%, while for the remaining 16.7%, it was neither hard to read nor easy to read. The implication is that the character on the computer screen was moderately easy to read.
About whether the organization of information on the screen, an overwhelming majority observed that it was very clear (42.5%) and moderately clear (48.3%). Only 9.2% were not sure about this screen attribute. The findings is in line with that of Al-Mamary, Shamsuddin and Aziati (2014) who found that information organization was a critical factor that users of an Information system considered important.
Another important critical factor elaborated by Al-Mamary, Shamsuddin and Aziati (2014) is the sequence of screens in a system. To this end the respondents were asked to rate the system screens sequences from confusing to clear. According to the majority 64.9%, the sequence is moderately clear, to 23.0% it is very clear while to the remaining 12.1% it was neither confusing nor very clear. This shows that the sequence of screens is moderately very clear than confusing to the users. The study of Zain, Tey, and Goh (2008) used five selected measures for screen and these were balance, equilibrium, symmetry, sequence, and rhythm. They concluded that these factors were important for the design of any screen layout.
DOI: 10.5281/zenodo.1171467
Http://www.ijetmr.com©International Journal of Engineering Technologies and Management Research [71]
Table 4.3: Terminology used in the system
Frequency %
Use of terms throughout system Inconsistent 0 1
2 15 8.6% 3 87 50.0% Consistent 4 72 41.4%
Total 174 100.0%
Computer terminology is related to the task you are doing
never 0 1
2 32 18.4% 3 114 65.5% Always 4 28 16.1% Total 174 100.0% Position of messages on screen confusing 0
1
2 2 71 40.8% 3 3 95 54.6% very clear 4 8 4.6% Total 174 100.0%
Unhelpful 0 0%
Error messages14.4 1 4 2.3%
2 29 28.2% 3 20 14.5% Helpful
4
4 121 69.5% Total 174 100.0%
Source: Primary data
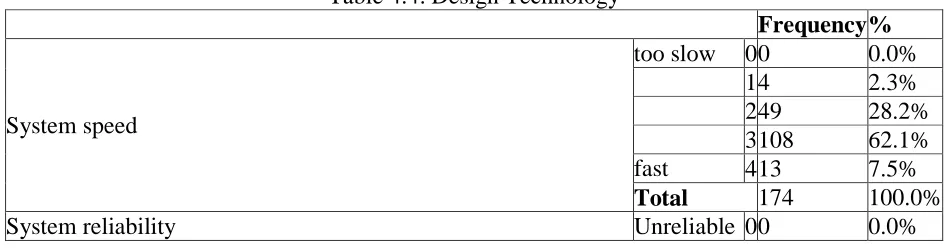
Design technology of the user interface was a component of user design technology and in this study the system speed, system reliability, correction of mistakes, user ability level taken care of, system feedback, system response to error, and system message and report are presented in Table 4.3.
Table 4.4: Design Technology
Frequency %
System speed
too slow 00 0.0% 14 2.3% 2 49 28.2% 3 108 62.1% fast
enough
4 13 7.5%
Total 174 100.0%
DOI: 10.5281/zenodo.1171467
Http://www.ijetmr.com©International Journal of Engineering Technologies and Management Research [72]
1 0 0.0% 2 20 11.5% 3 64 36.8% Reliable 4 90 51.7% Total 174 100.0%
Correcting your mistakes
Difficult 00 0.0% 1 0 0.0% 27 4.0% 361 35.1% Easy 4106 60.9%
Total 174 100.0%
Experienced and inexperienced users’ needs are taken into consideration
Never 01 0.6% 122 12.6% 276 43.7% 371 40.8% Always 44 2.3%
Total 174 100.0%
System feedback
Poor 00 0.0% 17 4.0% 285 48.9% 3 79 45.4% Good 43 1.7%
Total 174 100.0%
System response to errors
Poor 0 0 0.0% 1 56 32.2% 2 80 46.0% 3 37 21.3% Good 4 1 0.6% Total 174 100.0%
System messages and reports
Poor 0 0 0.0% 1 4 2.3% 2 79 45.4% 3 66 37.9% Good 4 25 14.4%
Total 174 100.0%
Source: Primary data
DOI: 10.5281/zenodo.1171467
Http://www.ijetmr.com©International Journal of Engineering Technologies and Management Research [73]
The design of a system takes into consideration the user’s ability and on this note the respondents were asked if the system took care of the experienced and the inexperienced user’s needs. A total of 40.8% found it moderately addressing this need always while 43.7% were undecided. This question was either confusing to the respondents since they were not technical users of the system or they were keeping information from the researcher.
System feedback was evaluated and according to the majority 48.9% this question was difficult to answer though also a higher percentage (45.4%) it was moderately good at responding to feedback. Similarly, on whether the system responded to errors, 46% were confused and had no response though 32.2% found the system moderately poor in responding to errors. Worse still, the system message and reporting was poor, 45%, though about 38% found it moderately good at handling messages and reports.
The findings on this item shows that the design technology of the system was difficult for the users to assess with majority observing that the system design was poor at responding to errors and providing messages and reports about those errors and lack of the ability to consider users experience level in the system use.
4.2.Evaluation of the Usage of the TVET Information System at IPRC Kigali
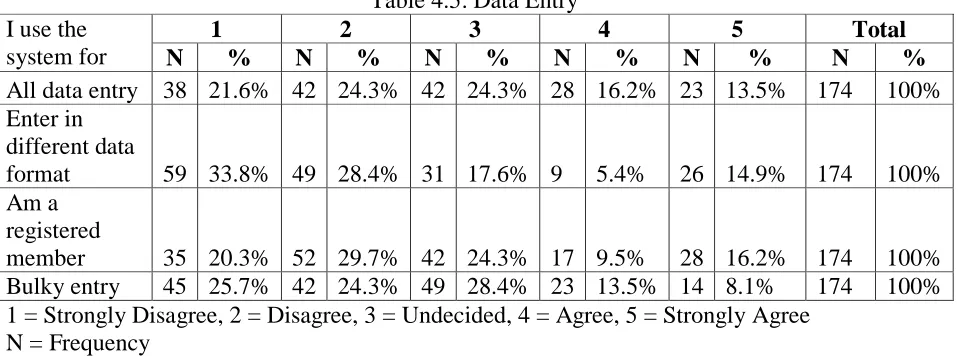
The second objective of this study was to evaluate the use of TVET information System and use for data entry, use for data retrieval and security were used to measure the level of usage. Use of TVET-IS for Data entry was examined by asking four questions whose responses are captured and presented in Table 4.5
Table 4.5: Data Entry I use the
system for
1 2 3 4 5 Total
N % N % N % N % N % N %
All data entry 38 21.6% 42 24.3% 42 24.3% 28 16.2% 23 13.5% 174 100% Enter in
different data
format 59 33.8% 49 28.4% 31 17.6% 9 5.4% 26 14.9% 174 100% Am a
registered
member 35 20.3% 52 29.7% 42 24.3% 17 9.5% 28 16.2% 174 100% Bulky entry 45 25.7% 42 24.3% 49 28.4% 23 13.5% 14 8.1% 174 100% 1 = Strongly Disagree, 2 = Disagree, 3 = Undecided, 4 = Agree, 5 = Strongly Agree
N = Frequency Source: Primary data
DOI: 10.5281/zenodo.1171467
Http://www.ijetmr.com©International Journal of Engineering Technologies and Management Research [74]
According to Table 4.7, 21.6% strongly disagreed that they used the system for all their data entry, 24.3% disagreed implying that a total of 45.9% did not use the system always to enter their data. Other than the 24.3% who were undecided, the remaining 29.7% used the system for all their data entry.
The different data entry formats would require a user to have different system capabilities however an information system is usually customized for needs of an organization. The respondents were asked if the ability to enter data in different formats was a motivation for the use. A total of 62.2% disagreed (33.8% strongly disagreed and 28.4% disagreed), 17.6% were undecided while the remaining 20.2% agreed. The implication is that majority didn’t find the different format capability a motivational factor to use TVET-IS for data entry.
Information Systems allow only authorized users to access the system and this could be a factor that limits users. Also most users are added as a result of a policy on IS usage thereby making them compulsory users. For this reason the respondents were asked whether they used the IS for data entry because they were registered members. A total of 50% disagreed with the statement while the remaining 50% were distributed in the undecided 24.3% responses and the agreement 25.7%.
Finally, a total of 50% of the respondents disagreed to the use of the system for bulky data entry while 28.4% were undecided and the remaining 22.6% used it so.
Figure 4.3 provides a summary of the usage of the TVET IS for data entry by presenting the mean response in terms of disagreement, Neutral (undecided) and agreement.
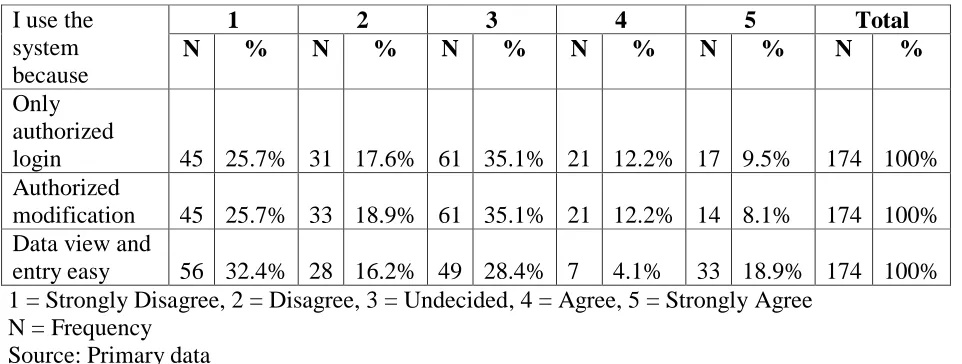
Data security that IS provides is always a motivation for the usage of the system and to this end the respondents were asked the reason for using the system related to data security as presented in Table 4.6
I use the system because
1 2 3 4 5 Total
N % N % N % N % N % N %
Only authorized
login 45 25.7% 31 17.6% 61 35.1% 21 12.2% 17 9.5% 174 100% Authorized
modification 45 25.7% 33 18.9% 61 35.1% 21 12.2% 14 8.1% 174 100% Data view and
entry easy 56 32.4% 28 16.2% 49 28.4% 7 4.1% 33 18.9% 174 100% 1 = Strongly Disagree, 2 = Disagree, 3 = Undecided, 4 = Agree, 5 = Strongly Agree
N = Frequency Source: Primary data
DOI: 10.5281/zenodo.1171467
Http://www.ijetmr.com©International Journal of Engineering Technologies and Management Research [75]
the system was the motivation to use the IS, disagreement amounted to 44.6% as compared to 20.3% agreement.
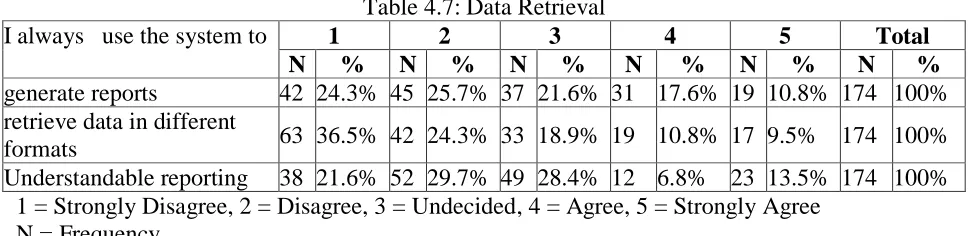
Finally 48.6% were in disagreement that several secure data view and easy of entry was a motivation for the use, 23% agreed and the remaining 28.4% were undecided. Usage of the TVET IS for data Retrieval; the users were asked to rate their agreement on the use of the TVET-IS for data retrieval purposes and the responses summarized as shown in Table 4.7.
Table 4.7: Data Retrieval
I always use the system to 1 2 3 4 5 Total
N % N % N % N % N % N %
generate reports 42 24.3% 45 25.7% 37 21.6% 31 17.6% 19 10.8% 174 100% retrieve data in different
formats 63 36.5% 42 24.3% 33 18.9% 19 10.8% 17 9.5% 174 100% Understandable reporting 38 21.6% 52 29.7% 49 28.4% 12 6.8% 23 13.5% 174 100%
1 = Strongly Disagree, 2 = Disagree, 3 = Undecided, 4 = Agree, 5 = Strongly Agree N = Frequency
Source: Primary data
According to Table 4.7, a total of 50% of the respondents were in disagreement, 21.6% were undecided and the remaining 28.4% in agreement that they used the system always to generate reports. The use of the system for retrieving data in different formats by the users was not evident since the majority (60%) disagreed and similarly the use for generating understandable reports was not evident likewise (51.3% disagreement).
4.3.Establishment of the Relationship between TVET Information System User Interface Design and its Usage
The third objective of the study was to establish the relationship between user interface design and the usage of Information System. Multiple regressions of coefficients was performed and the results presented as shown in Table 4.8
Table 4.8: Interface Usability and Information System Usage
Control Variables IS
Usage
Interface Usability
Computer skills, Internet Speed & Technical Support
IS Usage
Correlation 1.000 .642 Significance
(2-tailed)
. .000
df 0 130
Interface Usability
Correlation .642 1.000 Significance
(2-tailed)
.000 .
DOI: 10.5281/zenodo.1171467
Http://www.ijetmr.com©International Journal of Engineering Technologies and Management Research [76]
According to Table 4.24 the Pearson correlation coefficient (r = 0.642) and p-value (0.000) was produced implying the relationship between interface usability and IS usage was positive and statistically significant. According to Knowledge, Khangura, Grimshaw, & Moher, (2008) there is some evidence supporting the positive relationship between Interface Usability and its usage however additional evidence is needed to provide a strong conclusion. His study found several factors that affected the system hence partially supporting the findings of the current study.
The presentation of the output of the correlation analysis for interface usage and TVET IS Usage.
Table 4.8: Correlation output of Interface Layout and IS Usage
Control Variables IS Usage
Computer skills, Internet Speed & Technical Support
IS USage
Correlation 1.000 Significance (2-tailed)
.
df 0
Interface layout
Correlation .587 Significance (2-tailed)
.000
df 173 Source: Primary data
The correlation coefficient (r = 0.587, P<0.01) showing that the relationship between interface layout and IS Usage and the relationship was statistically significant. The finding in this Table confirms the finding that Information systems improve performance (Chaudhry, 2006; Welch, 2007) and when the layout of the system among other design attributes are done well usage increases (Davis, Bagozzi, &Warshaw, 1989).
Table 4.9: Correlation output of Design Technology and IS Usage
Control Variables IS Usage
Computer skills, Internet Speed & Technical Support
IS Usage
Correlation 1.000 Significance (2-tailed)
.
df 0
Design Technology
Correlation 0.743 Significance (2-tailed)
.000
df 173
Source: Primary data
DOI: 10.5281/zenodo.1171467
Http://www.ijetmr.com©International Journal of Engineering Technologies and Management Research [77]
finding in this Table confirms the finding that Information the type of interface design technology influences the entire system performance and in turn affects the user friendliness of the system (Michalski et al., 2012).
4.3.1. The Regression Model
A regression analysis was finally performed to provide a definite direction for the relationship between User Interface design and IS Usage and the findings presented in Table 4.10
Table 4.10: Regression Model Summary
Model R R Square Adjusted R Square Std. Error of the Estimate
1 0.994a 0.988 0.988 0.045725
a. Predictors: (Constant), Design Technology, Interface layout, Interface Usability Source: Primary data
The relationship between User Interface Design and IS usage produced multiple Linear multiple correlation coefficient R = 0.994, R2 = 0.988 implying that there is a very strong positive relationship between the User Interface Design and IS Usage. This finding is similar to that of Heukelman and Obono (2009) a positive relationship was found between use of familiar icons on the screen and the use of the system.
It is argued that continuous improvement of how user interacts with computer system would make adoption quicker and use easier. Michalski et al. (2012) found that new methods based on voice input may alleviate the concerns with text entry, enabling people to describe their information needs in spoken form; however, the limitations of automated speech recognition in public spaces pose some challenges here. Additionally, advances in context-aware query recommendation and expansion obviate the problems in the case of popular queries, and there is evidence that context can be successfully used to support query construction (Arias et al., 2008). The improved usability of text entry with newer touch screen devices may also make usage easier.
5. Summary of Findings
The finding shows that majority of the respondents found the system generally easy, moderately satisfying and stimulating. The screen design characters were easy to read and very clear. The findings also showed that the terminology used was easy to recognize, consistent throughout the system and related to the task. The system message was visible on the screen while the error messages were very relevant and helpful for the user.
DOI: 10.5281/zenodo.1171467
Http://www.ijetmr.com©International Journal of Engineering Technologies and Management Research [78]
Majority disagreed to using the IS for all their data entry needs, were not generating different document formats with the system and even though the usage is enforced by policy, the data entry usage of the system was denied by the majority of the respondents. It was assumed that system security assurance would encourage more usage of the system however the it was found that the majority were never motivated to use the system even if it provide high security for the data such as authorized login, inability of unauthorized user to modify another’s data among others. A similar finding was found on use of the system for information retrieval. Majority did not retrieval their information using the system even if the reporting and presentation formats were superior to most systems the use used.
The correlation between different elements of this study provided statistically evidence for the user interface design and usage. Pearson correlation coefficient (r = 0.642) and p-value (0.000) was produced implying the relationship between interface usability and IS usage was positive and statistically significant. Interface Usability accounted for (r2) 41.3% of the TVET IS usage at IPRC. A correlation coefficient (r = 0.587, P<0.01) showing that the relationship between interface layout and IS Usage was statistically significant and Interface layout accounted for 34.55% of total IS Usage irrespective of the computer skills, internet speed and technical support.
Similarly a correlation coefficient (r = 0.743, P<0.01) between design Technology uses and IS Usage was found with the relationship being statistically significant and Design Technology accounting for 55% of total IS Usage.
Overall the regression coefficient for the User Interface design and IS Usage produced a regression coefficient R = 0.994, R2 % = 98.8% implying that there is a very strong positive relationship between the User Interface Design and IS Usage.
6. Conclusion
From the findings in this study, it is found that the Design used considered interface usability, design technology and interface layout. It was observed that the design Technology was difficult for the users to evaluate though they observed that it allowed the system to be fast and present error messages. The interface usability was highly applauded and interface layout such as the position of the error message on the screen being consistent, menus visible and screen large enough. The level of usage was very low and there was a positive correlation between design interface and usage of TVET IS.
7. Recommendations
DOI: 10.5281/zenodo.1171467
Http://www.ijetmr.com©International Journal of Engineering Technologies and Management Research [79]
coaching is paramount to the users of the system so that they are very conversant with the system and technologies used. Workforce Development Authority should only accept online applications for accreditation and its approval to IPRC through TVET Information. The government should set the policy where online services are paramount and this would help in institutions like IPRC Kigali use the available systems like TVET-IS to the maximum.
The government of Rwanda has set up network infrastructure like fiber backbone and 4G networks across the country, and through National Infrastructure and Information Communication Infrastructure III Policy document (NICI III) it is an obligation for all government institutions to use this heavy investment done and have all work done online. By following this policy document, WDA will have to emphasize in the use of TVET information system in all IPRCS and TVET schools.
8. Suggestions for Further Studies
The government of Rwanda has identified ICT as a key pillar for the development of the country. This is an ambitious plan and requires a high level of commitment as well as resource. During this study, it was evident that most of the respondents did not have interest or had poor attitude towards ICT in general. A study should be carried out on how this attitude would be changed through training of the users on ICT.
References
[1] Al-Mamary, Y. H., Shamsuddin, A., &Aziati, N. (2014).Factors Affecting Successful Adoption of Management Information Systems in Organizations towards Enhancing Organizational Performance. American Journal of Systems and Software, 2(5), 121–126.
https://doi.org/10.12691/ajss-2-5-2
[2] Arias, M., Cantera, J. M., Vegas, J., de la Fuente, P., Alonso, J. C., Bernardo, G. G., &Zubizarreta, Á. (2008). Context-based personalization for mobile Web searc. In Proceedings of PersDB2008 – 2nd International Workshop on Personalized Access, Profile Management, and Context Awareness: Databases (pp. 33–39).
[3] Azizah, A. R., &Hesamaddin, T. (2017). Impact of Hospital Information Systems on patient care: Nurses’ perceptions | Canadian Journal of Nursing Informatics. Canadian Journal of Nursing Informatics. Retrieved from http://cjni.net/journal/?p=1796
[4] Chaudhry, B., Wang, J., Wu, S., Maglione, M., Mojica, W., Roth, E., Shekelle, P. (2006). Systematic Review: Impact of Health Information Technology on Quality, Efficiency, and Costs of Medical Care. Ann Intern Med, 144, 12–22.
[5] Davis, F. D., Bagozzi, R. P., &Warshaw, P. R. (1989). User acceptance of computer technology: a comparison of two theoretical model. ManageSci, 35.
[6] Demetry, C. (2005). Use of Educational Technology to Transform the 50-Minute Lecture : Is Student Response Dependent on Learning Style ? Engineering Education, 14961–14971. Retrieved from
http://www.scopus.com/inward/record.url?eid=2-s2.0
22544444658&partnerID=40&md5=88d6af94ad888a32df18a7f4f86dc64b
[7] Evans, M., Hastings, N., & Peacock, B. (2000). Statistical Distributions (3rd ed). New York, USA: Wiley
DOI: 10.5281/zenodo.1171467
Http://www.ijetmr.com©International Journal of Engineering Technologies and Management Research [80]
[9] Gould, E., &Verenikina, I. (2003).An activity theory framework for computer interface design.In Proceedings of the 25th International Conference on Information Technology Interfaces, 2003.ITI 2003. (pp. 301–307). IEEE. https://doi.org/10.1109/ITI.2003.1225361
[10] Heukelman, D., &Obono, S. E. (2009).Exploring the African Village metaphor for computer user interface icons. In Proceedings of the 2009 Annual Research Conference of the South African Institute of Computer Scientists and Information Technologists on - SAICSIT ’09 (pp. 132–140). New York, New York, USA: ACM Press. https://doi.org/10.1145/1632149.1632167
[11] Hsiaoa, Hua, C., &Yanga, C. (2011). The intellectual development of the technology acceptance model: A co-citation analysis. International Journal of Information Management, 31, 128–136. [12] Kalet, I. (2009). Principles of biomedical informatics.Academic Press/Elsevier. Retrieved from
https://books.google.rw/books?id=AdKtkKcWFgC&dq=user+interface+is+the+representation+of +the+software+to+the+user+and+its+where+the+communication+with+the+user+on+behalf+of+ the+system+is+performed.&source=gbs_navlinks_s
[13] Kamel, S. (2005).The use of information technology to transform the banking sector in developing Nations.Info. Technol. Dev, 11(14), 305–312.
[14] Leontiev, A. .(1978). Activity, Cotisciousiiess and Personality. Englewood cliffs, NJ: Prentice-Hall.
[15] Mathieson, K., Peacock, E., & Chin, W. (2001).Extending the technology acceptance model: the influence of perceived user. The Data Base for Advances in Information Systems, 32(3), 86–113. [16] Michalski, R., Grobelny, J., &Karwowski, W. (2012). The effects of graphical interface design
characteristics on human-computer interaction task efficiency. International Journal of Industrial Ergonomics, 36, 959–977. https://doi.org/10.1016/j.ergon.2006.06.013
[17] Mugabo, J. (2015, June 8). New information system to improve TVET management - The New Times | Rwanda.The New Times, p. News. Retrieved from
www.newtimes.co.rw/section/article/2015-06-08/189524/
[18] Näsänen, R., &Ojanpää, H. (2003).Effect of image contrast and sharpness on visual search for computer icons. Displays, 24, 137–144.
[19] Platiša, G., &Balaban, N. (2009).Methodological Approaches to Evaluation of Information System Functionality Performances and Importance of Successfulness Factors Analysis. Management Information Systems, 4(2), 11–17. Retrieved from
http://www.ef.uns.ac.rs/mis/archive-pdf/2009 - No2/MIS2009_2_2.pdf
[20] Sofia, S., &Elinor, T. (2004). Designing a User Interface for Web Based Project Management in Film Production. Linköpings Universitet. Retrieved from
https://www.diva-portal.org/smash/get/diva2:19735/FULLTEXT01.pdf
[21] Vygotsky, L. . (1981). the Instrumental Method in Psychology. In J. V Wet-tsch (Ed.), The Concept of Activity in Soviet Psychology.Aiiionk. NY: Shatpe.
[22] WDA.(2016). Information Communication Technology assessment report 2015-2016.Kigali City. [23] Zain, J. M., Tey, &Goh, Y. (2008).Probing a self-developed aesthetics measurement application (SDA) in measuring aesthetics of mandarin learning web page interfaces. IJCSNS International Journal of Computer Science and Network Security, 8(1).
*Corresponding author.