Journal homepage: http://civiljournal.semnan.ac.ir/
Comparison between Alternative Load Path Method
and a Direct Applying Blast Loading Method in
Assessment of the Progressive Collapse
M. Bagheripourasil
1and Y. Mohammadi
*21. M.Sc., Department of Civil Engineering, University of Mohaghegh Ardabili, Ardabil, Iran.
2. Assistant Professor, Department of Civil Engineering, University of Mohaghegh Ardabili, Ardabil, Iran.
Corresponding author:[email protected]
ARTICLE INFO
ABSTRACT
Article history:
Received: 11 March 2015 Accepted: 27 February 2016
Extensive research has been focused on the progressive collapse analysis of buildings and most of them are based on the alternative path method (APM) with sudden removal of one or several columns. However, in this method the damage of adjacent elements of removed columns under blast conditions was ignored and this issue can lead to an incorrect prediction of progressive collapse. Therefore, in this study to evaluate the alternative load path method in predicting the progressive collapse due to blast loading, a 3-D finite element model of a 7 storey steel building simulated and the behavior of structure was studied using the direct applying of blast load method and alternative load path method. For simulating and applying the blast loading and assessment of their direct effects on structures, a blast load equivalent to 1 ton TNT was considered at a distance of 4 meters from the corner of the structure. The pressures of this blast in 4 loading cases are applied to the adjacent structural members and the structural response has been examined. Finally, the exciting forces in adjacent structural members of blast site in each case have been compared. The results show that in assessment of the potential of progressive collapse occurrence by considering the blast loading as the initial reason of failure, the structure response will be different compared with the alternate load method that in which the initial reason of progressive collapse was ignored.
Keywords:
Progressive collapse, Blast loading, Steel moment frame, Finite element method.
1. Introduction
After several disastrous building collapses, concepts such as progressive collapse and
structure or an essential part of it that is disproportionately large compared to the initiating local damage is considered a progressive collapse. In addition to the design guidelines, the mentioned standards provide provisions for the progressive collapse analysis of newly designed and existing structures. The main objective of such analysis is the assessment of the potential for progressive collapse. The behavior of the structure is analyzed in terms of the alternate load paths, tie forces, connection redundancy and resilience, and catenary or compressive arching actions of the structural members [3]. One of the main causes of progressive collapse is the explosions occurring near the construction sites. Explosions can be categorized on the basis of their nature. It can be a bomb, a gas-chemical explosion or an airplane attack etc [4]. An explosion can cause damage on the building's structural frames, which may even cause structural collapse. More and more researchers have started to refocus on the causes of progressive collapse in building structures, seeking rational methods for the assessment and enhancement of structural robustness under extreme accidental events. In the United States, the Department of Defense [2] and the General Services Administration [3] provide detailed information and guidelines regarding methodologies to resist progressive collapse of building structures. Both employ the alternate path method (APM). The methodology is generally applied in the context of a “missing column” scenario to assess the potential of progressive collapse by directly removing a column. Most of the published progressive collapse analyses for entire buildings or their components are based on the alternate load path method with column removal. Marjanishvili, presented, in a general manner, four successively more sophisticated analysis procedures for estimating the progressive collapse hazard: linear-elastic static, nonlinear static, linear-elastic dynamic and nonlinear dynamic [5]. Izzuddin et al. presented a design-oriented methodology for progressive collapse assessment of multistory buildings. The proposed assessment framework
simplifications applied in the models are justified by the required limitation of the computational time and resources. However, in most of the works where the APM method has been used, the damage that might be induced in the adjacent structural members by blast loads has been neglected. These simplifications may lead to inaccurate prediction of the structural collapse. Therefore, in this paper a procedure has been proposed for progressive collapse analysis of common steel building structures subjected to blast loading. A 3-D numerical model with the direct simulation of blast load has been used to study the real behavior of a 7 story building under the blast loading.
2. Numerical model
2.1. Prototype structure
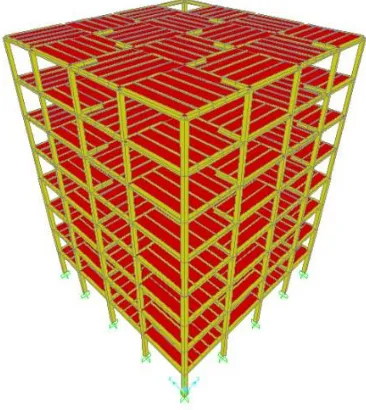
A 3D prototype model of a 7-stroy steel building has been developed in SAP 2000 [12] with the typical storey plan shown in Fig. 1. The floor height adopted is 3.20 meters for each level. The floor system is a full shear interaction metal deck with a slab thickness of 150 mm; the shear studs are evenly distributed along the steel beams. The steel rebar used in the rebar mesh for the slabs is A252. Intermediate steel moment resisting frame acts as the lateral force resisting system of the building in both X and Y directions. The connections between beams and columns are rigid and are made of the St37 steel. The yield and ultimate stress of St37 steel are 2400 kg/cm2 and 3700 kg/cm2 respectively. The conventional design of the structure was carried out according to the tenth topic of the Iranian Building National Regulations [13] by using the SAP2000 software. The 3D view of the building in SAP 2000 is shown in Fig. 2. Dead, live and earthquake loads were calculated based on the Sixth topic of the Iranian Building National Regulations [14]. The structural design of the building was done to ensure the selection of near-optimal levels of stresses and lateral displacements of the structure on one hand and on the other hand, design of
components to a have simple and uniform arrangement. In order to study the progressive collapse of structures in future, the effect of each of the various members on the general behavior of the structure can be analyzed in an appropriate and comprehensible manner. The results of structural design are presented in Table 1.
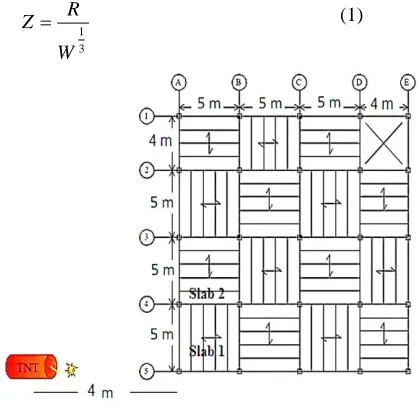
Fig. 1. Typical plan of 7-story prototype building
Table 1. Column and beam sections prototype structure
2.2 Finite element modeling
Finite element modeling of the structure was performed using ABAQUS package [15]. BEAM element has been used to model all the beams and columns. The slabs are modeled using the four noded Shell element. Reinforcement was embedded in each shell element using the REBAR element as in smeared layers. The beam and shell elements are coupled together using rigid beam constraint equations to ensure the composite action between the beam elements and the concrete slab. Nonlinear material characteristics have also been incorporated in the model. The material properties of all the structural steel components were modeled using an elastic–plastic material model available in ABAQUS. The plastic part is defined as the true stress and logarithmic strain. During the analysis, ABAQUS calculates values of yield stress from the current values of plastic strain. It approximates the stress-strain behavior of steel with a series of straight lines that join the given data points to simulate the actual material behavior. For this purpose, any number of points can be used. In this study bilinear model was used. The material will behave as a linear elastic material up to the yield stress of the material. After this stage, it goes into the strain hardening stage until reaching the ultimate stress. Steel is an isotropic material which has good ductility and strength. It generates significant deformation prior to failure. The reinforced concrete material was modeled using a concrete damage plasticity
model. The adopted concrete properties were: Young’s modulus, 24757×106 Pa, Poisson coefficient, J= 0.2, and density, ρ =2400 kg/m3. The material properties of the rebar in the elastic and plastic ranges have been shown in Table 2.
Table 2. Material properties of the rebar in the plastic range
Density (ρ) 7.85×10⁻⁶ Mpa
Poisson's ratio(μ) 0.3
Modulus of elasticity )E( 2.05×10⁻⁶ Mpa Yield stress )Mpa( Plastic strain
280 0
370 0.09
The shell elements are integrated at 9 points across the section to ensure that the concrete cracking behavior is correctly captured. The models are supported at the base of the ground floor columns. The mesh representing the model has been studied and is sufficiently fine in the areas of interest to ensure that the developed forces can be accurately determined. The continuity across the connection is maintained by the composite slab acting across the top of the connection.
2.3 Material behavior
A schematic of the stress-strain curve of the steel material considered for modeling is shown in Fig 4. The nonlinear behavior and dynamic effects of the material due to blast or impact loading are also considered in the simulation. The
mechanical properties of the structural steel members under blast loading are affected by the rate at which straining takes place. According to UFC4-023-03 [2] regulations, the Strength Increase Factor (SIF) was used since the yield strength of steel is approximately 25% greater than the characteristic strength. Also, in accordance with the regulations the coefficient of the Ultimate stress of steel is equal to 1.05.
Fig. 3. 3D finite element model of the building
Fig.4.The Diagram of Strength Increase Factor [16]
2.4 Validation of the finite element
method used in this study
In order to validate the proposed model, a 5-storey steel frame building which was tested by
Fig. 5. Four first-story columns exposed in song's study [14] Fig. 6. Before and after removal of middle part of a column [14]
Fig. 7.Displacement of the OHIO building after removing two columns (With the finite element method of this study)
Fig. 8. Strain gauge (Number 2) measurements during column removals
Fig. 9. Strain gauge (Number 15) measurements during column removals
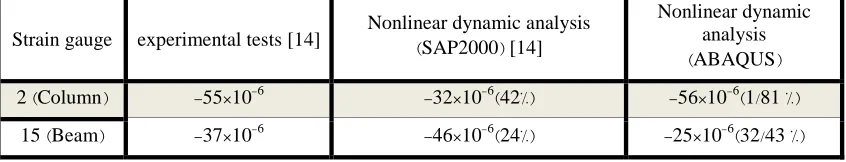
The strain values obtained from analytical models and experimental tests of the strain gauges 2 and 15 during the removal of two columns has shown in Table 3. Comparison between the test results and the modeling results
showed a good agreement. One reason for this difference is the lack of floor system modeling. Because there was not enough information about the floor details in hand. More details about this validation are available in reference [18].
Table 3. Comparison between Strain values obtained from numerical model and experimental results
Strain gauge experimental tests [14] Nonlinear dynamic analysis[14] (
SAP2000 )
Nonlinear dynamic analysis
( ABAQUS )
( Column )
2 -55×10-6 -32×10-6)42%( -56×10-6)1/81 %(
( Beam )
15 10-6
× 37
- 10-6)24%( ×
46
- 10-6)32/43 %( ×
-3.
Determination of the blast loads on
the prototype building
According to Blanc Et al. [19], it is possible to evaluate precisely the shock propagation around the structure and the structure's response, using a fluid–structure interaction method. However, it leads to the complex models. Another possibility is the use of empirical models to compute the load on the structure. This solution is computationally effective and is adopted in the current study with the program ATBLAST [20]. It will be explained in detail in this section. There are many ways in which an explosive device may deliver an attack e.g. the conventional devices like Vehicle bombs, Package bombs, Mortar bombs, Culvert bombs and Incendiary devices [21]. In this paper, the scenario of package bombs is selected for the study, as this type of attack is more difficult to prevent than other attack scenarios such as vehicle bombs.
Loads applied to the structure involve the weight of the structural components (beam, column), dead, live and blast loads. The load combination of DL+0.25LL has been used in dynamic analysis according to the loading pattern presented in the GSA2003 [3]. For simulating and applying the blast loads and assessment of their direct effects on structures, a blast load equivalent to 1 ton TNT was considered at a distance of 4 meters from the corner of the structure (Fig. 10). The pressures of this blast in four loading cases (as shown in Table 4) are applied to the adjacent structural members, and the structural response will be examined. This amount of TNT can simulate explosion of a powerful bomb near a residential building and hence has got technical and practical importance [22].
The principle of the scaling law is used extensively to determine blast-wave characteristics in most design guidlines such as TM5-1300 [23]. It is based on the conservation of momentum and geometric similarity. The empirical relationship, formulated independently by Hopkinson [24] and Cranz [25], is described as cube-root scaling law and is defined as:
3 1 W
R
Z (1)
Fig. 10. Location of explosives
Table 4.Different cases of applying the load blast
Case Column location Slab location
1 (base) A5 (base)Slab1
2 A4 and A5 (base) Slab1, Slab2 (base)
3 (base and 1st) A5 (base and 1st) slab1
4 (base and 1st) A5, A4 (base and 1st) Slab1,slab2
where the impulse of the positive phase of the blast is preserved and the decay of overpressure is assumed to be linear as shown in Fig. 11. This simplification is also applied in ATBLAST. The purpose of the study is to provide a fast blast evaluation, and to investigate the response of the building when the blast wave just starts to act on the structure. Therefore, to simplify the model, the effect of blast wave reflections on structural and non-structural elements after the denotation was neglected.
For determining the time-history of blast loading on structure, the weight of explosive charge (W), the reflection angle (α) and the ranges to the charges (R) were given as input to the ATBLAST program. The shock velocity (V), time of arrival (t*), overpressure (Ps), impulse and load duration of the blast loading for A4 and A5 Columns on the base and the first story and the slab1 and slab2 on the base story were obtained. These parameters (Table 5) were then put in the Friedlander blast load equation, which is one of the most accurate and most complete examples of the numerical solution of the blast waves [26]. These parameters are also shown in a time-pressure graph (Fig. 12).
) 1 ( *
) (
* t
t e
p
P t
t
so
t
(2) The Friedlander equation was solved using
Maple17 and the time history of the blast loading on the structure was obtained and the same was
applied to the 3D finite element model in ABAQUS. One such graph is shown in Fig. 13. In the simulation model, the blast load was applied as an area load acting directly on the slabs and line load acting directly on the beams and columns. All other related information has been shown in Fig. 14. For the applied blast loadings, the times of arrival and load durations are all different due to their distance from the blast charge locations. Therefore, the propagation of the blast waves was also simulated. This is shown in Fig. 14, which clearly shows the blast pressure propagation through the slab at different times.
Fig. 11.Simplified blast-wave overpressure profile with impulse by Yandizo et al. (1999) [21]
Table 5.Different cases of applying the load blast
t*(ms) Ps (𝑝𝑠𝑖) 𝛼
(deg) R(ft) W(lb) Story
Fig. 12.Time history of the blast loading in a given time-pressure graph for slab 1
Fig. 13.The parameters of Friedlander equation (Maple17 output)
Fig. 14.The manner of applying the blast load on the given structure components (e.g., case4)
4. Evaluation of the structural response
to blast loading
The response of the prototype building under the blast loading has been accessed using nonlinear dynamic analysis method with 3-D finite element
technique in ABAQUS. The loads are computed as dead loads (which is the self-weight of the floor) plus 25% of the live load in accordance with the acceptance criteria outlined in GSA guidelines. In the analysis, the internal forces, such as axial force, shear force, bending moment, displacements and rotations for each of the members involved in the scenario were recorded.
4.1. Results of Analysis
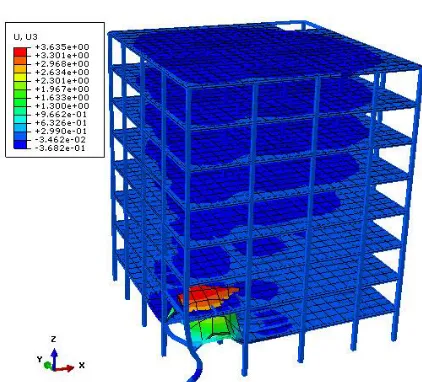
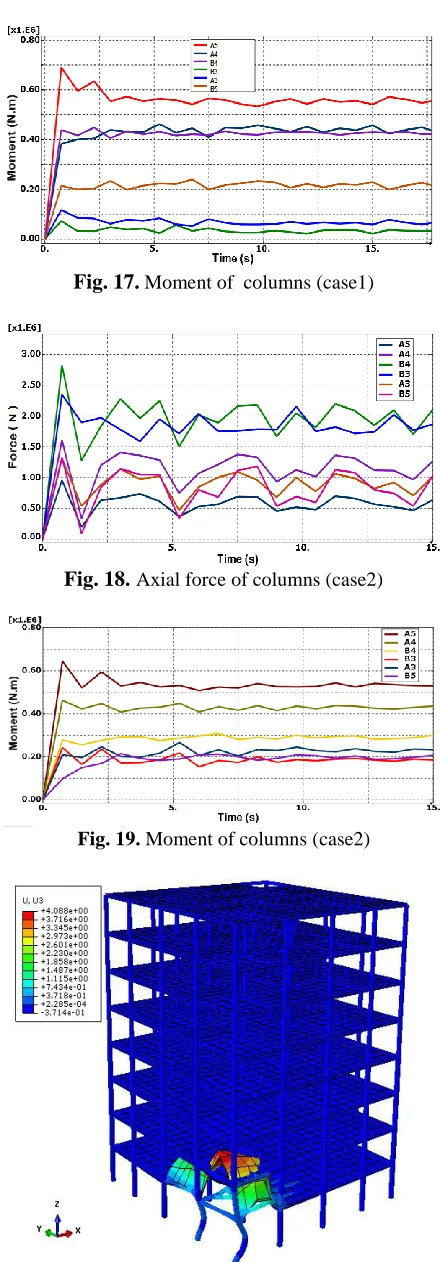
The results of the analysis for the prototype building have been evaluated in this section. The displacement of structure in the vertical direction (U3), axial force and bending moment diagrams respectively have been presented in Figures (15) to (26). The response of the structure will be investigated through axial force changes, DCR (ratio of demand to capacity), ductility and rotation of members.
Fig. 15.Axial force of columns (case1)
Fig. 17. Moment of columns (case1)
Fig. 18. Axial force of columns (case2)
Fig. 19. Moment of columns (case2)
Fig. 20.Vertical displacement contour (case2)
Fig. 21.Axial force of columns (case3)
Fig. 22.
Moment of columns (case3)
Fig. 24.Axial force of columns (case4)
Fig. 25.
Moment of columns (case4)
Fig. 26.Vertical displacement contour (case4)
4.2 Acceptance Criteria for Progressive
Collapse
The acceptance criteria for progressive collapse are demand to capacity ratio (DCR), plasticity index and rotation of the members. These criteria will be used to determine the behavior of structures against progressive failure.
4.2.1 Evaluation DCR criteria
To evaluate the results of analysis, the magnitude and distribution of predicted demands are determined by Demand-Capacity-Ratio (DCR). DCR for a given structural component is defined as the ratio of the maximum demand (D) (e.g., moment, Mmax) of the beam or column to its
expected capacity (D) (e.g, ultimate moment capacity, Mp).
P M M C D
DCR max
(3)
Where, the moment demand (Mmax) of the beam
or column is calculated from analysis, and moment capacity, Mp is calculated as the product
of plastic section modulus and yield strength. While calculating the Mp for columns, the effect
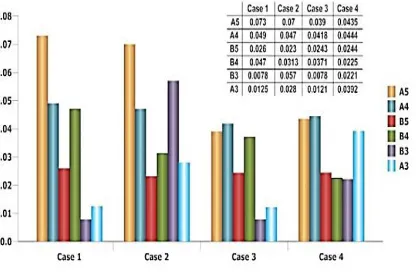
Fig. 27.Shear DCR values in different load cases
Fig. 28.Bending DCR values in different load cases
According to the values of shear DCR and its comparison with bending DCR, it can be concluded that in evaluating the potential of progressive collapse occurrence by considering the blast loading as the initial reason of failure, DCR criteria should be controlled to shear due to the dominance of shear force.
4.2.2 Criteria for Deformation of
Members
The performance evaluation criteria for nonlinear dynamic analysis procedures are based on plastic hinge rotation and displacement ductility. Table 5 shows the measurement of plastic hinge rotation angle after the formation of plastic hinge [3]. Based on Fig. 29, plastic hinge rotation angle for beam members on each side of the removed column can be measured between horizontal line
and tangent to maximum deflected shape, which is defined by Equation (4):
)
(
tan
1 maxL
(4)
Where, θ is maximum hinge rotation, δmax is
maximum displacement of columns at the location where the column is exposed to blast loads, and L is beam length or column spacing in the longitudinal direction.
Fig. 29.Measurement of plastic hinge rotation
Displacement ductility ratio (μ) is defined as the ratio of maximum displacement to elastic limit.
e
max(5)
where, δmax is maximum displacement of columns
or beams at a reference point, which can be calculated from ABAQUS program, and δe is the
elastic deflection limit at that point, which is the vertical displacement when the first plastic hinge forms [3].
Table 6.Displacement ductility and rotation of hinges in different load cases
Case 1 Case 2
μ θp μ θp
0.0155 1.504 0.0193 1.006
Case 3 Case 4
μ θp μ θp
0.0211 0.731 0.031 0.457
5. Progressive analysis of the 7st
building using APM method
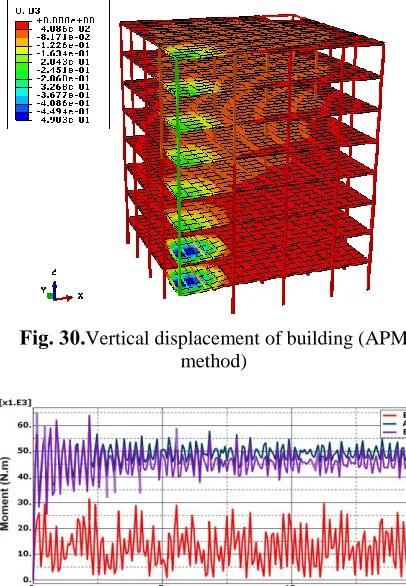
In order to compare the result with the alternative path method, another identical model was also built. This model used the APM for the analysis. In the analysis, the column A5 on ground floor was suddenly removed at the same location of its counterpart. The response of the building was recorded, and extracted from the 3-D finite element model. And the results are shown in the following figures. The comparison of the two methods is shown in Table 7.
Fig. 30.Vertical displacement of building (APM method)
Fig. 31. Moment of columns (APM method)
Fig. 32. Axial force of columns (APM method)
Table 7 is the comparison between the direct applying blast loading method and alternative load path method, it can be seen that, with the alternative path method, after the column was suddenly removed, the axial forces of the adjacent columns increased due to the redistribution of the load. While in the direct applying blast loading method the columns surrounding the explosion are less tolerant of axial forces. Therefore it can be concluded that, the alternative path method is stuffier in predicting the axial force in the columns. Also, as can be seen in Table 7 shear forces of columns in the direct applying blast loading method is much greater than alternative load path method. Therefore, when using the alternative load path method to appraise the strength of the structure, the shear capacity of the column should also be controlled.
Table 7. Result comparison of two methods Force (KN) Column Location at ground level Direct applying blast loading method Alternative load path method Shear
A4 1100 193
B4 1100 187
B5 570 103
Axial
A4 1375 1605
B4 2125 2475
B5 1250 1703
6. Conclusions
Following few points can be concluded from this study:
Structural members close to the blast locations are more vulnerable to blast effects. This implies that external structural members are more exposed to the blast loads and hence, more likely to get damaged.
Applying blast forces to the structures in a linear or centralized form on the stories can lead to error in the results. But in this study, the percentage of error analysis is decreased due to the application of nonlinear loads considering time.
The column which is placed at the internal corner of the building takes the maximum axial force when an external column is exposed to the blast load (Fig. 33). In other words, this internal column reaches the plastic stage later compared with the columns exposed to the blast. Therefore, this column can be considered as a key member in the design of the building against progressive collapse.
The alternate load path method is a method in which the primary cause of the collapse is neglected. While ignoring the primary cause of collapse (Especially blast loads) can lead to an incorrect prediction of the behavior of structures. On the other hand, based on the results of this study the alternative path method ignores the large shear force applied to the column due to the blast loading. Therefore, when using the alternative load path method to appraise the strength of the
structure, the shear capacity of the column should also be controlled.
References
[l] EN 1991-1-7 (2006). Eurocode 1: “Actions on structures Part 1-7: General actions accidental actions”. European Committee for Standardization.
[2] Unified Facilities Criteria (UFC)-DoD. (2005). “Design of buildings to resist progressive collapse”. Department of Defense.
[3] General Services Administration (GSA). (2003). “Progressive collapse analysis and design guidelines for new federal office buildings and major modernization projects”. Washington (DC) Office of Chief Architect.
[4] Feng Fu. (2013). “Dynamic response and robustness of tall buildings under blast loading”. Journal of Constructional Steel Research 80, pp. 299–307.
[5] Marjanishvili, SM. “Progressive analysis procedure for progressive collapse”. (2004). J Perform Constr Facilities ASCE ;18(2):79–85.
[6] Izzuddin BA, Vlassis AG, Elghazouli AY. Nethercot DA. (2008). “Progressive collapse of multi-storey buildings due to sudden column”. loss–Part I: Simplified assessment framework. Eng. Struct.;30:1308–18.
[7] Hartmann D, Breidt M, Nguyen V, Stangenberg F, Hohler S, Schweizerhof K, et al. (2008). “Structural collapse simulation under consideration of uncertainty Fundamental concept and results”. ComputStruct;86:2064– 78.
[8] Moller, B., Liebscher M., Schweizerhof, K., Mattern, S., Blankenhorn, G. (2008). “Structural collapse simulation under consideration of uncertainty Improvement of numerical efficiency”.Comput.Struct. ;86:1875–84.
[9] Song, B., Giriunas, K., Sezen, H. “Progressive collapse testing and analysis of a steel frame building”. (2014). J Constr Steel Res;94:76–83. http://dx.doi.org/10.1016/j. jcsr.2014.11.002. [10] Hosseini, M., Fanaie, N., Yousefi, AM. (2014).
collapse”. Indian J Sci Technol 2014;7(3): 335–42.Eng. Struct.;30:1308–18.
[11] Yousefi, AM., Hosseini, M., Fanaie, N., (2014). “Vulnerability assessment of progressive collapse of steel moment resistant frames”. Trends Appl Sci Res 2014;9(8):450–60. [12] SAP 2000. “Advanced structural analysis
program”. (2009). Version 12.Berkeley, CA, USA: Computers and Structures, Inc. (CSI). [13] Tenth Issue of Iranian National Building Code,
Planning and Construction of Steel, Ministry of Housing and Urban Development, Department of Housing and Construction Office. Developing and Promoting the National Building Regulations, 2013 (In Persian). [14] Iranian National Building Code - 6th Chapter,
Building Loads, Ministry of Housing and Urban Development, Department of Housing and Construction Office, Developing and Promoting National Regulations, 2013. (In Persian).
[15] ABAQUS theory manual. (2003). Version 6.7 Pawtucket, R.I: Hibbitt, Karlsson and Sorensen, Inc.
[16] Richard, L., Hong, C. (2004). “Explosion and Fire Analysis of steel Frames Using Fiber Element Approach”. ASCE Journal of Structural Engineering, 991-1000.
[17] Song, B., Sezen, H., Giriunas, K., (2010). “Experimental and analytical assessment on progressive collapse potential of actual steel frame buildings”. In: ASCE structures conference and North American steel construction conference, Orlando, Florida; May 12–15.
[18] Bagheripourasil, M. (2013). “Evaluation of progressive collapse due to blast loading in steel moment frames”. Master’s thesis. University of Mohaghegh Ardabili.
[19] G, Le., Blanc, M., Adoum, V., Lapoujade. (2005). “External blast load on structures-Empirical Approach”, 5th European LS-DYNA Users conference.
[20] ATBLAST 2.0. (2000). Applied Research Associates.
[21] Yandzio, E., Gough, M. (1999). “Protection of buildings against explosions”. Sci Publication, 244.
[22] Shi, Y., Li, Z., Hao, H. (2010). “A new method for progressive collapse analysis of RC frames under blast loading”. Engineering
Structures.pp.1691-1703.
[23] US Departments of the Army, Navy and Airforce. Technical Manual, Army TM5-1300, Navy NAVFAC P-397, Air Force AFR 88–22, “Structures to resist the effects of accidental explosions”. Washington, DC: US Department of Commerce, National Technical Information Service; 1990.
[24] Hopkinson, B. (1915). British Ordnance board minutes 13565.
[25] Cranz, C. (1926). Lehrbuch der Ballistik. Berlin: Springer.
![Fig.4.The Diagram of Strength Increase Factor [16]](https://thumb-us.123doks.com/thumbv2/123dok_us/8957986.1867354/5.612.92.256.213.379/fig-diagram-strength-increase-factor.webp)
![Fig. 11. Simplified blast-wave overpressure profile with impulse by Yandizo et al. (1999) [21]](https://thumb-us.123doks.com/thumbv2/123dok_us/8957986.1867354/8.612.182.430.535.654/fig-simplified-blast-wave-overpressure-profile-impulse-yandizo.webp)