Visual pathway function and structure in
Wolfram syndrome: patient age, variation
and progression
James Hoekel,1 Anagha Narayanan,2 Jerrel Rutlin,2 Heather Lugar,2 Amal Al-Lozi,2
Tamara Hershey,2,3,4 Lawrence Tychsen1,5
To cite: Hoekel J, Narayanan A, Rutlin J, et al. Visual pathway function and structure in Wolfram syndrome: patient age, variation and progression.
BMJ Open Ophthalmology
2016;0:e000081. doi:10.1136/ bmjophth-2017-000081
Received 14 March 2017 Revised 30 October 2017 Accepted 9 November 2017
1Department of Ophthalmology,
Washington University School of Medicine and St. Louis Children’s Hospital, St. Louis, Missouri, USA
2Department of Psychiatry,
Washington University School of Medicine, St. Louis, Missouri, USA
3Department of Radiology,
Washington University School of Medicine, St. Louis, Missouri, USA
4Department of Neurology,
Washington University School of Medicine, St. Louis, Missouri, USA
5Department of Pediatrics,
Washington University School of Medicine and St. Louis Children’s Hospital, St. Louis, Missouri, USA
Correspondence to
Dr Lawrence Tychsen; tychsen@ wustl. edu
AbsTrACT
background/aims To report alterations in visual acuity and visual pathway structure over an interval of 1–3 years in a cohort of children, adolescents and young adults who have Wolfram syndrome (WFS) and to describe the range of disease severity evident in patients with WFS whose ages differed by as much as 20 years at first examination.
Methods Annual, prospective ophthalmological examinations were performed in conjunction with retinal nerve fibre layer (RNFL) analysis. Diffusion tensor MRI-derived fractional anisotropy was used to assess the microstructural integrity of the optic radiations (OR FA).
results Mean age of the 23 patients with WFS in the study was 13.8 years (range 5–25 years). Mean log minimum angle resolution visual acuity was 0.66 (20/91). RNFL thickness was subnormal in even the youngest patients with WFS. Average RNFL thickness in patients with WFS was 57±8 µ or ~40% thinner than that measured in normal (94±10 µ) children and adolescents (P<0.01). Lower OR FA correlated with worse visual acuity (P=0.006). Subsequent examinations showed declines (P<0.05) in visual acuity, RNFL thickness and OR FA at follow-up intervals of 12–36 months. However, a wide range of disease severity was evident across ages: some of the youngest patients at their first examination had deficits more severe than the oldest patients.
Conclusion The genetic mutation of WFS causes damage to both pregeniculate and postgeniculate regions of the visual pathway. The damage is progressive. The decline in visual pathway structure is accompanied by declines of visual function. Disease severity differs widely in individual patients and cannot be predicted from their age.
InTroduCTIon
Wolfram syndrome (WFS), also known as DIDMOAD, was first described in 1938 by Wolfram and Wagener.1 It is a rare, auto-somal recessive syndrome characterised by a cluster of symptoms including diabetes insipidus (DI), diabetes mellitus (DM), optic nerve atrophy (OA) and sensorineural deafness (D). WFS can result in a shortened lifespan.2 3 WFS is caused by mutations in the WFS1 or WFS2 genes (OMIM 222300). WFS1 encodes a transmembrane protein localised to the endoplasmic reticulum (ER) named
wolframin, which plays a crucial role in main-taining ER homeostasis, including calcium regulation, redox regulation, ER stress signal-ling and cell death.4–8 WFS2 (also known as CISD2) encodes ER intermembrane small protein, which plays a role in ER calcium homeostasis.9 10 WFS is associated with lower volume of the brainstem as well as cerebellum and reduced myelination throughout the brain (Lugar et al; Hershey et al). WFS also damages afferent visual pathway neurons.11–14 The reason for the selective neuronal damage remains unclear.
The Washington University WFS Research Study has examined a cohort of children, adolescents and young adults longitudinally.14–18 Cognitive, neurological, audiological and ophthalmological measures are performed annually using standardised protocols, supplemented by magnetic reso-nance brain imaging (MRI). The current report describes how visual acuity, retinal nerve fibre layer (RNFL) thickness and the optic radiations of the geniculostriate cerebral visual pathways are affected at a cross-section
Key messages
What is known?
The hallmarks of Wolfram syndrome are bilateral optic atrophy, diabetes mellitus and deafness.
What are the new findings?
► First report of follow-up of a large cohort of patients with Wolfram syndrome documenting longitudinal decline in visual acuity and retinal nerve fibre layer.
► First report showing a correlation of subnormal visual acuity in Wolfram syndrome with structural abnormalities of the optic radiations.
How might these results change the focus of clinical practice?
Better appreciation of postgeniculate and pregeniculate visual neuropathy of Wolfram syndrome to use as markers in recently initiated pharmacological therapy trials.
copyright.
on September 12, 2020 by guest. Protected by
of ages and longitudinally. A secondary goal was to show the wide range of disease severity evident in patients with WFS.
subjeCTs And MeTHods
The 23 participants were recruited through the Wash-ington University Wolfram Syndrome Registry website to participate in standardised evaluations across domains known to be associated with WFS at an annual Washington University WFS Research Clinic. Minimal diagnostic criteria to enrol in the registry are: (A) the diagnosis of insulin-dependent DM and optic atrophy by a physician before 18 years of age or (B) genetic confir-mation of a WFS1 mutation. Informed consent from parents for minor participants or from adult participants was obtained prior to study enrolment.
ophthalmic measures
A comprehensive quantitative ophthalmic examination was performed by one of the authors (JH or LT), including documentation of strabismus, nystagmus, binocular perception, pupillary function, slit lamp biomicroscopy and fundoscopic examination. These clinical measures were supplemented by laboratory testing of RNFL thick-ness, Humphrey Visual Field Analysis, colour vision and fundus photography as described in detail in a previous report.18 Here we confine the description to testing of visual acuity and RNFL thickness as measures of disease progression. Best-corrected distance logMAR visual acuity (CDVA) was recorded for each subject using Early Treatment Diabetic Retinopathy Study optotypes.19 RNFL thickness was measured by Optical Coherence Tomog-raphy (OCT, Zeiss CirrusHD-OCT, 4000–5444 version 4.5.1.11; Carl ZeissMeditec, Dublin, California, USA). Normative values for RNFL thickness were obtained from age-matched controls tested in our laboratory who had normal visual acuity and no neuroretinal abnormalities.
diffusion tensor MrI (dT-MrI)
Scans were acquired in awake, unsedated patients on a Siemens 3T Tim Trio MRI scanner at Washington Univer-sity. The DT-MRI echo planar sequence consisted of 27 directions with the b-values ranging from 0 s/mm2 to 1400 s/mm2. Transverse acquisition, TR=12 300, TE=108, voxel resolution=1.98×1.98 × 2 mm, time=5:44 min. DT-MRI optic radiation images were atlas transformed, and measures of white matter microstructural integrity (fractional anisotropy (FA)) were computed.20 21 Prob-abilistic tractography was performed using FMRIB’s Diffusion Toolbox. Masks for tractography were created using FSLView. To track the optic radiations, masks were placed bilaterally on the lateral geniculate nucleus and the striate cortex (area V1) calcarine sulcus, and prob-ability distributions were generated between them. The resulting distributions were then thresholded at 1% to remove extraneous pathways and converted into binary masks for the purpose of extracting mean FA.
statistical analysis
Variables were tested for normality using the Kolmogor-ov-Smirnov test. Measures were obtained for each eye. Visual deficits in WFS are generally symmetrical17 18; in the cohort reported here there were no significant differ-ences between right and left eyes for CDVA (P=0.37) or RNFL thickness (P=0.46). To minimise comparisons and improve clarity in the results, we averaged by combining left and right values. Relationships between age, CDVA and RNFL measures were assessed using Pearson’s r.
Ophthalmological and DT-MRI measures were compared using the related samples Wilcoxon signed rank test for small sample sizes. All analyses were performed employing Statistical Package for the Social Sciences software (SPSS V.22). A P value of <0.05 was considered significant.
resulTs
For the 23 patients included in this analysis, mean age was 13.8 years (range, 5–25 years); median 11.3 years, that is, half of the patients were <12 years of age. Sixty-five per cent (15) were female and 35% (8) were male. Seventy per cent (16) were Caucasian, 13% (3) were Hispanic and 17% (4) were mixed race. Average age at detection of visual impairment by an outside examiner before enrol-ment in the study was 9.1±4.2 years (range 3–17 years). The average time between vision impairment detection and enrolment in the study was 4.8±3.7 years. Impaired vision and optic disc pallor (96% of patients) were diag-nosed when children were examined by an eye care provider after experiencing difficulty with visual tasks in elementary school. The prevalence of ophthalmic find-ings are listed in table 1. These rates are similar to those reported previously in a subset of this cohort.18
At entrance into the study, all 23 patients (100%) were able to cooperate for measurement of CDVA; RNFL measurement was achieved in 20 patients (87%), and DT-MRI scans of the optic radiations were obtained in 19 patients (83%). The combination of low-vision-related Table 1 Prevalence of ophthalmic findings in the 23
patients with Wolfram syndrome
Study parameter
Percentage patients affected Visual acuity <0.3 logMAR 96 (22/23) RNFL thinning ≤80 μ 100 (23/23) Visual field reduced sensitivity and/or
scotoma 100 (23/23)
Dyschromatopsia 96 (22/23)
Optic nerve pallor 96 (22/23) Optic nerve cup:disc ratio ≥0.4 39 (9/23) Afferent pupillary defect 65 (15/23)
Nystagmus 43 (10/23)
Strabismus 43 (10/23)
Cataract 22 (5/23)
logMAR, log minimum angle resolution; RNFL, retinal nerve fibre layer.
copyright.
on September 12, 2020 by guest. Protected by
unsteady visual fixation, neurodevelopmental disability and/or immaturity prevented testing of the RNFL in three patients and contraindications for MRI (eg, cochlear implants and braces) precluded scanning in four patients. Table 2 shows the number of patients who have been enrolled for 1–3 years and thus the number retested at those intervals. About half of patients (11/23) have 3 years of CDVA test data available for longitudinal analysis (table 2).
Age-related trends for visual acuity, rnFl and optic radiation FA
Visual acuity (CDVA) as a function of WFS patient age is shown in figure 1. The CDVA at entrance examina-tion is plotted for each of the 23 patients. Lines joining
data points represent the CDVA obtained at annual follow-up examinations for individual patients. CDVA was a mean 20/91 (logMAR: 0.66), with a range of 20/25 to 20/40 000 (logMAR: 0.9–3.3). CDVA was 20/40 or worse in 91% of patients (21/23).
RNFL thickness is a measure of the health of anterior (pregeniculate) visual pathway axons; RNFL as a function of patient age is shown in figure 2. The RNFL thick-ness at entrance examination is plotted for 20 patients (20/23; three children could not perform the test reli-ably). Lines joining data points represent the CDVA obtained at annual follow-up examinations for individual patients. Seven of the 20 patients (35%) had one or more follow-up RNFL values that exceeded the entrance value (upward slope of the line joining values). It would be difficult to explain these upward deflections as true Table 2 Number of patients tested at entrance
examination into the study and retested at annual follow-up intervals after entrance
Entrance 1-yearfollow-up 2-yearfollow-up 3-yearfollow-up
Visual acuity 23 18 14 11
Retinal nerve
fibre layer 20 14 11 10
DT-MRI optic
radiation FA 19 13 9 6
DT-MRI, diffusion tensor MRI; FA, fractional anisotropy.
Figure 1 Visual acuity (logMAR units) versus patient age. Lines join sequential annual measures of individual patients with WFS. logMAR, log minimum angle resolution; WFS, Wolfram syndrome.
Figure 2 Retinal nerve fibre layer (RNFL) thickness versus age in patients with WFS (white dots) and in age-matched normal subjects (black dots). Lines join sequential annual measures of the same patient with WFS. WFS, Wolfram syndrome.
copyright.
on September 12, 2020 by guest. Protected by
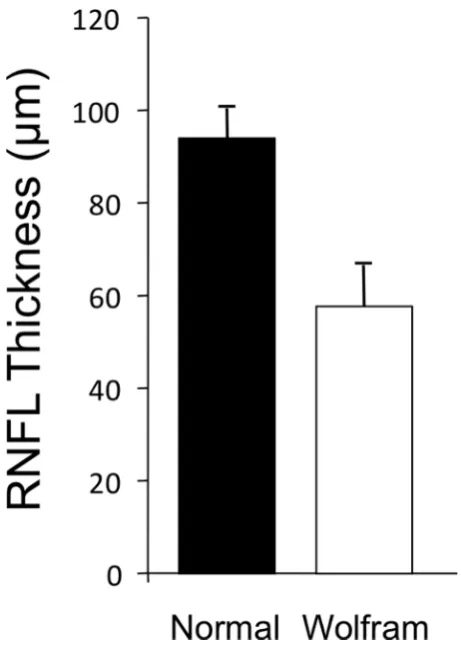
increases in RNFL thickness; they likely represent ‘noise’ inherent in measurement of RNFL in patients who have subnormal vision and fixation instability. RNFL thickness in patients with WFS (figure 3) averaged 57±8 µ, or 40% thinner than that measured in normal (94±10 µ) children and adolescents. The difference between mean RNFL thickness in WFS patients versus controls was significant (year 1, n=20, Z score=−4.30, P<0.01). RNFL thickness was not correlated with CDVA (r=– 0.07, P=0.70).
Optic radiation FA measures the health of posterior (postgeniculate) axons (figure 4). FA is a sensitive indi-cator of white matter injury22 and can detect damage even when standard MR images appear normal.23–27 In patients with WFS, lower optic radiation FA (figure 4) correlated strongly with worse CDVA (year 1, n=19, rs=−0.60, P=0.006).
A downward trend is evident in the regression line of figure 1—worse CDVA at older age—and in the regression line of figure 2—thinner RNFL at older age. However, the data of both figures show a wide range of disease severity. Some young patients with WFS had poor CDVA and thin RNFL, whereas some older patients had comparatively good CDVA and thicker RNFL. The range of severity independent of age is evident in the fact that correlation with age was non-significant for CDVA (P=0.44), RNFL (P=0.11) and optic radiation FA (P=0.94).
In normal adults, thinner RNFL has been associated with older age, longer axial length (AL) of the eye and
smaller optic disc area.28 AL was not measured in our patients so we used spherical refractive error as a proxy; hyperopic eyes tend to be shorter and myopic eyes tend to be longer. Neither age, refractive error nor disc area were correlated with thinner RNFL in our Wolfram cohort (age, P=0.44; spherical refractive error, P=0.13; optic disc area, P=0.39).
There were no significant differences between male and female patients with regard to entrance CDVA (P=0.71), RNFL thickness (P=0.36) or OR FA (P=0.65).
Comparison of entrance year measures to follow-up year measures
To assess disease progression, measures obtained at entrance were compared with measures obtained in successive annual follow-up examinations. Because patients in this longitudinal cohort study are enrolled as they are referred to our centre, patients enrolled earlier in the study have longer follow-up and those enrolled recently have shorter follow-up. Table 1 shows the number enrolled (23 patients) and the lower numbers measured at each year of follow-up.
In the 11 patients measured annually for 3 years, CDVA declined significantly from a mean logMAR 0.61±0.37 to logMAR 0.80±0.42 (Wilcoxon signed rank test, P<0.05). Over the same interval, RNFL thickness declined from an average 59±6 µ to 55±4 µ (P<0.05). Did patients with worse CDVA at the entrance examination and/or thinner RNFL thickness at entrance examination have greater rates of loss at follow-up examinations? To examine this issue, the slope of the loss was calculated for each patient and then correlated with the entrance values. The slopes did not correlate with the entrance values, that is, the most severely affected patients did not have steeper rates of loss (CDVA mean=0.05 logMAR/year, P=0.35; RNFL mean=−0.3 micron/year, P=0.54).
Figure 3 Retinal nerve fibre layer mean thickness for patients with WFS versus controls. WFS, Wolfram syndrome.
Figure 4 Optic radiation fractional anisotropy versus visual acuity (logMAR units) in patients with WFS. Measures obtained at entrance examination. logMAR, log minimum angle resolution; WFS, Wolfram syndrome.
copyright.
on September 12, 2020 by guest. Protected by
For OR FA, the decline from entrance (mean 0.45±0.03) to 1 year follow-up (0.43±0.03; 13 patients) was significant (P<0.05). Lower numbers of patients at the 2-year and 3-year follow-up (nine patients and six patients, respectively) likely account for non-significant statistical declines at the longer OR FA retesting intervals.
dIsCussIon
The goal of the current study was to answer three ques-tions. First, how does visual function and structure relate to patient age in WFS? Second, how widely does visual disease severity range in a sizeable cohort of WFS patients? Third, does visual function decline over time in WFS patients, for both pregeniculate regions of the visual pathway (RNFL) and postgeniculate regions (OR FA)?
Our results show that visual function and structure in WFS are related to patient age. Considering the cohort as a whole, younger patients tend to have better CDVA (figure 1) and RNFL thickness (figure 2) than older patients. All of the patients with WFS—from the youngest at age 5 years to the oldest at age 25 years at entrance into the study—had significantly thinner RNFL thickness than any of the age-matched control subjects (figure 2). However, the variation of disease severity within the WFS cohort is wide. Many younger patients have worse CDVA and a thinner RNFL than some older patients. In patients followed for 3 years, CDVA and RNFL declined signifi-cantly. Zmysloska et al reported recently also decline of RNFL in patients with WFS followed on average 22 months.29
OR FA in patients with WFS has been shown to be reduced significantly compared with both age-matched healthy and diabetic controls14 (diabetic controls are necessary because DM is one of the diagnostic criteria for WFS and DM can impair brain function and struc-ture).27 30–33 OR FA is a sensitive indicator of postlateral geniculate nucleus visual axon health and myelination.22 26 FA measures the movement of water within and parallel to neuronal axonal fibres. In normal children and adoles-cents, FA increases with age.34 When axons or myelin are damaged, FA can decrease.23 Previous analyses have found that OR FA is lower in patients with WFS than in controls.35 We found a significant correlation between optic radiation FA and CDVA in our WFS patients (figure 4). Lower OR FA was associated with lower CDVA. Taken together, these results indicate damage to prege-niculate (RNFL) and postgeprege-niculate visual axons (OR FA) in WFS. The results allow better appreciation of the postgeniculate and pregeniculate visual neuropathy of WFS. These functional and structural tests may be helpful as outcome measures in future therapeutic trials.
In previous reports of entrance examination findings in a portion of this WFS cohort, the phenotypic charac-teristics were catalogued.17 18 The visual characteristics included subnormal CDVA, impaired colour vision, visual field deficits, vision loss-related nystagmus, strabismus, afferent pupillary defects and optic nerve head pallor. A previous report of neuroimaging compared a portion of
this WFS cohort to age-matched controls.14 That report documented that WFS patients have reduced brainstem (midbrain; pons) and cerebellar volumes at early ages. The reduction of RNFL thickness, OR FA, brainstem and cerebellar volumes at even the earliest ages imply that the brain abnormalities of WFS are both neurodevelop-mental and neurodegenerative. The WFS1 mutations may cause hypoplasia of neurons and their axonal projec-tions, as well as gradual atrophy of neurons. The current study documents that the neuronal damage—while vari-able across patients with WFS—encompasses the anterior as well as the posterior visual pathway and worsens with age.
Acknowledgements We thank the Washington University Wolfram Syndrome
Research Group (P Austin, MD (Surgery); B Beato, BA (Psychiatry); E Bihun, MA (Psychiatry); A Bischoff, BA (Psychiatry); G Earhart, PhD (Physical Therapy); S Eisenstein, PhD (Psychiatry); J Hoekel, DO (Ophthalmology); R Karzon, PhD (Audiology & Comm. Sciences); A Licis, MD (Neurology); H Lugar, MA (Psychiatry); L Manwaring, MS (Pediatrics); A R Paciorkowski, MD (Neurology, URMC); Y Pepino de Gruev, PhD (Medicine); A Permutt, MD (Medicine) (deceased); K Pickett, PhD (Physical Therapy, U Wisconsin); A Reiersen, MD (Psychiatry); J Rutlin, BS (Psychiatry); J Shimony, MD, PhD (Radiology); L Tychsen, MD (Ophthalmology); F Urano, MD, PhD (Medicine) – International Wolfram Registry Director); A Viehoever, MD (Neurology – UCSF); J Wasson, MS (Medicine) (deceased); N H White, MD, CDE (Pediatrics)) for their contributions to the larger study and the patients and their families for their participation in this research.
Contributors JH designed and executed the ophthalmological work, including
interpretation and analysis. LT designed, analysed, interpreted, wrote and revised the manuscript; he is responsible for overall content. TH designed the parent study on Wolfram syndrome (HD070855), directed the neuroimaging data collection, analysis and interpretation and assisted in manuscript writing. AN prepared and analysed data used in this manuscript. AA-L assisted in data analysis and manuscript planning. HL and JR designed, analysed and interpreted the neuroimaging data.
Funding This work was supported by the NICHD (HD070855; Hershey, PI) and
supported by CTSA (UL1 RR024992) and Diabetes Research Center (DK 020579), the Jack and JT Snow Foundation, American Diabetes Association (Permutt/Urano), the George Decker and Julio V Santiago Pediatric Diabetes Research Fund.
Competing interests None declared.
ethics approval The study was approved by the Institutional Review Board of
Washington University in St. Louis.
Provenance and peer review Not commissioned; externally peer reviewed.
open Access This is an Open Access article distributed in accordance with the
Creative Commons Attribution Non Commercial (CC BY-NC 4.0) license, which permits others to distribute, remix, adapt, build upon this work non-commercially, and license their derivative works on different terms, provided the original work is properly cited and the use is non-commercial. See: http:// creativecommons. org/ licenses/ by- nc/ 4. 0/
© Article author(s) (or their employer(s) unless otherwise stated in the text of the article) 2018. All rights reserved. No commercial use is permitted unless otherwise expressly granted.
reFerenCes
1. Wolfram DG, Wagener HP. Diabetes mellitus and simple optic atrophy among siblings: report of four cases. Mayo Clin Proc
1938;13:715–8.
2. Barrett TG, Bundey SE, Fielder AR, et al. Optic atrophy in Wolfram (DIDMOAD) syndrome. Eye 1997;11 (Pt 6):882–8.
3. Inoue H, Tanizawa Y, Wasson J, et al. A gene encoding a
transmembrane protein is mutated in patients with diabetes mellitus and optic atrophy (Wolfram syndrome). Nat Genet 1998;20:143–8. 4. Fonseca SG, Ishigaki S, Oslowski CM, et al. Wolfram syndrome 1 gene negatively regulates ER stress signaling in rodent and human cells. J Clin Invest 2010;120:744–55.
copyright.
on September 12, 2020 by guest. Protected by
5. Riggs AC, Bernal-Mizrachi E, Ohsugi M, et al. Mice conditionally lacking the Wolfram gene in pancreatic islet beta cells exhibit diabetes as a result of enhanced endoplasmic reticulum stress and apoptosis. Diabetologia 2005;48:2313–21.
6. Takeda K, Inoue H, Tanizawa Y, et al. WFS1 (Wolfram syndrome 1) gene product: predominant subcellular localization to endoplasmic reticulum in cultured cells and neuronal expression in rat brain. Hum Mol Genet 2001;10:477–84.
7. Yamada T, Ishihara H, Tamura A, et al. WFS1-deficiency increases endoplasmic reticulum stress, impairs cell cycle progression and triggers the apoptotic pathway specifically in pancreatic beta-cells.
Hum Mol Genet 2006;15:1600–9.
8. Thomas SE, Dalton LE, Daly ML, et al. Diabetes as a disease of endoplasmic reticulum stress. Diabetes Metab Res Rev
2010;26:611–21.
9. Amr S, Heisey C, Zhang M, et al. A homozygous mutation in a novel zinc-finger protein, ERIS, is responsible for Wolfram syndrome 2. Am J Hum Genet 2007;81:673–83.
10. Mozzillo E, Delvecchio M, Carella M, et al. A novel CISD2 intragenic deletion, optic neuropathy and platelet aggregation defect in Wolfram syndrome type 2. BMC Med Genet 2014;15:88.
11. Yamamoto H, Hofmann S, Hamasaki DI, et al. Wolfram syndrome 1 (WFS1) protein expression in retinal ganglion cells and optic nerve glia of the cynomolgus monkey. Exp Eye Res 2006;83:1303–6. 12. Kawano J, Tanizawa Y, Shinoda K. Wolfram syndrome 1 (Wfs1)
gene expression in the normal mouse visual system. J Comp Neurol
2008;510:1–23.
13. Schmidt-Kastner R, Kreczmanski P, Preising M, et al. Expression of the diabetes risk gene wolframin (WFS1) in the human retina. Exp Eye Res 2009;89:568–74.
14. Hershey T, Lugar HM, Shimony JS, et al. Early brain vulnerability in Wolfram syndrome. PLoS One 2012;7:e40604.
15. Pickett KA, Duncan RP, Hoekel J, et al. Early presentation of gait impairment in Wolfram syndrome. Orphanet J Rare Dis 2012;7:92. 16. Nguyen C, Foster ER, Paciorkowski AR, et al. Reliability and validity
of the Wolfram Unified Rating Scale (WURS). Orphanet J Rare Dis
2012;7:89.
17. Marshall BA, Permutt MA, Paciorkowski AR, et al. Phenotypic characteristics of early Wolfram syndrome. Orphanet J Rare Dis
2013;8:64.
18. Hoekel J, Chisholm SA, Al-Lozi A, et al. Ophthalmologic correlates of disease severity in children and adolescents with Wolfram syndrome.
J Aapos 2014;18:461–5.
19. Holmes JM, Beck RW, Repka MX, et al. The amblyopia treatment study visual acuity testing protocol. Arch Ophthalmol
2001;119:1345–53.
20. Basser PJ, Mattiello J, LeBihan D. MR diffusion tensor spectroscopy and imaging. Biophys J 1994;66:259–67.
21. Shimony JS, McKinstry RC, Akbudak E, et al. Quantitative diffusion-tensor anisotropy brain MR imaging: normative human data and anatomic analysis. Radiology 1999;212:770–84.
22. Mukherjee P, Bahn MM, McKinstry RC, et al. Differences between gray matter and white matter water diffusion in stroke: diffusion-tensor MR imaging in 12 patients. Radiology 2000;215:211–20. 23. Beaulieu C. The basis of anisotropic water diffusion in the nervous
system - a technical review. NMR Biomed 2002;15:435–55. 24. Pfefferbaum A, Sullivan EV, Hedehus M, et al. Age-related
decline in brain white matter anisotropy measured with spatially corrected echo-planar diffusion tensor imaging. Magn Reson Med
2000;44:259–68.
25. Bjorntorp P. White matter changes and metabolic alterations. In: Pantoni L, Inzitari D, Wallin A, eds. The matter of white matter. Utrecht: Hoonte Bosch and Keuning, 2000:325–34.
26. Sierra C, de La Sierra A, Mercader J, et al. Silent cerebral white matter lesions in middle-aged essential hypertensive patients.
J Hypertens 2002;20:519–24.
27. Ferguson SC, Blane A, Perros P, et al. Cognitive ability and brain structure in type 1 diabetes: relation to microangiopathy and preceding severe hypoglycemia. Diabetes 2003;52:149–56. 28. Budenz DL, Anderson DR, Varma R, et al. Determinants of normal
retinal nerve fiber layer thickness measured by Stratus OCT.
Ophthalmology 2007;114:1046–52.
29. Zmyslowska A, Fendler W, Waszczykowska A, et al. Retinal thickness as a marker of disease progression in longitudinal observation of patients with Wolfram syndrome. Acta Diabetol
2017;54:1019–24.
30. Perantie DC, Wu J, Koller JM, et al. Regional brain volume
differences associated with hyperglycemia and severe hypoglycemia in youth with type 1 diabetes. Diabetes Care 2007;30:2331–7. 31. Perantie DC, Koller JM, Weaver PM, et al. Prospectively determined
impact of type 1 diabetes on brain volume during development.
Diabetes 2011;60:3006–14.
32. Musen G, Lyoo IK, Sparks CR, et al. Effects of type 1 diabetes on gray matter density as measured by voxel-based morphometry.
Diabetes 2006;55:326–33.
33. Wessels AM, Simsek S, Remijnse PL, et al. Voxel-based morphometry demonstrates reduced grey matter density on brain MRI in patients with diabetic retinopathy. Diabetologia
2006;49:2474–80.
34. Lebel C, Beaulieu C. Longitudinal development of human brain wiring continues from childhood into adulthood. J Neurosci
2011;31:10937–47.
35. Lugar HM, Koller JM, Rutlin J, et al. Washington University Wolfram Syndrome Research Study Group. Neuroimaging evidence of deficient axon myelination in Wolfram syndrome. Sci Rep
2016;6:21167–.
copyright.
on September 12, 2020 by guest. Protected by