in Geophysics
cEuropean Geosciences Union 2003
Instability patterns between counter-rotating disks
F. Moisy, T. Pasutto, and M. Rabaud
Laboratoire FAST, Bˆat. 502, Campus Universitaire, F-91405 Orsay Cedex, France Received: 15 July 2002 – Revised: 22 November 2002 – Accepted: 25 November 2002
Abstract. The instability patterns in the flow between counter-rotating disks (radius to heigh ratioR/ h from 3.8 to 20.9) are investigated experimentally by means of visu-alization and Particle Image Velocimetry. We restrict our-selves to the situation where the boundary layers remain sta-ble, focusing on the shear layer instability that occurs only in the counter-rotating regime. The associated pattern is a combination of a circular chain of vortices, as observed by Lopez et al. (2002) at low aspect ratio, surrounded by a set of spiral arms, first described by Gauthier et al. (2002) in the case of high aspect ratio. Stability curve and critical modes are measured for the whole range of aspect ratios. From the measurement of a local Reynolds number based on the shear layer thickness, evidence is given that a free shear layer in-stability, with only weak curvature effect, is responsible for the observed patterns. Accordingly, the number of vortices is shown to scale as the shear layer radius, which results from the competition between the centrifugal effects of each disk.
1 Introduction
The flows between rotating disks, or von K´arm´an (1921) swirling flows, occur in a variety of situations, from indus-trial to geophysical applications. Of practical interest for lab-oratory experiments is the case of finite disks, for which no similarity solutions exist (Zandbergen and Dijkstra, 1987). The stability of these flows have been addressed since a long time, mostly in the rotor-stator configuration, i.e. between one rotating disk and one stationary disk.
In confined geometry with rotating endwall and large ra-dius to height ratioR/ h, two classes of instabilities are ob-served. On the one hand, instabilities occur on the inward boundary layer over the slower rotating disk, and result in axisymmetric propagating circles or spiral rolls. The latter pattern received the name of positive spirals (Gauthier et al., 2002), because they roll up to the center in the direction of
Correspondence to: F. Moisy ([email protected])
the faster disk. These two patterns are also present in the rotor-stator flow, where they have been widely studied both numerically and experimentally (Schouveiler et al., 1998; Gauthier et al., 1999; Serre et al., 2001). As shown by Gau-thier et al. (2002), the differential rotation only weakly af-fects the properties of these boundary layer instabilities (e.g. it linearly shifts the instability thresholds or the onset modes). The counter-rotating case appears to be much richer: in addition to boundary layer instabilities, it has been recently recognized that the counter-rotating flow at high enough ro-tation ratio also shows free shear layer instability. In a cavity
R/ h=2, at a fixed value of the Reynolds number, Lopez et al. (2002) first observed instability of wavenumber 4 and 5 in the counter-rotating flow, in the form of “funnel-like” vor-tices, that they attributed to a free shear instability. For a very different aspect ratioR/ h=20.9, Gauthier et al. (2002) re-ported a new instability pattern of wavenumber 9 to 11, in the form of a spiral pattern not confined to the boundary lay-ers, but rather filling the whole gap between the disks. This pattern received the name of negative spirals, since they roll up to the center in the direction of the slower disk. Gauthier et al. (2002) suggested that a free shear layer was responsible for this instability too, raising the issue of a possible conti-nuity with the observations of Lopez et al. (2002).
δb (B.f.)
r
st rz Ωt
Ωb
δt
Fig. 1. Sketch of the flow in the meridian plane in the
counter-rotation flow at high enough counter-rotation ratio. δt andδbrefer to the
top (faster) and bottom (slower) boundary layer thicknesses. The dashed arrow indicate the meridian recirculation flow, separated into two cells ending on a stagnation circle atr=rston the slower
disk. B.f.(Batchelor flow) is a quasi-solid body rotation between the two boundary layers.
ratios of these two experiments are very different, it is very likely that the same instability mechanism is responsible for the two patterns.
The influence of the curvature and rotation on the stability of free shear layers received considerable interest. In addi-tion to the Kelvin-Helmholtz instability, also present for lin-ear non-rotating shlin-ear layers, centrifugal effect may occur, stabilizing or destabilizing the perturbation (Yanase et al., 1993; Liou, 1994). The extreme case where rotation dom-inates the dynamics (small Rossby number) is of great im-portance in geophysical flows (the so-called barotropic in-stability). After the pioneering experimental work of Hide and Titman (1967), laboratory experiments aiming to model such instability are based on the differential rotation of a disk in a rapidly rotating tank (Niino and Misawa, 1984) or a cylindrical split-annulus tank (Fr¨uh and Read, 1999). How-ever, these experiments focus on weak shears compared to the background rotation. Closer to our experiment, Rabaud and Couder (1983) have investigated the stability of a 2-D forced circular shear layer in a split-annulus tank, further studied numerically by Chomaz et al. (1988) and Bergeron et al. (2000). Although in these experiments the rotation only weakly affects the shear layer instability, they observe circu-lar chains of eddies as well, the number of which decreasing with the Reynolds number. A recent review on these studies can be found in Dolzhanskii et al. (1990).
In the present paper we report new observations of the in-stability patterns in the counter-rotating flow for a range of intermediate aspect ratioR/ h(values between 3.8 to 20.9). We restrict ourselves to the situation where the boundary lay-ers remain stable: axisymmetric propagating vortices and positive spirals are not considered here. Section 2 briefly presents the experimental set-up and the two investigation techniques, namely visualization and Particle Image Veloc-ity measurements. In Sect. 3 the main characteristics of the instability patterns, such as onset curve and critical modes, are presented. The structure of the velocity field of the pat-tern is presented in Sect. 4, together with an analysis of in-stability in terms of local Reynolds number based on the free shear layer. Some concluding remarks are finally offered in
h R
Fig. 2. Experimental set-up. The dashed part (top disk and lateral
endwall) rotate together, while the black part (bottom disk) rotates independently.
Sect. 5.
2 Experimental set-up
The experimental set-up, sketched in Fig. 2, consists in a ro-tating cylinder of radiusR = 140 mm, in which a disk of same radius located at the bottom of the cavity rotates at a different speed. The cylinder and its upper cover (top disk) are made of Plexiglas, to allow visualizations from above and from the side, while the bottom disk is made of black brass to improve visualization contrast. The thickness of the cellhcan be varied from a few mm to 5 cm, using wedges between the upper disk and the cylinder rim. The angular velocities of the disks can be set independently, from 0 to 10 rad.s−1, in the same direction (corotation) or in opposite direction (counter-rotation). In this paper we are only con-cerned with the counter-rotation case, where the faster disk is the top one,|t| ≥ |b|. The working fluid is a mixture of water and glycerol of kinematic viscosity lying in the range 1.0×10⁻⁶< ν <4.0×10⁻⁶m2/s at 20oC.
The flow is characterized by three dimensionless numbers, two Reynolds numbers based on each disk velocity and the aspect ratio 0 = R/ h. Since two lengthscales, R andh, are present in this geometry, freedom exists in the definition of the Reynolds numbers. We choose the Reynolds numbers based on the thickness of the cellRei = ih2/ν (Dijkstra and van Heijst, 1983), wherei=t, bdenotes the top and bot-tom disks. In the case of close coaxial disks, these Reynolds numbers allow to distinguish between separated and merged boundary layers situations. We will also make use of alter-nate Reynolds numbers, based on the thickness and the pe-ripheral velocitiesiR,
0Rei =iRh/ν.
These Reynolds numbers are of interest when focusing on the free shear layer instability of the counter-rotating flow, as shown in Sect. 3. In the present study, the Reynolds numbers
Qualitative insight of the flow structure is obtained from visualization of the light reflected by anisotropic flakes seed-ing the flow (Kalliroscope). In this case the flow is illumi-nated by a concentric circular light source, and pictures are obtained from above using a CCD camera located along the disks axis. Although no direct information of the velocity field can be obtained from this method, quantities such as the wavelength or phase velocity of the structures can be ex-tracted from the spatial variation of the reflected light (Gau-thier et al., 1998).
More quantitative measurements have been performed us-ing a Particle Image Velocimetry (PIV) apparatus1. Small glass particles (11µm in diameter) seeding the flow are used as tracer, illuminated by a double pulsed Nd:Yag laser sheet of thickness 0.5 mm. Pictures are obtained from a double-buffer high resolution camera (12 bits, 1024×1280 pixels), synchronized with the laser at a rate of 4 frame pairs per sec-ond. Two kinds of PIV measurements can be performed. On the one hand, the structure of the basic flow in the meridian plane can be studied using a vertical laser sheet. On the other hand, the bifurcated patterns can be visualized using an hori-zontal laser sheet between the two disks and a camera above. The time between two frames within a pair is set to 40 ms for the horizontal fields, and has to be decreased down to 4 ms for the meridian field, for which the azimuthal (out of plane) velocity component is important. The velocity fields have a resolution of 1×1 mm for horizontal frames, and down to 0.5×0.5 mm for vertical frames. They are averaged over 4 successive individual velocity fields (i.e. 1 s). Because of the laser sheet thickness, reliable velocity fields cannot be ob-tained at small disk separationh, and PIV measurements are restricted toh >12 mm (R/ h <11.7).
3 Stability curve and critical modes
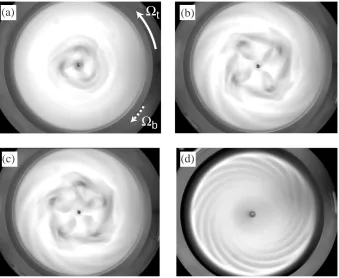
At high enough Reynolds numbers, the counter-rotating flow gives rise to instability patterns such as the ones shown in Fig. 3. They consist in a circular chain of vortices surrounded by a set of spirals. These spirals received the name of
nega-tive spirals (Gauthier et al., 2002), because they roll up to the
center in the direction of the slower disk. Depending on the mode and the aspect ratio, only the circular chain of eddies or the negative spirals may be observed. Low aspect ratios
R/ hand/or low modes essentially lead to eddies (Figs. 3a, b), while higher aspect ratios and/or higher modes mostly show negative spirals (Fig. 3d). Intermediate modes, roughly between 4 and 7, usually shows a combination of the two as-pects of the pattern (Figs. 3b, c). These patterns generally rotate in the direction of the faster (top) rotating disk, with a phase velocity of order 0.2t – except for the largest as-pect ratio, where slightly negative phase velocities have been observed.
The relationship between the light intensity reflected by the flakes and the velocity gradient tensor field of the flow
1Package “Flowmaster 3”, LaVision GmbH.
is non trivial in the general case (Savas, 1985; Gauthier et al., 1998). Although the intensity field may represent the depth-averaged orientation of the flakes (at least in low seed-ing regime), screenseed-ing effects from the upper regions may considerably alter the interpretation of the observed patterns, so that the depth of the structures can not be inferred from the visualizations of Fig. 3. However, visualizations of the light intensity on a meridian plane may give indication of the axial extension of these structures in the case of large aspect ratio. From these observations, Gauthier et al. (2002) show that the negative spirals are not confined in a boundary layer, but rather fill the whole gap between the two disks.
The stability curve of these patterns is shown in Fig. 4 for different aspect ratios. These curves are obtained by slowly increasing the bottom disk angular velocitybat fixed value of t. No hysteresis is observed within our experimental uncertainty, around 3%. When plotted as functions of the Reynolds numbers (0Ret, 0Reb), the different curves ap-pear to collapse into a single master curve. The fact that the chain of vortices and negative spirals share the same onset curve suggests that they both arise from the same instability mechanism, although the nonlinear saturation leads to very different morphology. We note that at high Reynolds num-ber, the onset is well described by a single dimensionless pa-rameter, the counter-rotation ratio
s=Reb
Ret
' −0.135±0.010.
However, at lower Reynolds numbers, this linear curve ap-pears to saturate towards a finite bottom Reynolds number, −0Reb'230±20.
The collapse of the curves for different aspect ratios gives indication for the mechanism responsible of the instability, because the shear and the boundary layers behave differently when R/ h is varied. At given disks velocities, increasing the gaphdecreases the shear strength but does not affect the boundary layers thickness, which are governed by the faster (top) disk velocity,δ ∼ (ν/ t)1/2. If the instability would have arise from a boundary layer, one would expect the onset curves to collapse when plotted as functions of the Reynolds numbers based on the radius of the cell02Rei = iR2/ν. By contrast, if we now assume that the growth rate is con-trolled by the shearγ ∼R/ h, damped by viscous diffusion on a timescaleτv ∼ h2/ν, this leads to the natural control parameterγ τv =Rh/ν =0Re. (Takinghas the relevant lengthscale for the shear layer thickness will be discussed in more details in Sect. 4). So the master curve obtained in Fig. 4 suggests that a shear layer instability is responsible for the different patterns observed in Fig. 3.
The observed patterns arise through a supercritical Hopf bifurcation (Gauthier et al., 2002). At fixed top Reynolds numberRet, the growth time is shown to scale as(Reb −
(a)
(b)
(c)
(d)
Ω
t
Ω
b
Fig. 3. Instability patterns visualized by Kalliroscope. (a)0=7.0,Ret=282,Reb=41.2,m=3. (b)0=7.0,Ret =282,Reb=47.1,
m=4. (c)0=7.0,Ret =282,Reb=51.8,m=5. (d)0=20.9,Ret =46,Reb=10.5,m=11. Disks rotation are the same for all
pictures, and are indicated by the arrows on picture (a).
0 100 200 300 400 500 600
0 1000 2000 3000 4000 5000
-Γ
Re
b
Γ
Re
t unstable
stable
Fig. 4. Stability curve of negative spirals for aspect ratios0 =
R/ h=6.1 (O), 7.0 (◦), 10.8 (), 14.0 (×) and 20.9 (+). The dashed lines show the constant counter-rotation ratio s = Reb/Ret = −0.135 and the saturation value−0Reb'230.
Important characteristics of this instability is the azimuthal mode of the pattern. Slowly approaching the onset curve from below, we observe a well defined fundamental mode
mc, which can be just viewed as the number of vortices or spiral arms. It is worth pointing out that, although no hys-teresis is observed for the instability threshold, noticeable
hysteresis is present for the onset mode. Going slightly above the onset, higher order modes quickly arise, replacing or su-perimposing to the fundamental mode.
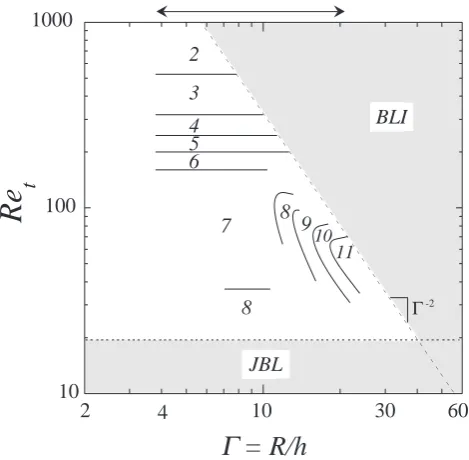
The onset modes are summarized in Fig. 5 in the plane
(R/ h, Ret). For each value of the top Reynolds numberRet, the bottom Reynolds numberRebhas been fixed at its tran-sition value. In this diagram, the instability is restricted to a triangular domain limited by two border lines, delimiting two regions notedJ BL, as “joined boundary layers”, andBLI, as “boundary layer instability”.
The lower border line, J BL, corresponds to the case where the boundary layers fill the whole gap between the disks. From the measurements of Gauthier et al. (2002) at
R/ h=20.9, both the top and bottom boundary layer thick-nesses,δt andδb, were shown to scale asδ0 = (ν/ t)1/2, i.e. with the top (faster) disk. The top boundary layer thickness is given byδt/δ0 ' 2.2, while the bottom one is
δb/δ0 ' f (r/R, Reb/Ret), where the function f lies be-tween 2 and 4.5. One may then deduce a rough estimate for the Reynolds number where boundary layer merging occurs (δt +δb=h) for allr,
Ret =th2/ν'(2+2.2)2'18.
10 100 1000
2 10 30 60
Re
t
Γ
= R/h
JBLBLI 2
3
4 5 6
7
11
10
8 8
9
4
Γ-2
Fig. 5. Regime diagram of the onset modes, as functions of the
as-pect ratioR/ hand the Reynolds number of the (top) faster rotating diskRet. Modes betweenm=2 and 11 are observed. The upper
horizontal arrow indicates the range of aspect ratio spanned in the present experiment. The dashed lines delimit the “Joined boundary layers” domain (J BL,Ret <18) and the “Boundary layer
instabil-ity” domain (BLI,Ret>31×1030−2).
allr < R, leading to a border linetR2/ν=Rec, or equiv-alentlyRet =th2/ν =Rec/ 02. This is indeed the case, and we determine experimentallyRec ' 31×103. Note that although measurements of the critical mode were some-times possible slightly beyond this upper limit, we choose to restrict to the situation where the boundary layers remain stable.
We note that the two constrainsJ BL andBLI suggest that the counter-rotating instability should not be observed for aspect ratiosR/ h >40, where the two border lines in-tersect. However, the present experiment being limited to
0=20.9, this upper bound has not been tested experimen-tally.
For low aspect ratio,R/ h < 10, the critical modemis found to be fully controlled by the top Reynolds numberRet. It decreases as the Reynolds number is increased, from 8 down to 2 (see Fig. 6 forR/ h = 5.15). This behavior is surprisingly similar to the decrease found in the experiments cited in the Introduction; in particular, it compares well with the power lawm∼ Re−3/4proposed by Dolzhanskii et al. (1990) (see also van de Konijnenberget al., 1999) from scal-ing argument. However, in our experiment, this decrease is believed to originate from another mechanism, namely the decrease of the radius of the shear layer annulus for increas-ing Reynolds numbers, as described in Sect. 4.
For higher aspect ratiosR/ h >10, this behavior does not hold any more and becomes much more complex. Regions
1 10
102 103 104
m
Γ
Re
tFig. 6. Number of vortices as a function of0Ret forR/ h=5.15.
The line shows a power lawm∼0Re−t 3/4.
of higher order modes appear, as tentatively drawn in Fig. 5 in the form of interpenetrating tongues. This phenomenon leads, for high enough aspect ratio, to a situation where the critical mode increases for increasing Reynolds numbers, in contrast with the low aspect ratio case. This latter behavior is in agreement with the results of Gauthier et al. (2002) at
R/ h = 20.9, where modes 9, 10 and 11 were reported for increasing Reynolds numbers.
4 Velocity measurements and onset of instability
Further insight into the instability mechanism can be achieved from the velocity fields of the basic flow and the instability patterns in the close vicinity of the onset curve. Due to the experimental limitations detailed in Sect. 2, ve-locity measurements have only been performed at low aspect ratio,R/ h <10. The measurements shown here have been obtained in the particular caseR/ h=7.
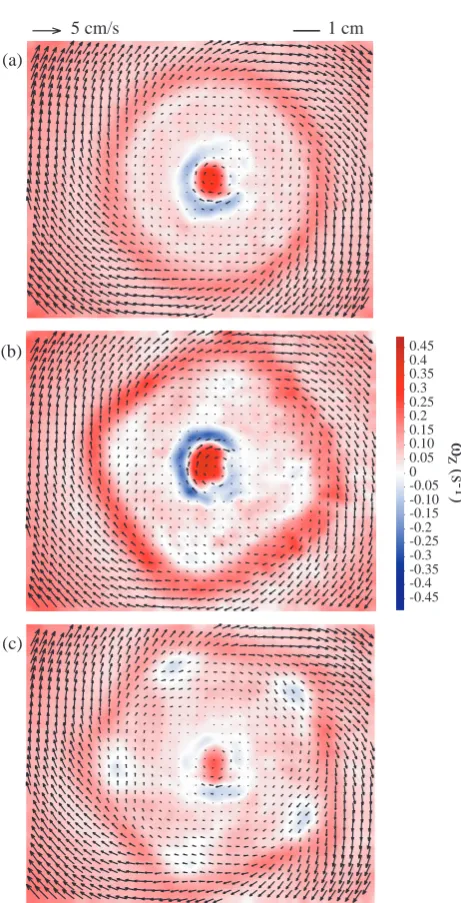
Three velocity fields and the corresponding vorticity z -componentωz=∂u/∂y−∂v/∂xare shown in Fig. 7. Only 1/4th of the velocity vectors are shown for clarity, but the vorticity field is computed from the whole measured veloc-ity field (here 80×64 vectors). Note that the central part of the fields (in a centered circle of radius ' 3 vectors) is not resolved, due to optical defects in the center of the upper disk.
Below the instability threshold, the velocity field is ax-isymmetric, as shown in Fig. 7a. Its most striking feature is the important concentration of vorticity separating an in-ner and outer parts in quasi-solid body rotation. Velocity fields measured at differentzaroundh/2 shows little vari-ation of the radius of this shear layer, which can thus be seen as merely vertical.
-0.45 -0.4 -0.35 -0.3 -0.25 -0.2 -0.15 -0.10 -0.05 0 0.05 0.10 0.15 0.2 0.25 0.3 0.35 0.4 0.45
ω
z
(s
-1
)
(a)
(b)
(c)
5 cm/s 1 cm
Fig. 7. Velocity field (arrows) and vorticityωz(color) at mid-height
z=h/2 for0=7,0Ret =251. (a)0Reb'36. (b)0Reb=38
(just at the onset), (c)0Reb = 42. Velocity, vorticity and length
scales are shown in the figure.
(here a transitionm= 4 → 5 is observed). A chain of co-rotating vortices, with vorticity opposite to that of the shear layer, appears in the corners of the polygon.
Radius and thickness of the annular shear layer have been measured just before transition for different Reynolds num-bers. The radiusR0is defined as the location of maximum vorticityωz, while the thicknessδis estimated from distance between the surrounding velocity extrema. Only the horizon-tal projection of the thickness can be measured. However, since the shear layer was shown to be almost vertical, the apparent thickness gives a reasonable estimate of the actual one. This thickness is of order of the gap between the disks,
0.0
0.2
0.4
0.6
0.8
1.0
0
1000
2000
3000
Γ
Re
t
R
0
/R
Fig. 8. Radius of the annular shear layer at onset, measured at
mid-height, as a function of0Ret(0=7).
δ '(0.6±0.1)h, and shows no significative variation with the Reynolds number.
Measurements of the shear layer radiusR0, normalized by the disk radius R, are shown in Fig. 8 forR/ h = 7 as a function ofRet just below the onset of the instability. For increasing Reynolds numbers, R0/R decreases from 0.5 to 0.2, indicating that the faster rotating disk develops a much stronger recirculation cell than does the slower rotating disk. As a result, the stagnation circle, responsible for the inward boundary layer detachment, gets confined to smaller radii (Gauthier et al., 2002), and the same goes for the shear layer radiusR0.
For increasing Reynolds number, along the stability curve, the angular velocity difference 1 across the shear layer increases, while its radiusR0 decreases. One may wonder whether the associated velocity difference∼R01takes a constant value at the onset. In order to check this point, one may determine a local Reynolds number based on the shear layer,
Reδ=
1U δ
ν ,
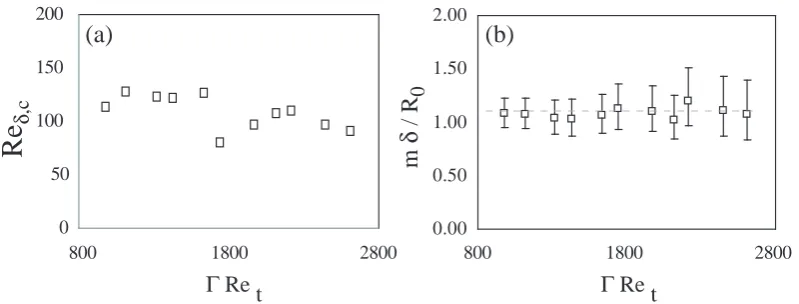
where1U is the velocity difference across the shear layer. Fig. 9a shows measurements ofReδfor0=R/ h=7 as a function of0Retjust below the stability curve. Although the Reynolds number of the faster rotating disk0Ret has been varied from 980 to 2610, the critical local Reynolds number
Reδ,cremains roughly constant, giving evidence thatReδis the relevant local control parameter for this instability. Al-though the scatter is important, mainly due to the precision in the measurement ofδ, the critical local Reynolds number is essentially constant,
Reδ,c'110±20.
0 50 100 150 200
0.00 0.50 1.00 1.50 2.00
800 1800 2800
m
δ
/ R
0
Γ
Re t
Re
δ
,c
800 1800 2800
Γ
Re t
(a)
(b)
Fig. 9. (a) Critical local Reynolds numberReδ,c based on the shear layer thickness as a function of0Ret for0=7. (b) Corresponding
normalized wavenumbermδ/R0.
higher value may be due to the overestimation of the apparent shear layer thickness, or to some stabilizing effect due to the non purely vertical shape of the circular shear layer.
This constant value ofReδ at onset supports the mecha-nism of a shear layer instability. As a result, the size of vor-tices is expected to scale as the thicknessδ. This is indeed the case, as shown in Fig. 9b where the normalized wavenumber
mδ/R0is plotted as a function of0Ret. The observed con-stant value,
mδ R0
'1.10±0.15,
confirms this scenario, leading to a wavelength λ = 2π R0/m' (5.7±0.8)δ. One may conclude that, for low aspect ratio, the decrease of the mode for increasing Ret, shown in Fig. 5, can be explained from the decrease ofR0, resulting from the centrifugal competition of the basic flow.
5 Conclusion
In this paper we have reported new observations of instability patterns between counter-rotating disks, spanning a range of aspect ratio0 =R/ hbetween 3.8 and 20.9. We restricted ourselves to the situation where the boundary layers remain stable, focusing on the shear layer instability that occurs only in the counter-rotating regime. The associated pattern is a combination of a circular chain of vortices surrounded by a set of spirals (called negative spirals, because they roll up to the center in the direction of the slower disk). At small aspect ratioR/ hand/or large velocity, only the chain of vortices is observed, while at higherR/ hand/or smaller velocity only the negative spirals remain.
Onset curves in the parameter plane(0Ret, 0Reb)have been measured for different aspect ratio. Their collapse into a single master curve provides good indication that these two patterns originate from the same instability mechanism, namely a free shear layer instability. The shear layer orig-inates from the detachment of the inward boundary layer
on the slower rotating disk, due to the meridian recircula-tion cells at high enough counter-rotarecircula-tion ratio (Lopez et al., 2002). In this scenario, the presence of a stagnation circle on the slower rotating disk, where ends the separation sur-face between the two recirculation cells, appears as a neces-sary condition for instability. Constrains on the thickness and the stability of the boundary layers predicts an upper bound for this shear layer instability in terms of the aspect ratio,
R/ h <40.
Onset modes have been measured for the different aspect ratio as a function of the Reynolds number of the faster rotat-ing disk,Ret. Surprisingly, while0Ret =Rht/νappears to be the control parameter for the instability, the onset mode is controlled byRet =h2t/ν, at least at small aspect ratio (R/ h <10). In this regime, the pattern essentially appears as a circular chain of corotating vortices, the number of which decreasing as the Reynolds number is increased. This trend can be understood from the variation of the annular shear layer radius, as measured from Particle Image Velocimetry. On the other hand, at higher aspect ratio (R/ h > 10), the pattern turns to a set of negative spirals, the number of which now increasing as the Reynolds number is increased. We have no explanation for this trend for the moment.
Focusing on the low aspect ratio case (R/ h <10), where PIV measurements are possible, we further characterized the instability in terms of local Reynolds number Reδ based on the free shear layer thickness δ. The constant value of this Reynolds number at the onset of instability, Reδ,c ' 110±20, gives evidence that the transition originates from a shear layer instability, where curvature has only weak ef-fect. Furthermore, the critical modemwas shown to scale as
of the shear layer is fixed by the geometry of the apparatus. In our experiment, this radiusR0is not fixed, but results from the competition of the centrifugal effects on each disk.
At higher aspect ratioR/ h > 10, the 3D flow is more complex and the associated spiral pattern is not fully under-stood for the moment. The only hint comes from the con-tinuity of the stability curves for the whole range of aspect ratio, indicating that the basic instability should be the same for both low and high aspect ratio, although the associated patterns strongly differ.
Acknowledgements. The authors acknowledge O. Daube, G.
Gau-thier, P. Gondret, G. M. Homsy, C. Nore, L. S. Tuckerman and J. E. Wesfreid for fruitful discussions.
References
Bergeron, K., Coutsias, E. A., Lynov, J. P., and Nielsen, A. H.: Dy-namical properties of forced shear layers in an annular geometry, J. Fluid Mech. 402, 255–289, 2000.
Chomaz, J. M., Rabaud, M., Basdevant, C., and Couder, Y.: Ex-perimental and numerical investigation of a forced circular shear layer, J. Fluid Mech. 187, 115–140, 1988.
Dijkstra, D. and van Heijst, G. J. F.: The flow between finite rotating disks enclosed by a cylinder, J. Fluid Mech. 128, 123–154, 1983. Dolzhanskii, F. V., Krymov, V. A., and Manin, D. Yu.: Stability and vortex structures of quasi-two-dimensional shear flows, Sov. Phys. Usp 33 (7), 495–520, 1990.
Fr¨uh, W. G. and Read, P. L.: Experiments on a barotropic rotating shear layer. Part 1. Instability and steady vortices, J. Fluid Mech. 383, 143–173, 1999.
Gauthier, G., Gondret, P., and Rabaud, M.: Motions of anisotropic particles: application to visualization of three-dimensional flows, Phys. Fluids 10, 2147–2154, 1998.
Gauthier, G., Gondret, P., and Rabaud, M.: Axisymmetric propagat-ing vortices in the flow between a stationary and a rotatpropagat-ing disk enclosed by a cylinder, J. Fluid Mech. 386, 105–126, 1999.
Gauthier, G., Gondret, P., Moisy, F., and Rabaud, M.: Instabilities in the flow between co and counter-rotating disks, J. Fluid Mech. 473, 1–21, 2002.
Hide, R. and Titman, C. W.: Detached shear layers in a rotating fluid, J. Fluid. Mech. 29, 39–60, 1967.
K´arm´an von, T.: Laminar und turbulente Reibung, Z. angew. Math. 1, 233–252, 1921.
Liou, W. W.: Linear instability of curved free shear layers Phys. Fluids 6, (2) 541–549, 1994.
Lopez, J. M.: Characteristics of endwall and sidewall boundary lay-ers in a rotating cylinder with a differentially rotating endwall, J. Fluid. Mech. 359, 49–79, 1998.
Lopez, J. M., Hart, J. E., Marques, F., Kittelman, S., and Shen, J.: Instability and mode interactions in a differentially-driven rotat-ing cylinder, J. Fluid. Mech. 462, 383–409, 2002.
Niino, H. and Misawa, N.: An experimental and theoretical study of barotropic instability, J. Atmos. Sci. 41, 1992–2011, 1984. Rabaud, M. and Couder, Y.: Instability of an annular shear layer,
J. Fluid. Mech. 136, 291–319, 1983.
Savas, ¨O.: On flow visualization using reflective flakes, J. Fluid. Mech. 152, 235–248, 1985.
Schouveiler, L., Le Gal, P., and Chauve, M.-P.: Stability of a trav-elling roll system in a rotating disk flow, Phys. Fluids 10, 2695– 2697, 1998.
Schouveiler, L., Le Gal, P. and Chauve, M.-P.: Instabilities of the flow between a rotating and stationary disk, J. Fluid Mech. 443, 329–350, 2001.
Serre, E., Crespo del arco, E., and Bontoux, P.: Annular and spiral patterns in flows between rotating and stationary discs, J. Fluid Mech. 434, 65–100, 2001.
van de Konijnenberg, J. A., Nielsen, A. H., Rasmussen, J. J., and Stenum, B.: Shear flow instability in a rotating fluid, J. Fluid. Mech. 387, 177–204, 1999.
Yanase, S., Flores, C., M´etais, O., and Riley, J. J.: Rotating free-shear flows. I. Linear stability analysis Phys. Fluids A 5, (11) 2725–2737, 1993.