https://doi.org/10.5194/dwes-11-101-2018 © Author(s) 2018. This work is distributed under the Creative Commons Attribution 4.0 License.
Technical note: Problem-specific variators in a genetic
algorithm for the optimization of drinking water networks
Karel van Laarhoven, Ina Vertommen, and Peter van Thienen
KWR Watercycle Research Institute, Nieuwegein, 3430 BB, the Netherlands
Correspondence:Karel van Laarhoven ([email protected])
Received: 29 July 2018 – Discussion started: 16 August 2018
Revised: 16 October 2018 – Accepted: 29 October 2018 – Published: 8 November 2018
Abstract. Genetic algorithms can be a powerful tool for the automated design of optimal drinking water distri-bution networks. Fast convergence of such algorithms is a crucial factor for successful practical implementation at the drinking water utility level. In this technical note, we therefore investigate the performance of a suite of genetic variators that was tailored to the optimization of a least-cost network design. Different combinations of the variators are tested in terms of convergence rate and the robustness of the results during optimization of the real-world drinking water distribution network of Sittard, the Netherlands. The variator configurations that reproducibly reach the furthest convergence after 105function evaluations are reported. In the future these may aid in dealing with the computational challenges of optimizing real-world networks.
1 Introduction
Optimization techniques have been applied to the design (or more specifically, the dimensioning) of water networks for decades (see Bieupoude et al., 2012, and De Corte and Sörensen, 2013, for overviews). A widely applied approach is that of genetic algorithms (GAs) (Holland, 1975; Gold-berg, 1989) and other members of the overarching fam-ily of evolutionary algorithms (EAs) (Maier et al., 2014). Though the classic genetic algorithm is very powerful, the various mechanisms of the genetic algorithm are commonly expanded, replaced or combined with heuristic tricks or com-plete heuristic algorithms to improve performance (as re-viewed by e.g. El-Mihoub et al., 2006). The algorithms which include these are commonly referred to as hybrid ge-netic algorithms (HGAs) or memetic algorithms (MAs). An overview of these approaches is summarized below. Follow-ing one of the approaches, a selection of custom heuristic variators has been implemented in Gondwana, a generic op-timization tool for drinking water networks (van Thienen and Vertommen, 2015). In this paper, these variators are de-scribed and it is demonstrated how they contribute to signif-icantly faster convergence in an optimization problem case study.
2 Hybrid genetic algorithms
A cornerstone of the HGA approach (Krasnogor and Smith, 2005; El-Mihoub et al., 2006) is the observation that clas-sic GAs are especially well suited for quickly locating global optima in the solution space but subsequently have difficulty converging to the optimum locally within a reasonable num-ber of iterations. To mitigate this, GAs are augmented with local search (LS) methods. These are algorithms that iter-atively modify a given solution towards a predefined opti-mization criterion. LS methods find local optima relatively quickly but are generally unable to escape this local optimum in favour of a possibly different global optimum. The result-ing HGA therefore profits from the strengths of both tech-niques and yields better solutions. El-Mihoub et al. (2006) identify the following general ways in which GA capabilities can be expanded through hybridization:
the solution space.
3. Alternatively, system-specific knowledge can be used to modify the genetic operators in such a way that they only result in viable solutions. This does not guide the search but prevents time loss due to the evaluation of many illegal solutions, which may arise from random variations in heavily restricted GA problems.
4. The population size needed to achieve convergence can be reduced by dynamically controlling candidate selec-tion with a LS method.
5. System-specific knowledge can be used to construct a model to quickly approximate the results of fitness func-tions that are expensive to calculate, speeding up the evaluation of the GA objectives.
It is worth noting that the possible resulting HGAs form a broad class of algorithms and that individual HGAs might fall under categories different from GA within the taxonomy of EA (Calegari et al., 1999).
3 Case study
3.1 Problem-specific variators
Within the field of water network design optimization, al-gorithms that guide the GA to reduce the size of the search space is a specific challenge in current research (Maier et al., 2014). Table 1 lists a collection of genetic operators that was composed to tune a GA to the optimization of a least-cost design (Alperovitz and Shamir, 1977; Savic and Walters, 1997). This type of problem varies pipe diameters through-out the network in search of the minimum network costs while achieving a minimum pressure at each node. In ad-dition to several classic GA variators (Holland, 1995; Gold-berg, 1989), two heuristic variators are used that were con-structed with the goal of a least-cost design in mind. In terms of the classification of hybrid metaheuristics by Talbi (2002), the resulting HGA is a low-level teamwork hybrid.
The heuristic flatiron mutator was custom-made to en-hance convergence according to approach 2 in the list above.
larger diameter pipe to be surrounded by smaller diameter pipes, which is hydraulically insensible. These artefacts can take a long time to disappear through random mutation only. The flatiron mutator speeds up convergence by “smoothing out” these artefacts as follows:
1. For the mutating pipe, obtain the neighbour IDs from a lookup table with neighbouring pipes per pipe (it is worth noting that this lookup table is created at the start of the optimization, thereby limiting its impact on com-putation).
2. If the pipe connects to exactly 1 or 2 neighbouring pipes, compare the diameter of the mutating pipe to those of its neighbours.
3. If the mutating diameter is larger than the diameter of all neighbours, reduce it to the largest diameter among neighbours.
The heuristic list proximity mutator enhances convergence according to approach 3 in the list above. It is equivalent to the classic “creep mutator” (Sivanandam and Deepa, 2007): it functions as the regular random mutation of a single pipe diameter, except that the possible outcomes of the mutation are limited to values close to the value prior to mutation. This mutator is typically used because large deviations from the original diameter are likely to cause hydraulically inviable solutions.
In order to evaluate the influence of the developed problem-specific variators, a series of tests was performed on a case study.
3.2 Case study network
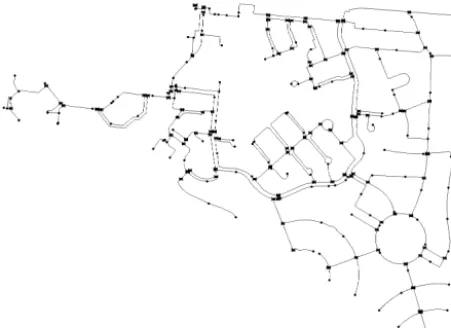
Figure 1.EPANET model of the drinking water distribution net-work of Sittard (Netherlands), consisting of 583 junctions, 491 pipes, 140 valves and 1 reservoir.
by an EPANET (Rossman, 2000) model consisting of 583 junctions, 491 pipes, 140 valves and 1 reservoir. The network is displayed in Fig. 1.
3.3 Optimization
For the design of the network, the minimization of the prod-uct between pipe diameter and pipe length (surrogate for costs) was considered as the objective, constrained by a min-imum pressure at each node equal to 34 m. The decision vari-ables were the pipe diameters that could be chosen from the following: 0, 13.2, 21.2, 36, 42.6, 58.2, 66, 72.8, 87.3, 101.6, 130.8, 147.6, 163.6, 190, or 200 mm. A population of 100 individuals with an elitism rate of 15 % was used for each optimization. Selection between candidates was achieved through tournament selection with a tournament size of 2 and with the objective function – the product of pipe length and diameter – as the performance criterion.
3.4 Tests
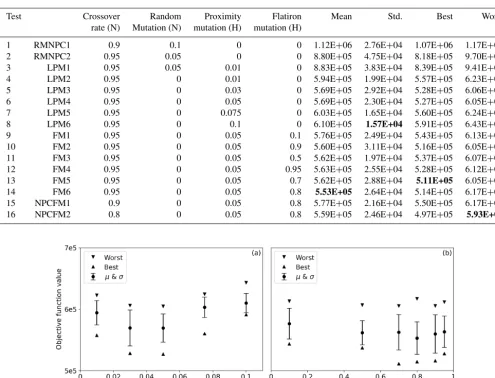
A total of 16 tests were performed, wherein different rates for the specific variators were considered in order to assess their influence on the network design results. For each test, a total of 1×10⁵function evaluations and 10 runs were per-formed: each test was repeated 10 times in order to assess the mean, standard deviation, best and worst results obtained for each test. Table 2 provides an overview of the different tests, including the considered variator values and obtained results. Tests 1 and 2 consist of different rate combinations of the classical random mutation (RM) and one-point crossover (NPC). The heuristic proximity mutation was added in tests 3 to 8. Different rates for the heuristic flatiron mutation were considered in tests 9 to 14. Tests 15 and 16 further explore
Figure 2.Overview of the obtained results for the different tests.
the influence of the one-point crossover on the performance of the algorithm.
4 Results
From the obtained results (Table 2) it is clear that the consid-eration of the heuristic flatiron mutation (FM) and proximity mutation (LPM) significantly improved the obtained results for the optimization problem. These results are graphically reported in Fig. 2.
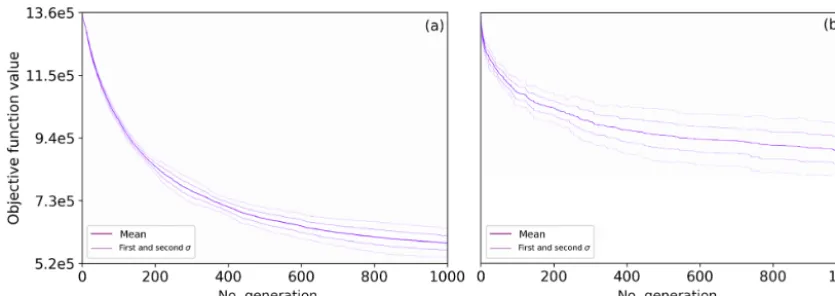
Considering only the naïve random mutation and one-point crossover, the best results after 1×10⁵function evalu-ations were achieved with a mutation rate equal to 0.05 and a crossover rate equal to 0.95. In this case the average objective function value was 8.8×10⁵. Adding a proximity mutation does not improve the results, but considering only a proxim-ity mutation and no random mutation has a significant influ-ence on the outcomes. With only the proximity mutation, the best results after 1×10⁵function evaluations were achieved for a proximity mutation rate of 0.05. With this value, the best results were achieved for the mean as well as the best and worst values for the objective function. Figure 3a illus-trates the influence of this variator on the computed objective function values.
Adding a flatiron mutation further improved the obtained results. The best results after 1×10⁵function evaluations, on average, were obtained for a combination of a crossover rate of 0.95, with a proximity mutation rate equal to 0.05 and a flatiron mutation rate equal to 0.8. The best result within one test was obtained for a slightly lower flatiron mutation rate, equal to 0.7. Figure 3b illustrates the influence of this flatiron mutation rate on the obtained objective function values.
11 FM3 0.95 0 0.05 0.5 5.62E+05 1.97E+04 5.37E+05 6.07E+05 12 FM4 0.95 0 0.05 0.95 5.63E+05 2.55E+04 5.28E+05 6.12E+05 13 FM5 0.95 0 0.05 0.7 5.62E+05 2.88E+04 5.11E+05 6.05E+05
14 FM6 0.95 0 0.05 0.8 5.53E+05 2.64E+04 5.14E+05 6.17E+05
15 NPCFM1 0.9 0 0.05 0.8 5.77E+05 2.16E+04 5.50E+05 6.17E+05 16 NPCFM2 0.8 0 0.05 0.8 5.59E+05 2.46E+04 4.97E+05 5.93E+05
Figure 3.(a)Influence of the proximity mutation rate on the obtained objective function values in tests LPM2, LPM3, LPM4, LPM5 and LPM6.(b)Influence of the flatiron mutation rate on the obtained objective function values in tests FM1, FM2, FM3, FM4, FM5 and FM6.
number 2 (RMNPC2) and 12 (FM4). The proximity and flat-iron mutations lead to smoother curves and a faster conver-gence. The standard deviation between results of the differ-ent runs is also much lower, which means that the results are more stable.
5 Discussion and conclusions
The results presented in this paper clearly illustrate the value of applying heuristic, non-classical variators in drinking wa-ter distribution system design optimizations using genetic al-gorithms. While the difference between the test with random mutation and the other tests is especially noticeable in Fig. 2, it is worth noting that the smaller differences between the other individual tests indicate a significant difference in con-vergence as well. In Fig. 4a, for instance, it can be seen that,
in FM4, the average objective function value of 6×10⁵was reached in around 700 generations, about 1.4 times faster than in LPM2, LPM5 and LMP6.
In the tests, the combination of a low rate for the proxim-ity mutation with a high rate of the flatiron mutation leads to the best results after 1×10⁵function evaluations (test num-bers 13:FM5 and 14:FM6), i.e. the fastest convergence. All tested combinations which include either the flatiron or the proximity mutation exhibit a similar or worse performance. Albeit slower, particularly stable results were obtained with the proximity mutation (rate=0.1) and no flatiron mutation. These runs show the smallest standard deviation in the results after 1×10⁵function evaluations.
Figure 4.Convergence curves (mean, first and second standard deviations of 10 runs) obtained for tests RMNPC2 and FM4.(a)One-point crossover, proximity mutation and flatiron mutation (FM4).(b)Random mutation and one-point crossover (RMNPC2).
with the computational challenges of larger real-world net-works.
Data availability. The network model used here is the property of the Dutch utility WML and is therefore not made public.
Author contributions. KvL wrote the manuscript. IV carried out the comparison of optimization settings. All authors took part in discussing and interpreting the findings.
Competing interests. The authors declare that they have no con-flict of interest.
Acknowledgements. The authors wish to thank Henk Vogelaar from Waterleiding Maatschappij Limburg (WML) for providing the Sittard network model used in the calculations.
Edited by: Ran Shang
Reviewed by: two anonymous referees
References
Alperovitz, E. and Shamir, U.: Design of Optimal Water Distribu-tion Systems, Water Resour. Res., 13, 885–900, 1977.
Bieupoude, P., Azoumah, Y., and Neveu, P.: Optimization of drink-ing water distribution networks: Computer-based methods and constructal design, Comp. Env. Urb. Sys., 36, 434–444, 2012. Calegari, P., Coray, G., Hertz, A., Kobler, D., and Kuonen, P.: A
tax-onomy of evolutionary algorithms in combinatorial optimization, J. Heur., 5, 145–158, 1999.
De Corte, A. and Sörensen, K.: Optimisation of gravity-fed water distribution network design: a critical review, Europ. J. of Oper. Res., 228, 1–10, 2013.
El-Mihoub, T. A., Hopgood, A. A., Nolle, L., and Battersby, A.: Hybrid Genetic Algorithms: A Review, Eng. Let., 13, 124–137, 2006.
Goldberg, D. E.: Genetic Algorithms in Search, Optimization, and Machine Learning, Addison-Wesley, ISBN: 0201157675, 1989. Holland, J.: Adaptation in Natural and Artificial Systems, The
Uni-versity of Michigan, Michigan, USA, 1975.
Krasnogor, N. and Smith, J.: A tutorial for competent memetic al-gorithms: model, taxonomy and design issues, IEEE T. Evolut. Comput., 9, 474–488, 2005.
Maier, H. R., Kapelan, Z., Kasprzyk, J., Kollat, J., Matott, L. S., Cunha, M. C., Dandy, G. C., Gibbs, M. S., Keedwell, E., Marchi, A., Ostfeld, A., Savic, D., Solomatine, D. P., Vrugt, J. A., Zecchin, A. C., Minsker, B. S., Barbour, E. J., Kuczera, G., Pasha, F., Castelletti, A., Giuliani, M., and Reed, P. M.: Evolu-tionary algorithms and other metaheuristics in water resources: Current status, research challenges and future directions, Envi-ron. Model. Softw., 62, 271–299, 2014.
Rossman, L. A.: EPANET 2 User’s Manual. United States Environ-mental Protection Agency, Cincinnati, USA, 2000.
Savic, D. A. and Walters, G. A.: Genetic Algorithms for Least-Cost Design of Water Distribution Networks, J. Wat. Res. Plan. Man., 123, 67–77, 1997.
Sivanandam, S. N., and Deepa, S. N.: Introduction to Genetic Algo-rithms, Springer, ISBN: 9783540731894, 2007.
Talbi, E. G.: A Taxonomy of Hybrid Metaheuristics, J. Heur., 8, 541–564, 2002.