370
International Journal of Pharmaceutical Sciences and Drug Research
2015; 7(4): 370-375
Research Article
CODEN (USA): IJPSPP
ISSN: 0975-248X
A Novel UV-Spectrophotometric Method Development and Validation of
Dolutegravir in Bulk and Its Laboratory Synthetic Mixture by Using 8 M
Urea as Hydrotropic Solubilizing Agent
S K. Masthanamma
*, T. Ananta Sridhar, P Saidulu
Department of Pharmaceutical Analysis, University College of Pharmaceutical Sciences, Acharya Nagarjuna University, Nagarjunanagar, Guntur–522510, Andhra Pradesh, India
ABSTRACT
The term hydrotropy has been used to designate the increase in solubility in water of various substances due to the presence of large amount of additives. Concentrated aqueous hydrotropic solutions of sodium benzoate, urea, nicotinamide, sodium salicylate, sodium ascorbate and sodium glycinate have been observed to enhance the aqueous solubility of many poorly water-soluble drugs. In the present investigation hydrotropic solubilization technique has been employed to solubilize the poorly water-soluble anti retroviral drug, Dolutegravir. Determination of solubilities of the drug in 8 M urea hydrotropic solution and distilled water was carried out at room temperature. There was more than 50-fold enhancement in aqueous solubility of Dolutegravir with 8 M urea (as compared to aqueous solubility). Therefore, it was thought worthwhile to solubilize the poorly water-soluble Dolutegravir from fine powder of its laboratory mixture to carryout spectrophotometric analysis at 258 nm in method A, 248-268 nm in method B and 256 nm in method C. urea does not show any absorbance above 250 nm. Beerۥs law was obeyed in the concentration range of 52.5-20µg/ml in method A, B and C, with correlation coefficients (R) of 0.996, 0.995 and 0.996 respectively. Laboratory mixture containing piroxicam have been analyzed successfully. Recovery studies and statistical data proved the accuracy, reproducibility and the precision of the proposed method. Based on the same principle a large number of drugs having λmax above 250 nm can be estimated by 8 M urea (inexpensive hydrotropic agent). Thus,
hydrotropic solutions can be used in place of organic solvents (which are pollutants, toxic and give error due to volatility).
Keywords: Dolutegravir, urea, AUC, Hydrotropic solubilization technique, derivative spectroscopy.
INTRODUCTION
The term hydrotropic agent [1] was first introduced by
*Corresponding author: Dr. S. K. Mastanamma,
Department of Pharmaceutical Analysis, University College of Pharmaceutical Sciences, Acharya Nagarjuna University, Nagarjunanagar, Guntur–522510, Andhra Pradesh, India; Tel.: +91-9959121008;
E-mail: [email protected]
Received: 23 June, 2015; Accepted: 07 July, 2015
Int. J. Pharm. Sci. Drug Res. July-August, 2015, Vol 7, Issue 4 (370-375) which is prerequisite for a hydrotropic substance. On
the other hand, planarity of the hydrophobic part has been emphasized as an important factor in the mechanism of hydrotropic solubilization. Hydrotropes commonly used includes sodium benzoate, sodium acetate, sodium salicylate, nicotinamide, urea, trisodium citrate, sodium ascorbate, piperazine, caffeine, potassium citrate etc. hydrotropic agents have been observed to enhance the solubility of various substances in water.
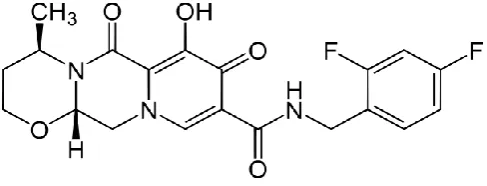
Fig. 1: Structure of Dolutegravir
Dolutegravir was chemically (RS)(4R,12aS)-N-(2, 4-difluorobenzyl)-7-hydroxy-4-methyl-6, 8-dioxo-3, 4, 6, 8, 12, 12a-hexahydro-2H-pyrido[11,21
,4,5]pyrazino[2,1-b][1,3]oxazine-9-caboxamide. [1] It is slightly soluble in
water and methanol. [2-3] Dolutegravir is an FDA
approved drug for the treatment of HIV infection. Dolutegravir is an integrase inhibitor. [4] DTG is an
integrase strand transfer inhibitor (INSTI) that does not require ritonavir for cytochrome P450 3A4 inhibition, and preferentially blocks the strand transfer step of integration of the viral genome into the host cell’s DNA, which is a two-step process mediated by the viral integrase enzyme. [4-5] Like the other approved
INSTIs raltegravir (RAL) and elvitegravir (EVG) DTG inhibits the binding of the integrase-viral DNA complex to host cell DNA by chelating Mg2+ ions in the
active site. Once integration is blocked, HIV-1 can no longer replicate, and the viral replication cycle is interrupted. [5-6]
Literature survey revealed that there were no spectrophotometric and chromatographic methods for the estimation of Dolutegravir in bulk and its synthetic mixture. Hence the author made an attempt to develop a simple, economical, selective, accurate, precise UV spectrophotometric method for the determination of Dolutegravir by using hydrotropic solubilization technique [7-15] in bulk and Pharmaceutical dosage
forms and validated as per ICH guidelines.
MATERIALS AND METHODS Chemicals and reagents
Dolutegravir (99.4%) was obtained as gift sample from Hetero laboratories, Hyderabad, India. Urea (A. R Grade; Qualigens) and distilled water used for the study.
Instrumentation
Shimadzu UV-1800 double beam spectrophotometer with 1 cm path length supported by Shimadzu
UV-probe software, version 2.21 was used for spectral measurements with 10 mm matched quartz cells. Shimadzu balance (BL-220H) was used for weighing.
Selection of solvent
8 M urea solution was used as a solvent for developing spectral characteristics of a drug. The selection was made after assessing the solubility in different hydrotropic solvents like sodium acetate, sodium benzoate, piperazine, sodium chloride, citric acid. Among these solvents Dolutegravir was freely soluble (1 in 10 parts as per IP-2010) in 8 M urea and showed maximum drug stability.
Preparation of reagent solution
8 M urea solution was prepared by 48.6 g of urea pure chemical was weighed and dissolved in 10 ml distilled water and the volume was made up to the mark with distilled water in 100 ml volumetric flask.
Preparation of standard stock solution
Working standard Dolutegravir 10 mg was weighed accurately and transferred to a 10 ml volumetric flask and dissolved in 1 ml of 8 M urea solution. [9-12] The
flask was shaken and volume was made up to the mark with distilled water to give a solution of 1000µg/ml. It was further diluted with distilled water to get the concentration of 100µg/ml. from this solution a series of aliquots were prepared for further method development.
Method A
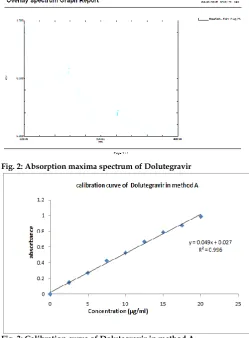
Absorption maxima method: For the selection of analytical wavelength 10µg/ml solution of Dolutegravir was prepared by appropriate dilution of standard stock solution and scanned in the spectrum mode from 200 nm to 400 nm. From the spectrum λmax
of Dolutegravir, 258 nm was selected for the analysis. The calibration curve was prepared in concentration range of 2.5-20µg/ml at 258 nm. [16-19] the calibration
curve for Dolutegravir was plotted in the concentration v/s absorbance and regression equation was calculated for the determination of amount of Dolutegravir in synthetic mixture (Fig. 2 & 3).
Method B
Area under curve method: For the selection of analytical wavelength 10µg/ml solution of Dolutegravir was prepared by appropriate dilution of standard stock solution and scanned in the spectrum mode from 200 nm to 400 nm. Area under curve (AUC)
[16-19] method involves the calculation of integrated
Int. J. Pharm. Sci. Drug Res. July-August, 2015, Vol 7, Issue 4 (370-375)
Table 1: Results of laboratory synthetic mixture analysis
Proposed methods Label claim(mg) Test concentration (µg/ml) Amount found (μg/ml) %Assay %RSD
A 50 mg 5 4.938 98.76 0.425
B 50 mg 5 4.990 99.88 0.586
C 50 mg 5 4.937 98.75 0.465
Table 2: Optical characteristics of the proposed methods
S. No Parameter Method A Method B Method C
1 Linearity (µg/ml) 2.5-20 2.5-20 2.5-20
2 Linearity equation y=0.049X+0.027 Y=0.937x+0.523 Y=0.048x+0.026
3 Slope ± SD 0.049±0.066 0.937±0.035 0.048±0.080
4 Intercept ± SD 0.027±0.036 0.523±0.049 0.026±0.056
5 Correlation coefficient 0.996 0.995 0.996
6 LOD 190ng 190ng 190ng
7 LOQ 570ng 570ng 570ng
Table 3: Recovery studies of proposed methods
Method Level of recovery Pre analyzed conc. (µg/ml) Amount added (µg/ml) Amount found (µg/ml)(n=6) %Recovery %RSD
Method A 100 50 5 5 2.5 5.0 7.91 9.83 105.5 98.36 0.74
150 5 7.5 12.79 102.36
Method B 100 50 5 5 2.5 5.0 10.23 7.89 105.2 102.3 0.43
150 5 7.5 12.95 103.6
Method C 100 50 5 5 2.5 5.0 10.31 7.47 103.1 99.6 0.51
150 5 7.5 12.35 98.8
Table 4: Precision studies of proposed methods
Intra day Inter day
Method Concentration (µg/ml) Mean ±SD %RSD Concentration (µg/ml) Mean ±SD %RSD
A 10 5 0.306±0.0030 0.529±0.0011 0.980 0.207 10 5 0.529±0.00240 0.305±0.0024 0.812 0.453
15 0.707±0.0001 0.025 15 0.707±0.00021 0.031
B 10 5 0.426±0.0030 0.459±0.0011 0.758 0.473 10 5 0.365±0.0054 0.745±0.0056 0.456 0.643
15 0.677±0.0001 0.045 15 0.5760.00023 0.051
C 10 5 0.766±0.0030 0.347±0.0011 0.765 0.421 10 5 0.386±0.0043 0.694±0.0035 0.753 0.326
15 0.647±0.0001 0.056 15 0.458±0.00075 0.026
Method C
First order derivative spectroscopy: It involves the conversation of normal spectrum to its zero, first, second or higher derivative spectrum. In derivative spectrophotometry, [16-19] spectra are obtained by
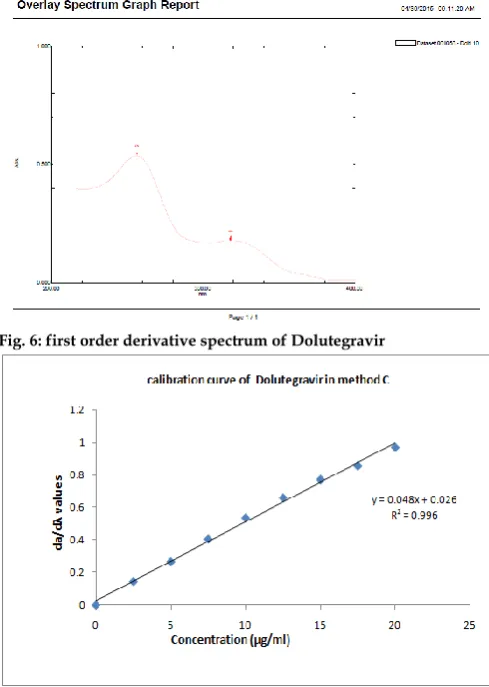
plotting the first or a higher order derivative of absorbance with respect to wavelength as a function of wavelength. Often, these plots reveal spectral detail that is the lost in an ordinary spectrum. In addition, concentration measurements of an analyte in the presence of interference or of two or more analytes in a mixture can sometimes be made more easily accurately using derivative methods. In this method, 10µg/ml solution of Dolutegravir was prepared by appropriate dilution of standard stock solution and scanned in the spectrum mode from 200-400 nm. The absorption spectra thus obtained were derivitised from zero to second order. First order derivative spectra of drug showed a sharp peak at 256 nm, which was selected for its quantification. The calibration curve for Dolutegravir was plotted in the concentration range of 2.5-20µg/ml at 256 nm. The concentration of drug present in the solution was determined against the calibration curve in quantization mode (Fig. 6 & 7).
Estimation ofDolutegravir in synthetic mixture
For the estimation of Dolutegravir laboratory synthetic mixture was prepared with Dolutegravir API and excipients (Mannitol, Micro crystalline cellulose) with the strength of 50 mg of Dolutegravir in glass motor and pestle, after proper mixing, weigh accurately about a quantity of powder which was equivalent to 10 mg of Dolutegravir was transferred to10 ml volumetric flask and add 2 ml of 8 M Urea solution, and make up the final volume with distilled water to obtain a sample stock solution of 1000µg /ml of Dolutegravir. It was filtered with Whatmann filter paper no.41; from this solution required test concentration was prepared by appropriate dilution. The concentration in the test solution was estimated by above developed methods i.e. in method A the concentration of Dolutegravir was determined by measuring absorbance of sample solution at 258 nm. In method B, the concentration of Dolutegravir was determined by measuring absorbance of sample solution in wavelength range of 248-268 nm. In method C, first order derivative spectroscopy the concentration of Dolutegravir was determined by measuring amplitude difference at λmax 256nm. Result
Int. J. Pharm. Sci. Drug Res. July-August, 2015, Vol 7, Issue 4 (370-375)
Method Validation
The method was validated according to ICH guidelines to study accuracy, linearity, precision, LOD and LOQ.
Linearity
In order to find out linearity range of proposed UV-spectrophotometric method, studies were carried out by plotting absorbances of analyte against concentrations of the analyte. A good linear relationship (R2=0.996, 0.995 & 0.996 for method A, B &
C respectively) was observed between concentrations of Dolutegravir and the corresponding absorbance. The regression equations of Dolutegravir concentration over its absorbance was found to be y=0.049x+0.027, Y=0.0937x-0.523 & Y=0.048x+0.026 for method A, B&C (where y is the absorbance and x is the concentration of Dolutegravir).the slope, intercept and the correlation coefficient of the drug were shown in Table 2.
Accuracy
Accuracy is expressed as the closeness of the results from standard samples to that of the actual known amounts to determine the accuracy of the proposed method, recovery studies were carried out in different recovery levels (50%, 100% and 150%) by adding placebo to the pre-analyzed formulation .the solutions were suitably diluted in the range and then each of the dilution was observed 6 times. The % recovery of the drug was found to be 102.09, 103.7 & 100.5% in method A, B & C respectively. The results were shown in the Table 3.
Precision
Precision is the level of repeatability of results as reported between samples analyzed on the same day (intra-day) and samples run on 3 different days (inter-day) to check the intra-day and inter-day variation of the method, solution containing 5, 10 & 15µg/ml Dolutegravir were subjected to the proposed spectrophotometric method of analysis and the recoveries obtained were noted. the precision of proposed method i.e. the intra and inter-day variations in the absorbance of the drug solutions was calculated in terms of % RSD and the results were presented in the Table 4. Statistical revolution revealed that relative standard deviation of drugs at different concentration levels for 6 times was less than 2.0
LOD
It is the lowest amount of analyte in a sample that can be detected but not necessarily quantities as an exact value under the stated, experimental conclusions. The detection limit is usually expressed as the concentration of analyte.
The standard deviation and response of the slope LOD=3.3 * standard deviation (σ)/ s
LOQ
The quantitation limit of an analytical procedure is the lowest amount of an analyte of a simple which can be quantitatively determined with suitable precision and accuracy.
The standard deviation and response of the slope LOQ=10* standard deviation (σ)/ s
Fig. 2: Absorption maxima spectrum of Dolutegravir
Fig. 3: Calibration curve of Dolutegravir in method A
Fig. 4: AUC spectrum of Dolutegravir
Int. J. Pharm. Sci. Drug Res. July-August, 2015, Vol 7, Issue 4 (370-375)
Fig. 6: first order derivative spectrum of Dolutegravir
Fig. 7: Calibration curve of Dolutegravir in method C
RESULTS AND DISCUSSION
For quantitative estimation of Dolutegravir in bulk and laboratory synthetic mixture three validated methods was proposed for method A, the absorbance maxima was found to be 258 nm (Fig. 2 & 3), for method C λmax
at 256 nm was selected (Fig. 6 & 7) and for method B area under curve in the range of 248-268 nm were selected for the analysis (Fig. 4 & 5). The % assay by the three methods was found to be 98.76% in method A, 99.50% in method B and 98.75% in method C (Table 1). No interference was observed from the pharmaceutical excipients. The % recovery obtained for absorption maxima, first order derivative spectroscopy and area under the curve was found to be in the range of 102.01%, 100.5%, 103.7% (Table 3). The proposed methods are very precise, the %RSD is less than 2. (Table 4) and LOD & LOQ values of proposed methods are within the limits (Table 2). Hence, the proposed were validated in terms of linearity, precision, and accuracy. The present work provides an accurate and sensitive method for the analysis of Dolutegravir in bulk and tablet formulation.
The three spectrophotometric methods were developed and validated as per ICH guidelines. The standard deviation and %RSD calculated for the methods are within the limits, indicating high degree of precision of the methods. The results of the recovery studies performed indicate the methods to be accurate. Hence it can be conducted that the developed
spectrophotometric methods are accurate, precise and can be employed successfully for the estimation of Dolutegravir bulk and formulation. The proposed methods were found to be simple, economical, eco-friendly, rapid, precise and accurate for the determination of Dolutegravir in tablet dosage form. There is good scope for other poorly water soluble drugs which may be tried to get solubilize in 8 M urea solution (as hydrotropic agent) to carry out their spectrophotometer analysis excluding the use of costlier and unsafe organic solvents. Thus, it can be easily and conveniently adopted for routine quality control analysis.
ACKNOWLEDGEMENT
I am very thankful to principal Dr. A. Prameela Rani, University College of pharmaceutical sciences, Acharya Nagarjuna University, Guntur, for providing the laboratory facilities chemicals to carryout entire research work. I am also thankful to Hetero lab, Hyderabad, India, for providing Dolutegravir working standard as gift sample.
REFERENCE
1. Mastanamma S, Gujjarlapudi K, Deepthi KS, Pradeepthi J,
Haritha K. UV-Spectrophotometric Determination of Telmisartan in Bulk and Pharmaceutical Dosage form using Hydrotropic Solubilization technique. J. Sci. Res. Phar. 2013; 2(3): 22-25.
2. http://www.drugbank.ca/drugs/DB00300.
3. Pommier Y, Johnson AA, Marchand C. Integrase inhibitors to
treat HIV/AIDS. Nat. Rev. Drug Discov. 2005; 4:236–248
4. Katlama C, Murphy R. Dolutegravir for the treatment of HIV.
Expert Opin Investig Drugs. 2012; 21:523-530.
5. Song I, Borland J, Chen S, Lou Y, Peppercorn A, Wajima T,
Min S, Piscitelli SC. Effect of atazanavir and atazanavir/ritonavir on the pharmacokinetics of the next-generation HIV integrase inhibitor, S/GSK1349572. Br J Clin Pharmacol. 2011; 72:103-108.
6. Walmsley S, Antela A, Clumeck N, Duiculescu D, Eberhard
A, Gutierrez F, Hocqueloux L, Maggiolo F, Sandkovsky U, Granier C, et al. Dolutegravir (DTG; S/GSK1349572) + abacavir/lamivudine once daily statistically superior to tenofovir/emtricitabine/efavirenz: 48-week results—single (ING114467), 52nd ICAAC, San Francisco; 2013.
7. Oochikian GK, Cradock JC. Enhanced chartreusin solubility
of hydroxyl benzoate hydrotropy. J Pharm Sci 1979; 68:728-32.
8. Maheshwari RK, Prasad S, Pandey P, Wanare G. Novel
Spectrophotometric Analysis of Piroxicam Tablets Using Ibuprofen Sodium as Hydrotropic Solubilizing Agents. International Journal of Pharmaceutical Sciences and Drug Research 2010; 2(3):210-212.
9. Maheshwari RK, Jawade S, Fouzdar A. Formulation
Development of Aqueous Injection of Poorly Soluble Drug Using Mixed Hydrotropic Solubilization Concept and Its Evaluation. International Journal of Pharmaceutical Sciences and Drug Research 2015; 7(1):08-12.
10. Darwish IA, Florence AT, Saleh AM. Effects of hydrotropic
agents on the solubility, precipitation, protein binding of etoposide. J Pharm. Sci 1989; 78:577-81.
11. Saleh AM, Daabis NA. Study of interaction of menadione
with hydrotropic salts. Pharmazie 1974; 29:525-7.
12. Maheshwari RK. A novel application of hydrotropic
Int. J. Pharm. Sci. Drug Res. July-August, 2015, Vol 7, Issue 4 (370-375)
13. Justin K, Shuguang C.A phase 1 study to evaluate the effect
of dolutegravir on renal function via measurement of iohexol and para-aminohippurate clearance in healthy subjects. British Journal of Clinical Pharmacology 2013; 75(4): 990-996.
14. Maheshwari RK, Chaturvedi SC, Jain NK. Novel
spectrophotometric estimation of some poorly water soluble drugs using hydrotropic solubilizing agents. Indian J Pharm Sci. 2006; 68:195.
15. Maheshwari RK. Mixed hydrotropy in spectrophotometric
analysis of poorly water- soluble drug. Indian Pharmacist 2007; 6:66-7.
16. Maheshwari RK. Application of hydrotropic solubilization
phenomenon in spectrophotometric estimation of norfloxacin in tablets. Indian J Pharm Edu Res. 2006; 40: 237.
17. Maheshwari RK, Awasthi R. Application of hydrotropic
solubilization technique for quantitative determination of aspirin. Asian J Chem. 2008; 20(1):814-6.
18. Masthanamma Sk, Ananta Sridhar T, Siva sankar naik B, Anil
kumar T. UV-Spectrophotometric Determination of Ofloxacin in Bulk and Pharmaceutical Dosage form Using Hydrotropic Solubilization Technique. Am. J. PharmTech Res. 2015; 5(2):268-278.
19. Masthannamma Sk, Ananta Sridhar T, Siva Sankar Naik B.
UV-Spectrophotometric Determination of Tinidazole in Bulk and Pharmaceutical Dosage Form Using Hydrotropic Solubilization Technique. IJPCS. 2015; 4(2):209-215.