Volume 5, Issue 6 [June 2016] PP: 23-33
Performance Indicators a way of regulation of water distribution
Services: Case unit of the City of tlemcen (Algeria)
Mohammed Habi
1; Abla Fecih
2; Omar Harrouz
31Université de Tlemcen, Faculté de Technologie, Département d’Hydraulique. B.P. 230 – Tlemcen 13000,
Algérie., Tel. : +213 43410011, Fax.: +213 43410011
2Université de Tlemcen, Faculté de Technologie, Département d’Hydraulique. B.P. 230 – Tlemcen 13000,
Algérie., Tel. : +213 43410011, Fax.: +213 43410011
3Institut des Sciences de la Nature et de l’Agro-alimentaire de Bordeaux - 2, impasse Charles-Tellier, 33883
Villenave-d'Ornon cedex, Bordeaux, France
Abstract:-The regulation of the water services is an increasingly updated topic in Algeria. The regulation of the water services is the proficiency of managers in the water sector. They are the ones to decide on investments, organize the exploitation and negotiate the price. If the user is the consignee of the service, he intervenes just very indirectly in the management choices.Taking note of the limit of control over the resources and the lack of instruments for monitoring and control, emerging from the analysis of the present situation, this work comes to reinforce the actions already initiated by the manager of the sector and offers the simplest and easiest measurable range of the performance indicators, as an appropriate tool to assure the function of regulation. The group of indicators so developed and tested on the Urban Group of the county of Tlemcen, managed by the Algerian of Waters (ADE), the unit of the county of Tlemcen, has proved the damage of this network. The obtained results can be generalized and will allow apprehending the content of the service, optimizing themanagement, assuring monitoring and control, inducing the improvement of performance and communication between the actors in the content of a well defined organization.
Keywords: - water, regulation of service, performance indicators, monitoring, control.
I.
INTRODUCTION
The water services in Algeria are characterized by a very advanced state of disrepair (waste, unsatisfactory needs, lack of experience, anarchic distribution, damage of installations, etc...). This failure of the management of these services is mainly due to the low costs applied and which do not cover the expenses carried out. This has resulted in very high rates of subsidy and often justified by the government in the name of the equity of access to this vital resource to different layers with low and modest incomes. To cure this situation, during the last fifteen years, the water sector has become one of the major concerns of the politics. Indeed, considerable efforts and several legal, institutional and organizational reforms have been undertaken to better manage these services and thus to preserve our natural resources of water supply. These large reform programs undertaken have resulted in the creation of the Algerian of Waters (ADE), enterprise managing the drinking water network followed by other measures of the network management. The evaluation of the drinking water services is still limited to, only the price of water. The experience has shown how it could be simplistic and it became needless to continue in this spirit which does not take into account the factors of land and to better assess the reel explanatory factors. We must compare the results of the service, through the measurement of performances. Indicators to measure the performance of services can be the answer to this concern. These indicators are parameters which allow to measure and monitor in detail in time the different results of the water service and according to these results, some corrective actions or process improvement activities will be taken [1]. The introduction of performance indicators provides many opportunities in terms of defining the content of the service, of control by the department managers, of incentives for improvement and finally, of communication towards the users [2] and [3].
The objectives of this work is to analyze and evaluate the performance of the distribution system of drinking water of the Urban Group of Tlemcen (UGT), managed by the Algerian of waters (ADE) Unit of Tlemcen, using these indicators. The choice was on some performance indicators among the most widely used ones such as, performance, linear losses of water and the renewal rate of pipes.
II.
EQUIPEMENTS AND METHODS
2.1 Brief presentation of the ADE
The Algerian of Waters (ADE) is a public institution of national competency that insures the services of the drinking water [4]. It was created on the 21th of April 2001 [5].
Among the main objectives of this institution is the improvement of the technical management of facilities in order to reduce the water losses. ADE leads, in the context of annual plans, the shares of repair and replacement of transmission mains and distribution, replacement of valves, replacement and installation of counters, etc. [4]. The area of action of ADE Tlemcen spans several municipalities, among which there is the Urban Group of Tlemcen (GUT).
2.2 Choice of the panel indicators
In an ASP network can meet many problems and different origins: leaks, illegal connections, counting errors, pressure drop, rupture or break in pipes and their accessories, power interruptions and / or insufficient, poor quality of water and others. The contrariety of the consumers on the quality of service provided is manifested by the testimony of complaints at the relevant services. Currently the performance of a network of water supply could not be judged solely on the basis of the marginal cost of supplying water, but should also take into account parameters integrating qualitative aspects of service [6]. The range of performance of the indicators is an effective tool for regulating the quality of water services. They are related to the three functions revealing the quality of service: customer management, resource management and network management. This work was devoted to calculate some simple key indicators, representative, and give an overview on the quality of customer services and the network situation and reflect the level of performance achieved by this latter. The panel of selected indicators is as follows:
• The primary yield of the network of drinking water (%);
• The Linear Index of the primary Loss of the networks of drinking water (m3 / day / km) ; • The linear Index of the leakages repaired ( Nbr / km) ;
• The control of the quality of the water distributed ( rate of the bacteriological and physicochemical Compliancy) (%);
• The possibility of fractional payment ; • The rate of response to the mails (%);
• The rate of respecting the deadline for the reuse of the existing water connections (%); • The rate of respecting the deadline for the new branching (%);
• Rate of unplanned service interruptions; • Renewal rate of network (%);
• Renewal rate of counters (%).
The information to be collected to calculate each indicator must be reliable and precise. The assessment and the evaluation of the indicators can be done in three levels of reliability (good, adequate, poor). It helps to synthesize the measurement accuracy, the quality of the estimations and the possible errors [7].
III.
RESULTATS
The overview on the situation of the network or the level of performance achieved by this latter is apprehended mainly through the collected data and the different selected and calculated indicators.
3.1 The knowledge of the drinking water networks GUT from 2000 to 2012
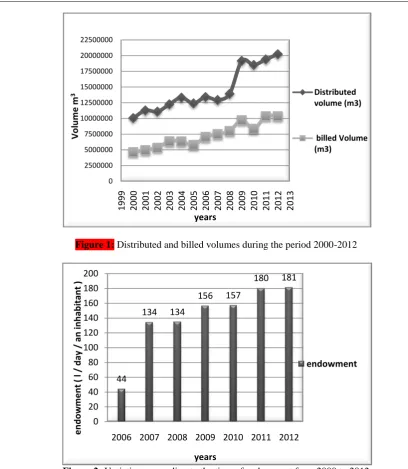
Figure 1: Distributed and billed volumes during the period 2000-2012
Figure 2: Variations according to the time of endowment from 2000 to 2012
The volume of water distributed of the GUT network has doubled during the period analyzed (2000 to 2012) and consequently the volume of water loss has doubled in its turn, increasingly exhausting our natural water resources. In fact, the volume billed is only about half that distributed, the rest is a wasted water due to the network degradation. In addition, although the endowment has improved, from 44 l / day / an inhabitant in 2006 to 181 l / day / an inhabitant in 2012 (theoretical provision calculated from the produced and distributed volume), it remains below the WHO endowment which is 250 l per an inhabitant per day [8].
Four types of consumers are served by ADE: 79% for domestic consumption, 16% for administration, 4% for industry and 1% for businesses (Figure 3).
0 2500000 5000000 7500000 10000000 12500000 15000000 17500000 20000000 22500000
1999 2000 2001 2002 2003 2004 2005 2006 2007 2008 2009 2010 2011 2012 2013
Vo
lu
m
e
m
3
years
Distributed volume (m3)
billed Volume (m3)
44
134 134
156 157
180 181
0 20 40 60 80 100 120 140 160 180 200
2006 2007 2008 2009 2010 2011 2012
e
n
d
o
wm
e
n
t
(
l /
d
ay
/
an
in
h
ab
itan
t
)
years
Figure 3: Services taking advantage of water distributed
3.2 Calculation of the performance indicators
For the calculation of the different selected performance indicators it is necessary to collect some data or basic information (the volume of the distributed water, the volume of the billed water, the number of subscribers, the branching, the total length of the network, the number of leaking for each year, the number of physicochemical and bacteriological quality analysis, the number of claiming, etc...). The indicators of performance to be studied in our work can be classified into three groups: indicators of performance for customer service, indicators of performance of the total quality of the network operation and finally the indicators concerning the renewal and sustainability of patrimony (water).
Indicators of performance relating to the customer service: they allow seeing the quality of service and
the business relationship which is established between the water managers and their clients. They are based on the process of answering to letters and the requests, the response delays, the billing and the type of payment, etc... These indicators provide an overview of the satisfaction of users towards the quality of services offered by the operators of the water systems.
Indicators of performance of the total quality of the network exploitation: they interpret the network
status and assess the extent and causes of its degradation. The bad exploitation and the investment of network (no leaks, no repairs, no renewal of obsolete counters and networks ...) are the origin of these causes.
Indicators concerning the renewal and sustainability of the patrimony (water): These are indicators
reflecting the progress restores by the state (network renovation, repair of leaks,) in order to improve the quality of the customer services and the preservation of the resources.
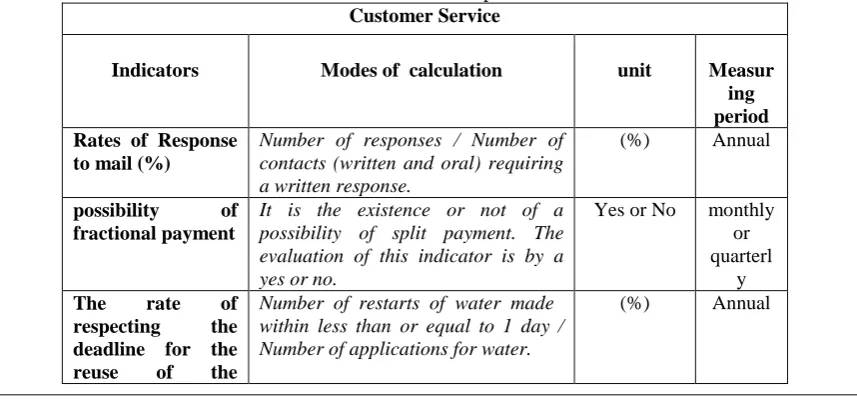
Tables 1, 2 represent respectively the modes of calculation of these indicators and the results obtained.
Table 1: modes of calculation of the performance indicators
Customer Service
Indicators Modes of calculation unit Measur
ing period Rates of Response
to mail (%)
Number of responses / Number of contacts (written and oral) requiring a written response.
(%) Annual
possibility of
fractional payment
It is the existence or not of a possibility of split payment. The evaluation of this indicator is by a yes or no.
Yes or No monthly or quarterl
y
The rate of
respecting the
deadline for the
reuse of the
Number of restarts of water made within less than or equal to 1 day / Number of applications for water.
(%) Annual
household 79% Administration
16%
Commerce 1%
Industrie
existing water connections (%)
The rate of
respecting the
deadline for the
new branching
(%)
Number of connection work carried out in less than or equal to 15 days time (this time after administrative approval and acceptance of the project) / number of plumbing work carried out.
(%) Annual
Total quality of the operation of the drinking water network The primary yield
of the network of
drinking water
(%)
(billed volume / volume to be distributed)
(%) Annual
The Linear Index
of the primary
Loss of the
networks of
drinking water (m3
/ d / km) ;
(Volume to be distributed - billed volume) / 365 (Number of days in the year) / Total length of network;
m3/km/j Annual
Rate of unplanned service
interruptions
There are two definitions: Definition 1(%):
Amount of unscheduled interruptions (time in h × affected population) / (365 × 24 × population served) Definition 2 (nb/1000ab.) (Total number of interruptions / number of subscribers) × 1000
(%)
(nb/1000ina b.)
Annual
The control of the
quality of the
water distributed
(rate of the
bacteriological and physicochemical Compliancy) (%)
(the number of self-consistent distributed water analysis / treasury total distributed water analysis)
(%) Annual
Renewal and sustainability of patrimony Renewal rate of
network (%)
Length renewed or rehabilitated in the year / total network length of the year.
(%) 5 ans
The linear Index of the leakages repaired (Nbr / km)
This is the total annual number of repairs on network (for leaking or rupture) / network length (excluding connection).
nb/km Annual
Renewal rate of counters (%)
Number of counters renewed in the year / total number of counters (only customer counters).
(%) 5 ans
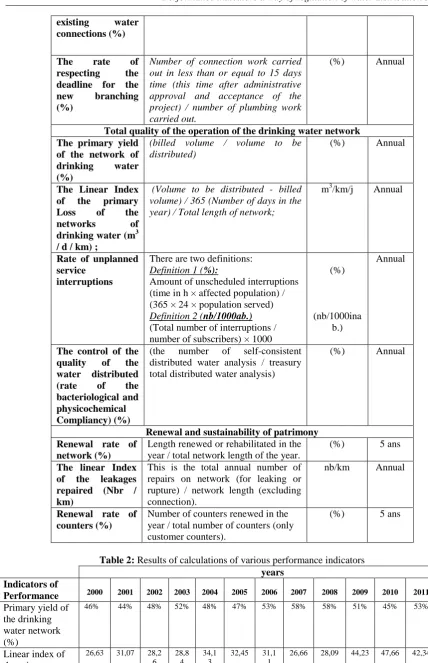
Table 2: Results of calculations of various performance indicators
years Indicators of
Performance 2000 2001 2002 2003 2004 2005 2006 2007 2008 2009 2010 2011 2012
Primary yield of the drinking water network (%)
46% 44% 48% 52% 48% 47% 53% 58% 58% 51% 45% 53% 51%
Linear index of the primary losses (ILL) (m3 / day / km)
26,63 31,07 28,2 6
28,8 4
34,1 3
32,45 31,1 1
The linear Index of the leakages repaired ( Nbr / km)
0,97 ND 4,72 4,15 3,38 4,47 4,40 2,94 2,69 4,68 5,12 4,64 4,67
Rate of Bacteriological compliance (%)
ND ND ND ND ND ND ND ND 99,87 100 98,38 98,82 96,35
Rate of
Physicochemical compliance (%)
ND ND ND ND ND ND ND ND 99,71 100 99,62 99,63 97,54
Renewal rate of network (%)
ND ND ND 0,17 4,86 0,35 ND 10,01 ND ND 1,8 1,26 1,45
possibility of fractional payment
Non Non Non Non Non Non Non Non Non Non Non Non Non
Rates of
Response to mail (%)
ND ND ND ND ND ND ND ND 60 70 70 80 80
Renewal rate of counters (%)
ND ND ND ND ND ND ND ND 0,48 0,82 0,46 0,50 0,19
ND: Not Defined
IV.
DISCUSSIONS OF THE RESULTS
4.1 The primary yield of the drinking water network
This indicator represents the inter annual evolution of the network performance. It is essential to see the degradation or otherwise improving the state of the network over the years. Only authorized volumes consumed are taken into account in the calculation of primary efficiency.
In other countries, the primary yield is a key indicator of the water services. To fully interpret it, it is useful to analyze it in parallel with the following indicators:
- Linear index of loss;
- Number of leaking (reflecting the state of the network); - Renewal rates;
- Rate of searching of leaking.
The average departmental value of the Algerian national networks of performance was 50 % [4]. However, the counties of the GUT had, during the years of analysis from 2000 to 2012 which we conducted, a value of primary yield and/or around 50%, except those of 2007 and 2008 where the primary yield was of 58% with an improvement of 12 points of that obtained in 2000. So, the drinking water networks of the GUT lose about half of the water distributed annually and therefore a big waste of our water resources. Taking into account the age of the network, the low efficiencies are justified.
This indicator is very representative of the degraded state of the network despite the efforts made by the authorities in this field (large renewal projects Alumni).
In France, the primary yield usually chosen to quantify the water losses in their networks exceeds 90% for almost all parts of their networks.
The different hydraulic organisms at a national level believe that the continuation of the current management, which already includes measures to reduce leaking and commercial losses, can lead to a distribution of primary yield of about 70% in 2025 and 75 % in 2030.
4.2 The Linear Index of the primary loss of drinking water networks (ILL)
The primary yield is not always a relevant indicator of the state of a network; the analysis can be confirmed by calculating the Index of Linear Loss (ILL).
parallel with the performance, the number of leaking, the leaking detection rate and the renewal rate of the network.
According to the results obtained, the network of GUT presents during all the years analyzed a poor ILL as shown in Table 2. The annual average population density is greater than 5000 inhabitants and according to [9] the value of the ILL for such density should be between 5 and 10. While the values obtained are much more important than this value.
According to the same table we can see that the ILL does not really have a direct relationship with the performance. Indeed, in 2000 the primary yield was 46 % and in 2007, 58% while the ILL stays almost the same (about 26.6 (m3 / day / km)). In addition, the Linear Losses index has deteriorated from 26.63m3/km/day in 2000 to 46.17 in 2012 while it must be improved. This is probably due to all of the following:
The increase of the size of the population and therefore the length of the network;
Defaults of counting due to a drift of the counter and a bad reading ;
The wastage due to malfunctions , operating error , etc. ;
The volumes diverted through illegal connections or unknown water services;
The needs of the services (purges , cleaning systems , ... ) ;
And finally, the leaking (bad sealing of pipes and bad connections).
So, the Algerian of waters (ADE) must be mindful and implement appropriate preventive and curative techniques to reduce these losses.
These losses represent an economical shortage (cost of production, processing, electricity for pumping, etc...). Indeed , considering that the average price of drinking water, according to the Algerian scale of rates is 64 DA / m3 (0.44 € / m3) (including sewerage charges and fees for the economy and the protection of water) (Benblidia 2011), the cost of all water losses can be estimated to more than 500 million Algerian dinars per year. However, it is technically impossible to cover all these expenses. It should be noted that 64 Algerian Dinars is the selling price for one m3 of drinking water, while its production cost was estimated in 2005 at about 90 Algerian Dinars / m3 and must currently be in the range of 125 to 150 Algerian Dinars per m3 (including seawater desalination) [4]. So the economic losses are more important. In addition to the economic losses, the volumes of water lost, constitute an ecological waste of our natural water resources. These losses are particularly harmful and may lead to a risk of lack of water.
The losses of Drinking water due to outdated national level networks are estimated at 30 % and for illegal taps of the order of 10%. These losses are cutting back on an already low water volume [10]. The leaks are also considered a health hazard. The leakage points can also be a possible risk of pollution exchange with the external environment.The bacteriological contamination or even physicochemical, which will deteriorate the quality of the water, are then, possible. Today, the bill of the epidemics WDT (Waterborne Diseases Transmission) is heavy for the Algerian government. The cost of these epidemics was estimated at the equivalent of the construction budget of more than a dozen of water treatment stations [10]. Finally, leakage decreases the reliability of service in terms of continuity: the breakings of the pipeline make the pressure drop and even cause the interruption of the service. The repairs often require to cut of supplying water of a suburb and to stop the traffic when the pipes are under the ground.
4.3 The linear Index of the leakages repaired
The length of the network introduced in the calculation of this indicator is only the length of the transfer pipelines and the distribution. In the first site, it is clear that not all the leakages detected are repaired.
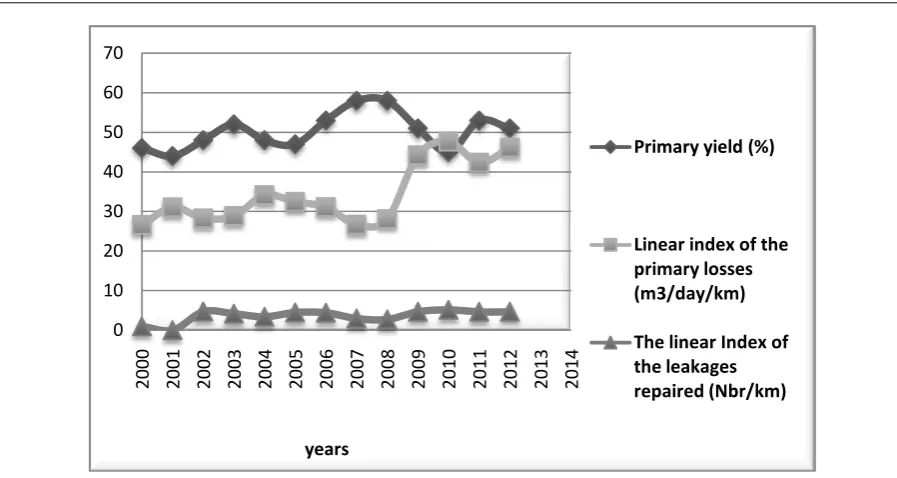
Figure 4: Variation of the ILL (m3/day/km) and the linear index of the leakage repaired (Nb/km) with the primary yield (%)
4.4 The control of the quality of the water distributed
Monitoring the quality of water distribution has a crucial importance and interest because this indicator reflects the sanitary quality of the service. A high quality of self control reflects a special effort of the operator to monitor the quality of the service. The first advantage of using this indicator is that the information necessary for the calculation is available at the quality analysis laboratory of ADE.
From the results obtained (see Table 2) we can notice that the bacteriological and physicochemical analyses of the samples collected at the distribution network GUT are not 100% congruent for all years studied except, for that of year 2009 where we have a compliance rate of 100%. But overall, we can say that the quality of the water is more or less good.
4.5 The possibility of fractional payment
The payment of bills by consumers is made in full and there is no possibility to split the amount.
4.6 The rate of response to the mails
Unfortunately, the data for this indicator is not available the years of 2000 to 2007. However, about the period between 2008 and 2012, we can see an improvement in the response rate to mails going from 60% in 2008 to reach 80% which stays satisfactory. According to the head of department of sales at the ADE, the remaining 20% are insignificant claims.
The interest of calculation of this indicator is that the source of information is directly available and that they carry on objective topics (unpleasant smell or taste of the water supplied, leakage ...) which go directly into the influence of the Algerian of Waters. It allows easily monitoring the developments of the services to clients.
4.7 The rate of respecting the deadline for the reuse of the existing water connections
The rewetting concerns only the requests of subscribers who have already a functional connection. It does not take into account the delay of the establishment of the new connections which require a certain time for the procedure, the quotations and a longer authorization.
The delay of one day is to be taken in the following sense: before the evening of the day which follows the request (excluding weekends) [1]. These requirements made very difficult the calculation of this indicator, as requested in our case. Indeed, it was difficult to follow the rules to calculate this indicator by lack of necessary data. This type of indicator requires specific programs or software to be able to take the data needed. In addition, the managers of our services did not seriously think to record the number of cuts and rewetting only since the end of the year 2010.
From the data obtained, we can say that the average of the rewetting per day was reduced from 45 repairs / day in 2011 to only 18 repairs / day in 2012.
4.8 The rate of respecting the deadline for the new branching 0
10 20 30 40 50 60 70
2000 2001 2002 2003 2004 2005 2006 2007 2008 2009 2010 2011 2012 2013 2014
years
Primary yield (%)
Linear index of the primary losses (m3/day/km)
The delay of 15 days is to be taken after administrative approval and acceptance of the project. Weekends and holidays are taken into account in this period.
The same problems encountered in collecting data for the calculation of the indicator concerning the existing water connection, were faced for the calculation of this indicator. Indeed, it is difficult to know the number of connections done in 15 days or less of the time of the administrative approval and acceptance of the project without using special software.
The only result of the work on new connections is that their number went from 695 connections realized in year 2011 to 518 connections in year 2012. These results are not representative where the number of new connections done depends on the evolution of the population and cannot in any case to assess the quality of services provided by the manager (ADE) of the drinking water network.
4.9 Rate of unplanned service interruptions
For this indicator, it is difficult to extract information on the number of interruptions as their causes and types are much diversified. Different problems for the calculation of the rate of compliance with the deadline topping up existing connections and the rate of compliance with the deadline for completion of new branch are laid for the calculation of this indicator, which can give us a representative picture on the operation, performance and continuity of service. This in turn requires a precise measurement system to record different types of interruption and be able to calculate: scheduled interruptions (number of planned work resulting cut) interruptions due to breakage due to the age of the network or caused by third (number of interventions on network leakage or rupture requiring water cuts) and end -related disruptions to production (number of passes under the low level in the tanks).This indicator is still not followed even in France and rarely mentioned in their annual reports. In the other hand, in England, monitoring of cuts is regularly carried out [7].
4.10 Renewal rate of counters
The renewal of obsolete and blocked counters can improve the turnover, master the volumes billed and avoid under-counting problems and estimates of consumption by customers. But unfortunately the rates of changing the counters at the UGT network are not very satisfactory and we see increasingly a negative cadence since 2010. While this aspect of counting is an important segment improve the quality of service.
4.11 Renewal rate of the network
The length renewed or rehabilitated of the network affects only the existing sections replaced by more lengths rehabilitated by jacketing.The renewal rate does not make sense on the annual scale. The assessment of this indicator over a longer period better reflects the existence or absence of a renewal policy needed to sustain the service. That is why it is necessary to follow over a period of at least 5 years for a trend. In France, a reference rate can be estimated to 2%, but in practice, a lower rate is possible. This indicator is to be compared with the indicators on the state of the network (the non-renewal with deteriorating condition might reflect a problem of wealth management) [1].
The examination of the evolution of the turnover of the Group Urban of Tlemcen network gave an idea about the efforts of heritage conservation and preservation of the resource.
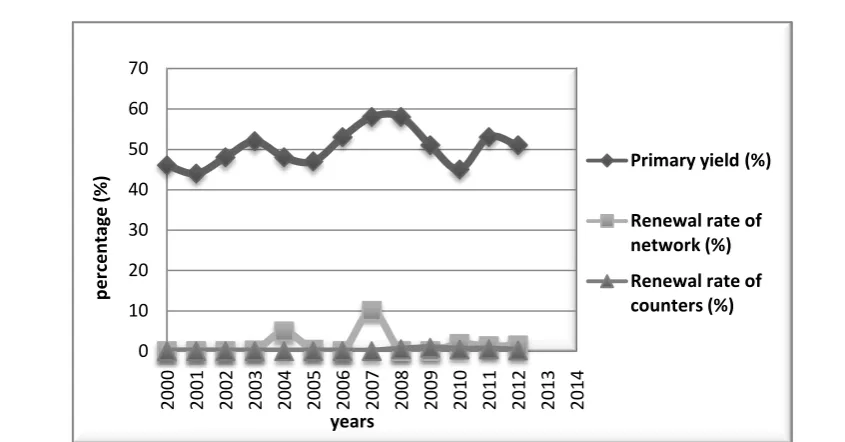
Figure 5: variation of the primary Yield (%) with the rate of change of counters and network
V.
CONCLUSION
The analyses realized on the network of Urban Group of Tlemcen using selected performance indicators show its degradation. Water losses are very important and the primary yield is very low adjoining 50%. Indeed, the efforts to repair leakage, to renew the pipes and counters that must participate in heritage conservation and the positive changes in efficiency are very low. In addition, bacteriological and physicochemical analyses are not to 100% congruent which may present a risk of accidental waterborne diseases. Therefore, these indicators may well demonstrate the level of performance of our networks to find the best solutions for improvement. Most indicators under technical data are available or could be structuring information collected in the field, but not always developed. The most important thing is to define in advance indicators to follow and the information to collect. Indicators concerning continuity of service (rate service interruptions) are among the indicators that are still poorly monitored.
VI.
ACKNOWLEDGEMENTS
We would like to thank all those who facilitated our access to information at the following institutions: • The Algerian of waters (ADE) of Tlemcen
• The Water Department of the wilaya (DHW) of Tlemcen
VII.
ABBREVATIONS
ADE: Algerian of Water
DHW: Water Department of the wilaya GUT: Urban Group of Tlemcen H24: 24 hours a 24
ILL: Index Linear primary loss of drinking water systems IP: performance indicator
WDT: Waterborne Diseases Transmission DA: Algerian Dinar
REFERENCES
[1]. Guerin -Schneider, L. Performance indicators for water and sanitation services in the follow-up by the authorities, 2001, Laboratory GEA – ENGREF, Attachment to the thesis: Insert performance measurement in the regulation of water and sanitation services in France and Instrumentation Organization.
[2]. Guerin –Schneider, L. ; Nakhla, M. Performance indicators: a key development in the management and regulation of water and sanitation services, Flux, 2003/2 n° 52-53, p. 55-68.
[3]. Cousquer, Y.; Dumont, J.; Hanus, F.; Lavoux, T.; PRIME, J.L. The performance indicators used for public water services and sanitation: Findings and proposals, Report No. 2004 - 0062-1 - 2005.
[4]. Benblidia, M. The efficiency of water use and economic approach, Blue Plan, 2011, National Study, Algeria, Regional Activity Centre PNUE/PAM.
0 10 20 30 40 50 60 70
2000 2001 2002 2003 2004 2005 2006 2007 2008 2009 2010 2011 2012 2013 2014
p
e
rc
e
n
tage
(%
)
years
Primary yield (%)
Renewal rate of network (%)
[5]. Bourouba, N.; Hadjadj,; W. Bergeron J. ; Voyer, G. Sector Study: Area of water businesses, 2006, Algerian- Canadian Domain Project Water, National Institute of Vocational Training. APC Project: AL2500.
[6]. Bouscasse, H.; Destandau F. ; Garcia, S. Economic analysis of the costs of water supply and quality of services offered to users, 2008, INDUSTRIAL ECONOMY REVIEW, n°122, 2ème trimester.
[7]. Guerin -Schneider, L. Introduce performance measurement in the regulation of water and sanitation services in France: Instrumentation and organization, 2001, Thesis for the degree of Doctor of ENGREF Specialty: Management - Water Science, National School of Rural Engineering, Water and Forestry Centre of Paris.
[8]. Kadi, A. The water management in Algeria, Hydrological Sciences Journal, Volume 42, Issue 2 (2009), 1991-1997.
[9]. Elazzouzi, M.L. Regulating services of water distribution performance indicators for self- governed companies and delegates, 2009, Master in Management and Engineering of Water and Sanitation Services (MISEA).