Experimental Studies in Machining Duplex Stainless Steel using
Response Surface Methodology
1
M. Thiyagu,
2L. Karunamoorthy,
3N. Arunkumar
1Research scholar (Ph.D) Department of Mechanical Engineering, Anna University, Chennai, India.
2
Professor and Head, Department of Mechanical Engineering, Anna University, Chennai, India
3Professor and Head (Student Affairs), Department of Mechanical Engineering, St. Joseph’s college of Engineering, Chennai,
India
Abstract-- Duplex stainless steel (DSS) comes under hard to machine material owing to its inherent properties. In this experimental study an attempt has made in turning DSS UNS 31803 (2205) with the objective of minimizing surface roughness and cutting force. The design of experiments and optimization were done using Box–Behnken design (BBD) and Response surface methodology (RSM). The factors and levels considered for experimentation includes cutting speed, feed rate, depth of cut, and tool nose radius in three levels. A second-order response surface models developed for surface roughness and cutting force were used in predicting the response in the design space. The Analysis of variance (ANOVA) and R-Squared value reveals the developed models were significant. The experimental results obtained indicate that feed rate and cutting speed were the more influential factors for surface roughness. Surface roughness increases with increase in the feed rate and cutting speed. For cutting force feed rate and nose radius are the significant factors. In addition the models adequacy was validated using confirmation experiments. The prediction error accounts from -4.07 to 0.55% for surface roughness and -2.47 to 2.52% for cutting force.
Index Term— CUTTING FORCE, DUPLEX STAINLESS
STEEL, RESPONSE SURFACE METHODOLOGY, SURFACE ROUGHNESS
I. INTRODUCTION
Duplex stainless steel (DSS) contains a mixed microstructure o f about equal proportions of austenite and ferrite allowing a combination excellent mechanical properties and high corrosion resistance [1]. Currently, these steels are being
used in replacement of austenitic stainless steels in several
industrial applications like piping, desalination plants, vessels, valves & fittings, fasteners, heat exchangers and construction materials.
High work hardening rate, low heat conductivity and high toughness have a synergistic effect in inducing machining difficulties in DSS. The new developments in cutting tools and improvements in coating technologies provides a combination o f abrasion wear resistance and chemical stability at high temperature to meet the demands of application. The knowledge of cutting forces, tool wear, surface quality and cutting tool tip temperature developed in various machining processes under given cutting conditions is being a dominating criterion of material machinability, to both the designer, machine tools manufacturer, as well as to end user. In actual industrial environment, the selection of appropriate machining parameters and cutting tool parameters is difficult
and relies heavily on the operators experience and the data provided by the machine tool builder and cutting tool supplier for the target material. Hence, the optimization of cutting conditions is of great importance where the economy and quality of a machined part play a key role. Common methods of evaluating machining performance in a turning operation are based on performance characteristics such as s u r f a c e r o u g h n e s s , t o o l life and cutting force. In conventional turning operations, these performance characteristics are strongly correlated with cutting parameters such as feed rate, cutting speed and depth of cut [2].
Fig. 1. Fundamental Turning operation
surface methodology (RSM). The results obtained indicate that the surface roughness increases with increase in the cutting speed and the feed rate, whereas tangential force increases with increase in approach angle and depth of cut [7]. Ihsan Korkut et al. investigated the influence of cutting speed on tool wear and surface roughness in machining AISI 304 austenitic stainless steel. A decrease in tool wear was observed with increasing the cutting speed up to 180 m/min. Surface roughness (Ra) was also decreased with increasing the cutting speed [8].
N.Tosun, L.Ozler studied the effect of machining parameter on surface roughness and tool life in hot turning of high manganese steel. The results showed that cutting speed and feed rate were the dominant variables on multiple cutting performance characteristics [2]. B. C. Routara, A. Bandyopadhyay, P. Sahoo presented a desirability function approach to study the optimal combination of machining parameters for multiple performance characteristics of the surface roughness parameters in turning mild steel. The signal-to-noise ratio is employed to investigate the optimal combination of cutting parameters to yield maximum overall desirability [9]. Ahmet Hasçalık and Ulaş Çaydaş used
Taguchi method in optimization of machining parameters on surface roughness and tool life in a turning of commercial Ti-6Al-4V alloy using CNMG 120408-883 insert cutting tools. The conclusions revealed that the feed rate and cutting speed were the most influential factors on the surface roughness and tool life [10]. Yigit Kazancoglu et.al investigated the multi-response optimization of the turning process for an optimal parametric combination to yield the minimum cutting forces and surface roughness with the maximum material-removal rate (MRR) using a combination of a Grey relational analysis (GRA) and the Taguchi method. The analysis-of-variance method (ANOVA) used to identify the significance factors [11]. Sahoo and Sahoo developed the mathematical model and parametric optimization for surface roughness in turning D2 steel using TiN coated carbide insert using Taguchi parameter design and RSM [12]. Work to date has shown that very little work has been carried on the determination of optimum machining parameters when machining DSS. This instigated to conduct machining study on DSS. In this study, turning tests were carried on UNS 31803 (2205) DSS under dry condition to determine the optimum machining parameters and cutting tool geometry. Turning is one of the fundamental machining processes, especially for the finishing of machined parts.
RESPONSE SURFACE METHODOLOGY
The RSM is practical, economical and relatively easy for use and it was used by lot of researchers for modeling, analysis and optimization of machining processes. RSM is a collection of mathematical and statistical techniques that are useful for the modeling and analysis of problems in which a dependent variable y called response is influenced by several independent variables x1, x2, …xk called factors and the
objective is to optimize the response [13]. If all of these variables are assumed to be measurable, the response surface
can be expressed as
( ) ( )
Optimizing the response variable y, it is assumed that the independent variables are continuous and controllable by the experimenter with negligible error. The response or the dependent variable is assumed to be a random variable. The efficiency of the response surface analysis is significantly influenced by selecting the proper choice of experimental designs. Two types of RSM are available for experimentation and they are Central Composite Design (CCD) and Box- Behnken Design (BBD) [13], [14].CCD can be used when a comparatively accurate prediction of all response variable averages related to quantities measured during experimentation. Box-Behnken Design is normally used when performing non-sequential experiments. That is, performing the experiment only once. Both of these methodologies can be used to develop second-order quadratic relationship between the experimental factors and the responses. These designs allow efficient estimation of the first and second –order coefficients. Box-Behnken design involves fewer design points, they are less expensive to run than central composite designs with the same number of factors. Box-Behnken Design do not have axial points, thus we can be sure that all design points fall within the safe operating zone.
In RSM analysis, the approximation of y was proposed using the fitted second-order polynomial regression model which is called the quadratic model. The quadratic model of y can be written as follows:
∑ ∑ ∑
( )
Where y is the dependent variable (response), xi is
independent variable (factors), a0 is constant regression co-efficient, ai is first-order co-efficient, ai i is pure quadratic co-efficient, ai j is interaction term co-efficient, and ϵ is random error which is assumed to be normally independently distributed . In our study BBD has been utilized for the designing the plan of experiments. In our study BBD has been utilized for the designing the plan of experiments.
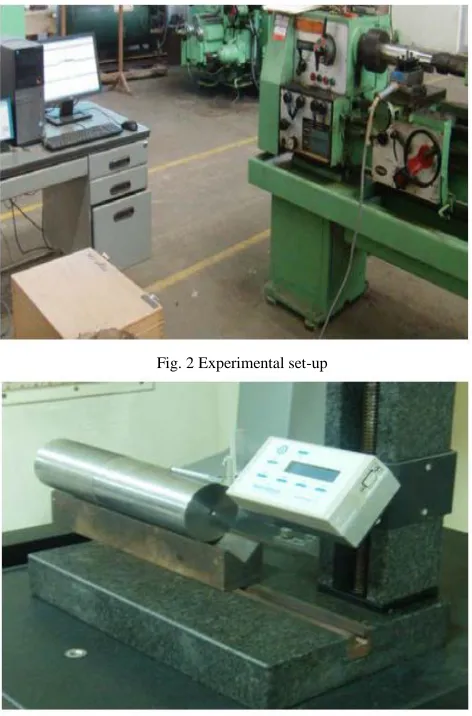
II. EXPERIMENTAL DETAILS A. EXPERIMENTAL SETUP
from 0.048-0.716 mm/rev. The arrangement of experimental setup is shown in Fig. 2. Kistler lathe tool dynamometer (Type 9257B+9403) in conjunction with Dynoware software and a personal computer was used to measure the three components of cutting force (i.e.) feed force (Fx), radial force
(Fy) and main cutting force (Fz).
The surface roughness average (Ra) was the average deviation of the profile from the centerline along the sampling length (L):
∫ | ( )| ( )
Where x is the profile direction and Y is the ordinate of the profile curve. The surface roughness of duplex stainless steel (UNS 31803) has been measured using Surtronic 3+ stylus type roughness tester manufactured by Taylor Hobson with a cut-off length of 0.8mm and resolution 0.01µm. The measurement set-up shown in Fig 3.
Fig. 2 Experimental set-up
Fig. 3 Surface Roughness measurement set-up
B. WORK MATERIAL
The material selected for study was UNS 31803 (2205) DSS of diameter 75mm and length 300mm. Material hardness was 229 BHN. The chemical composition and mechanical properties of work material has been shown in TABLE I & II.
TABLE I CHEMICAL COMPOSITION Test Method: OES-ASTM E-1086-94 (2005)
UNS 31803 (2205)
C% Mn% Si% S% P% Cr% Ni%
0.014 1.576 0.511 0.012 0.029 21.390 4.896
Mo% Ti% V% Co% Nb% Pb%
2.516 0.012 0.069 0.075 0.030 0.000
TABLE II MECHANICAL PROPERTIES Test Method : ASTM A 370-08a, IS 1500 - 2005
UNS 31803 (2205)
Tensile
Strength,
N/Sq.mm
Yield
Strength,
N/Sq.mm
Elongation
on 40 mm
G.L (%)
Reduction Area,(%)
797.18 701.64 28.14 75.46
C. CUTTING TOOL & HOLDER
Cutting tool for experimentation was carbide insert with ISO specification CNMG 120408 SM grade 1115 Sandvik Coromant make with PVD multi-layer coating (TiAlN + Chromium Oxide). Turning Tool-Holder PCLNR M12 with 25x25mm Shank size, right hand use.
D. EXPERIMENTAL DESIGN
Fig. 4. Proposed Research methodology
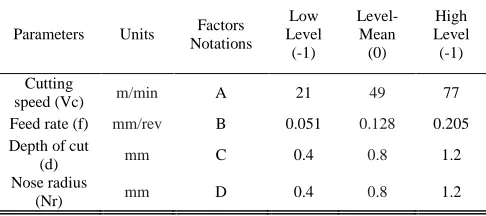
As seen in Table III, the four cutting parameters cutting speed (Vc-m/min), feed (f- mm/rev), depth of cut (d-mm) and tool nose radius (Nr-mm) were raised to three levels as per BBD. The response surface design and analysis was performed using a design of experiment package, DESIGN EXPERT Version 7.0. The experimental design layout show in TABLE IV. The experiments were carried out randomly to minimize the effect of unexplained variability in the observed responses due to extraneous factors.
TABLE III EXPERIMENTAL FACTORS AND LEVELS
Parameters Units Factors
Notations Low Level
(-1)
Level- Mean (0)
High Level (-1) Cutting
speed (Vc) m/min A 21 49 77
Feed rate (f) mm/rev B 0.051 0.128 0.205
Depth of cut
(d) mm C 0.4 0.8 1.2
Nose radius
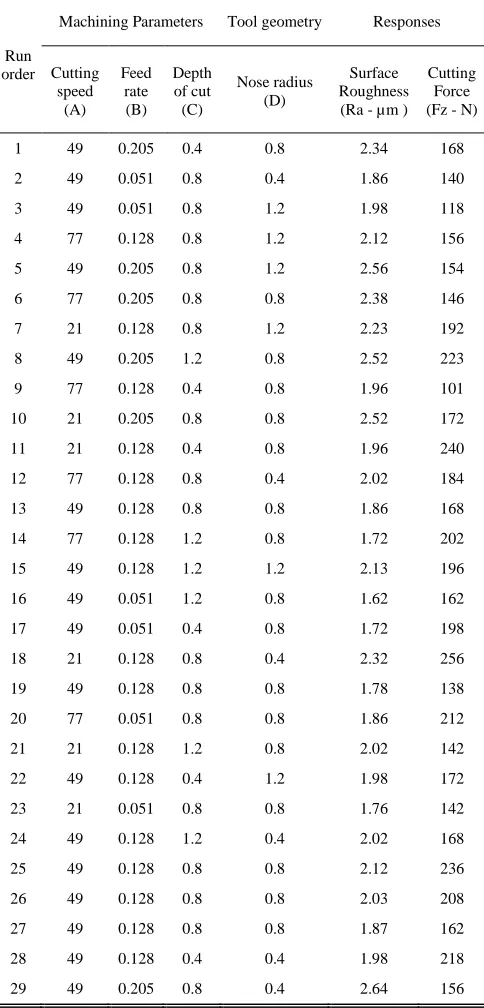
TABLE IV
DESIGN LAYOUT MATRIX AND EXPERIMENTAL RESULTS
Run order
Machining Parameters Tool geometry Responses
Cutting speed
(A) Feed
rate (B)
Depth of cut
(C)
Nose radius (D)
Surface Roughness (Ra - µm )
Cutting Force (Fz - N)
1 49 0.205 0.4 0.8 2.34 168
2 49 0.051 0.8 0.4 1.86 140
3 49 0.051 0.8 1.2 1.98 118
4 77 0.128 0.8 1.2 2.12 156
5 49 0.205 0.8 1.2 2.56 154
6 77 0.205 0.8 0.8 2.38 146
7 21 0.128 0.8 1.2 2.23 192
8 49 0.205 1.2 0.8 2.52 223
9 77 0.128 0.4 0.8 1.96 101
10 21 0.205 0.8 0.8 2.52 172
11 21 0.128 0.4 0.8 1.96 240
12 77 0.128 0.8 0.4 2.02 184
13 49 0.128 0.8 0.8 1.86 168
14 77 0.128 1.2 0.8 1.72 202
15 49 0.128 1.2 1.2 2.13 196
16 49 0.051 1.2 0.8 1.62 162
17 49 0.051 0.4 0.8 1.72 198
18 21 0.128 0.8 0.4 2.32 256
19 49 0.128 0.8 0.8 1.78 138
20 77 0.051 0.8 0.8 1.86 212
21 21 0.128 1.2 0.8 2.02 142
22 49 0.128 0.4 1.2 1.98 172
23 21 0.051 0.8 0.8 1.76 142
24 49 0.128 1.2 0.4 2.02 168
25 49 0.128 0.8 0.8 2.12 236
26 49 0.128 0.8 0.8 2.03 208
27 49 0.128 0.8 0.8 1.87 162
28 49 0.128 0.4 0.4 1.98 218
29 49 0.205 0.8 0.4 2.64 156
III. ANALYSIS
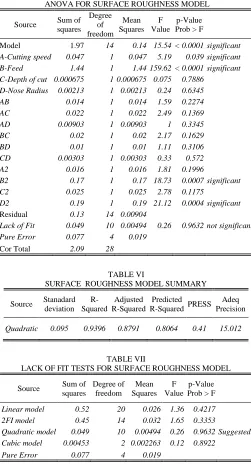
The experimental data were used to develop the quadratic response surface model for surface roughness and cutting force. From TABLE V Model F-value of 15.54 implies the model is significant. There is only a 0.01% chance that a "Model F-Value" this large could occur due to noise. Values of "Prob > F" less than 0.0500 indicate model terms are significant. In this case A, B, B2, D2 are significant model terms. Values greater than 0.1000 indicate the model terms are not significant. The determination co-efficient “R-Squared” is a measure of the degree of fit. When “R-“R-Squared”
TABLE V
ANOVA FOR SURFACE ROUGHNESS MODEL
Source Sum of
squares Degree of freedom Mean Squares F Value p-Value
Prob > F
Model 1.97 14 0.14 15.54 < 0.0001 significant
A-Cutting speed 0.047 1 0.047 5.19 0.039 significant
B-Feed 1.44 1 1.44 159.62 < 0.0001 significant
C-Depth of cut 0.000675 1 0.000675 0.075 0.7886
D-Nose Radius 0.00213 1 0.00213 0.24 0.6345
AB 0.014 1 0.014 1.59 0.2274
AC 0.022 1 0.022 2.49 0.1369
AD 0.00903 1 0.00903 1 0.3345
BC 0.02 1 0.02 2.17 0.1629
BD 0.01 1 0.01 1.11 0.3106
CD 0.00303 1 0.00303 0.33 0.572
A2 0.016 1 0.016 1.81 0.1996
B2 0.17 1 0.17 18.73 0.0007 significant
C2 0.025 1 0.025 2.78 0.1175
D2 0.19 1 0.19 21.12 0.0004 significant
Residual 0.13 14 0.00904
Lack of Fit 0.049 10 0.00494 0.26 0.9632 not significant
Pure Error 0.077 4 0.019
Cor Total 2.09 28
TABLE VI
SURFACE ROUGHNESS MODEL SUMMARY
Source Stanadard
deviation R-Squared Adjusted R-Squared Predicted
R-Squared PRESS
Adeq Precision
Quadratic 0.095 0.9396 0.8791 0.8064 0.41 15.012
TABLE VII
LACK OF FIT TESTS FOR SURFACE ROUGHNESS MODEL
Source Sum of
squares Degree of freedom Mean Squares F Value p-Value
Prob > F
Linear model 0.52 20 0.026 1.36 0.4217
2FI model 0.45 14 0.032 1.65 0.3353
Quadratic model 0.049 10 0.00494 0.26 0.9632 Suggested
Cubic model 0.00453 2 0.002263 0.12 0.8922
Pure Error 0.077 4 0.019
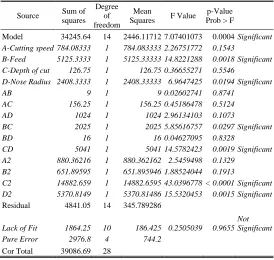
TABLE VIII
ANOVA FOR CUTTING FORCE MODEL
Source Sum of
squares Degree
of freedom
Mean
Squares F Value
p-Value
Prob > F
Model 34245.64 14 2446.11712 7.07401073 0.0004 Significant
A-Cutting speed 784.08333 1 784.083333 2.26751772 0.1543
B-Feed 5125.3333 1 5125.33333 14.8221288 0.0018 Significant
C-Depth of cut 126.75 1 126.75 0.36655271 0.5546
D-Nose Radius 2408.3333 1 2408.33333 6.9647425 0.0194 Significant
AB 9 1 9 0.02602741 0.8741
AC 156.25 1 156.25 0.45186478 0.5124
AD 1024 1 1024 2.96134103 0.1073
BC 2025 1 2025 5.85616757 0.0297 Significant
BD 16 1 16 0.04627095 0.8328
CD 5041 1 5041 14.5782423 0.0019 Significant
A2 880.36216 1 880.362162 2.5459498 0.1329
B2 651.89595 1 651.895946 1.88524044 0.1913
C2 14882.659 1 14882.6595 43.0396778 < 0.0001 Significant
D2 5370.8149 1 5370.81486 15.5320453 0.0015 Significant
Residual 4841.05 14 345.789286
Lack of Fit 1864.25 10 186.425 0.2505039 0.9655
Not Significant
Pure Error 2976.8 4 744.2
Cor Total 39086.69 28
TABLE X
LACK OF FIT TESTS FOR CUTTING FORCE MODEL
Source Sum of
squares Degree of freedom Mean Squares F Value p-Value Prob > F
Linear model 27665.39 20 1383.2695 1.8587 0.2905
2FI model 19394.14 14 1385.2957 1.8615 0.2891
Quadratic model 1864.25 10 186.4250 0.2505 0.9655 Suggested
Cubic model 128.25 2 64.1250 0.0862 0.9191
Pure Error 2976.8 4 744.2
IV. DIAGONISTIC STUDIES
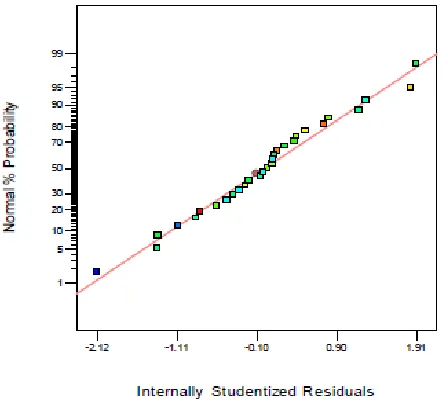
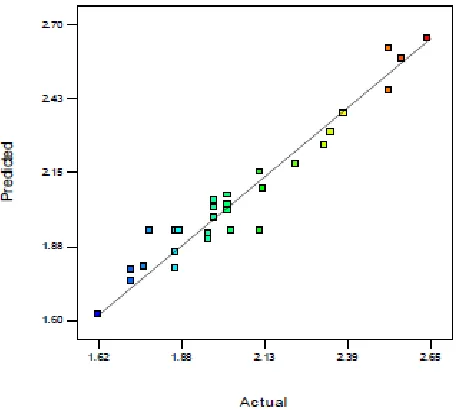
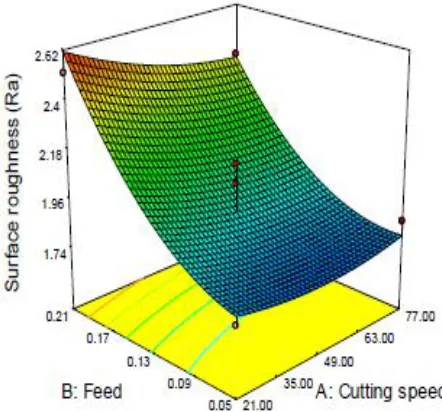
In Fig.5 (a) and 5(b) the normal probability plots of the residuals for surface roughness and cutting force follows a straight line implying that the errors (residuals) were normally independently distributed. Fig. 6(a) and 6(b) depicts the plot of actual response value to the predicted for surface roughness and cutting force. All points fall evenly on both sides of the 45º line. From the analysis of contour plot 7(a) and 3D-plots
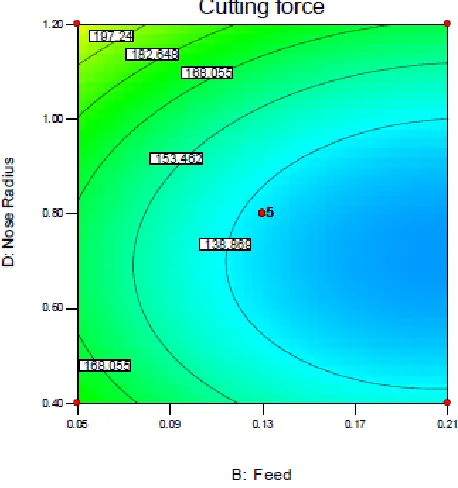
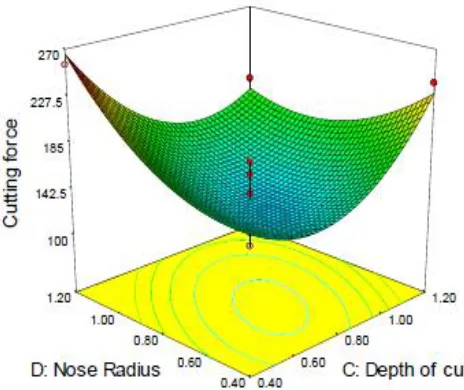
8(a), 8(b) for surface roughness the least value of surface roughness 1.732 µm was evident at cutting speed 22 m/min, feed 0.051mm/rev, depth of cut 0.4mm and nose radius 0.8mm. From the analysis of contour plot 7(b) and 3D-plots 9(a), 9(b) for cutting force the least value of cutting force 136.776 N was evident at cutting speed 49 m/min, feed 0.13mm/rev, depth of cut 0.8mm and nose radius 0.8mm. TABLE IX
CUTTING FORCE MODEL SUMMARY
Source Standard
deviation R-Squared
Adjusted R-Squared
Predicted
R-Squared PRESS
Adeq. Precision
Fig. 5(a) Normal probability plot of Residuals for Surface roughness
Fig. 6(a) Actual Vs Predicted value of Surface roughness
Fig. 7(a) Contour plot of two factor interaction A and B for Surface roughness
Fig. 8(a) 3-D plot Interaction of A and B for Surface roughness
Fig. 9(a) 3D- plot Interaction of B and C for Cutting force
Three confirmation experiments were conducted to validate the adequacy of the developed quadratic models. In the prediction interval of 95% the predicted value and actual experimental value were compared and the residual and error percentage were calculated. The confirmation test results shown in TABLE XI and XII. The percentage error range lies between -4.07 to 0.55% for surface roughness and -2.47 to 2.52% for cutting force. The test results lies within the 95% prediction interval.
TABLE XII CONFIRMATION TESTS
Machining parameter & Tool geometry Cutting force (Fz - N)
Cutting speed (A)
Feed rate (B)
Depth of cut (C)
Nose radius
(D) Actual Predicted Residual
Error %
77 0.205 0.8 0.8 146 143.79 2.21 1.51
77 0.128 1.2 0.8 202 206.998 -5.00 -2.47
49 0.051 0.4 0.8 198 193.006 4.99 2.52
IV. RESULTS AND CONCLUSION
In this w o r k , the s e c o n d – o r d e r response surface models for surface roughness and c u t t i n g force were developed to study the effect of machining parameters and tool geometry in turning of DSS UNS 31803 grade alloy. The machining trials were executed as per BBD layout matrix developed using RSM. The analysis and optimization were done using R S M . T he fo l l o wi n g conclusions were dra wn based on this study.
1) The normal probability plot of residuals confirms that the errors are normally independently distributed in the design space.
2) The feed rate is the significant contributor to the better surface finish followed by the spindle speed and nose radius. Increase in feed rate increases surface roughness. This result is in line with the study made by G.Krolczyk et al. in machining duplex stainless steel. 3) The feed rate and nose radius are significant factors in
minimizing cutting force followed by cutting speed. 4) The diagnostic analysis for surface roughness reveals the
least value of surface roughness 1.732 µm at cutting speed 22 m/min, feed 0.051mm/rev, depth of cut 0.4mm and nose radius 0.8mm. For cutting force the minimum value 136.776 N was evident at cutting speed 49 m/min, feed 0.13mm/rev, depth of cut of 0.8mm and nose radius 0.8mm.
5) The developed model is adequate for predicting the response within the 95% prediction interval. The same was confirmed through three sets of confirmation experiments
REFERENCES
[1] Villalobos et al. (2009). Microstructural changes in SAF 2507
super duplex stainless steel produced by thermal
cycle. Revista Matéria. 14( 3), pp. 1061 – 1069.
[2] N.Tosun & L.Ozler. (2004). Optimization for hot turning
operations with multiple performance characteristics. Int J Adv
Manuf Technol. 23, pp. 777–782.
[3] G. Krolczyk, S. Legutko, M. Gajek . (2013). Predicting the surface
roughness in the dry machining of duplex stainless steel DSS). Metabk . 52(2), pp. 259–262.
[4] Grzegorz Królczyk, Stanisław Legutko, Pero Raos . (2013).
Cutting wedge wear examination during turning of duplex stainless steel. Tehnički vjesnik . 20(3), pp. 413–418.
[5] Basim A. Khidhir, Bashir Mohamed. (2013). Selecting of Cutting
Parameters from Prediction Model of Cutting Force for Turning Nickel Based Hastelloy C-276 Using Response Surface
Methodology. European Journal of Scientific Research . 33(3), pp.
525–535.
[6] V.Suresh babu et al. (2011). Investigation and validation of
optimal cutting parameters for least surface roughness in EN24
with response surface method. International journal of
engineering, science and technology. 3(6), pp. 140–160.
[7] S.R.Chauhan, Kali Dass (2011). Optimization of Machining
Parameters in Turning of Titanium (Grade-5) Alloy Using
Response Surface Methodology. Materials and manufacturing
processes 27(5), pp. 531–537.
[8] Ishan Korkut et al. (2004). Determination of optimum cutting
parameters during machining of AISI 304 austenitic stainless
steel. Materials and Design, 25, pp. 303–305.
[9] B. C. Routara, A. Bandyopadhyay, P. Sahoo, “Use of desirability function approach for optimization of multiple performance characteristics of the surface roughness parameters in CNC turning,” in ICME2007, Dhaka, Bangaladesh, 2007, pp. 1-7
[10] Ahmet Hascalik, Ulas caydas. (2007). Optimization of turning
parameters for surface roughness and tool life based on the
Taguchi method. Int J Adv Manuf Technol, 38, pp. 896–903.
[11] Yigit Kazancoglu et al. (2007). Multi-objective optimization of the
cutting forces in turning operations using the grey-based Taguchi
method. MTAEC9, 45(2), pp. 105–110.
TABLE XI CONFIRMATION TESTS
Machining parameter & Tool geometry Surface roughness (Ra - µm)
Cutting speed (A)
Feed rate (B)
Depth of cut (C)
Nose radius
(D)
Actual Predicted Residual Error %
77 0.205 0.8 0.8 2.38 2.367 0.013 0.55
77 0.128 1.2 0.8 1.72 1.79 -0.07 -4.07
[12] A.K Sahoo, B. Sahoo. (2011). Surface roughness model and parametric optimization in finish turning using coated carbide insert: Response surface methodology and Taguchi
approach. International Journal of Industrial Engineering
Computations, 2, 819-830.
[13] Douglas C. Montgomery, “Response surface methods and other
approaches to Process optimization” in Design and analysis of
Experiments, 5th ed. India: Wiley-India, 2010, pp.427-448.
[14] John A. Cornell, “Design for Fitting Second-Degree Models” in
How to apply response surface methodology, 2nd ed., vol. 8, USA:
ASQC, 1990, pp.51-60.
[15] S.S.K. Deepak (2012). Application of different optimization
methods for metal cutting operation – A review. Research Journal
of Engineering Sciences 1(3), pp. 52–58.
[16] L.B. Abhang, M.Hameedullah (2011). Determination of optimum
parameters for multi-performance characteristics in turning by
using grey relational analysis. Int J Adv Manuf Technol, 63(1-4),
pp. 13–24.
AUTHOR’S INFORMATION
M. Thiyagu, Research scholar (Ph.D), Department of Mechanical Engineering, Anna University, Chennai, India.
He received his Bachelor of Engineering (Production Engineering) from Bharathidasan University, Trichy, India in 2002 and Master of Technology (Industrial Engineering) from National Institute of Technology, Trichy, India in 2005. He is pursuing his Doctor of Philosophy in the Department of Mechanical Engineering, Anna University, Chennai, India. His research area includes Metal cutting, Process optimization. He has published two papers in International conferences and two papers in International journals. Currently working as Assistant Professor in Department of Mechanical Engineering, Agni college of Technology, Chennai, India.
L. Karunamoorthy, Professor and Head, Department of Mechanical Engineering, Anna University, Chennai, India. He received his Doctor of Philosophy from MIT, Anna University, Chennai, India in 1997. His research area includes Metal cutting, Automation, Composite materials, and Nano materials. He has published more than 60 papers in International and National journals and more than 30 papers in International and National conferences. He is a active review members in many international journals.