Atos Spain, Atos Research & Innovation, Albarrac´ın 25, 28037 Madrid, Spain
Correspondence to: M. Hammitzsch ([email protected])
Received: 15 April 2011 – Revised: 22 December 2011 – Accepted: 29 December 2011 – Published: 6 March 2012
Abstract. The command and control unit’s graphical user interface (GUI) is a central part of early warning systems (EWS) for man-made and natural hazards. The GUI com-bines and concentrates the relevant information of the system and offers it to human operators. It has to support operators successfully performing their tasks in complex workflows. Most notably in critical situations when operators make im-portant decisions in a limited amount of time, the command and control unit’s GUI has to work reliably and stably, pro-viding the relevant information and functionality with the re-quired quality and in time.
The design of the GUI application is essential in the de-velopment of any EWS to manage hazards effectively. The design and development of such GUI is performed repeat-edly for each EWS by various software architects and de-velopers. Implementations differ based on their application in different domains. But similarities designing and equal approaches implementing GUIs of EWS are not quite har-monized enough with related activities and do not exploit possible synergy effects. Thus, the GUI’s implementation of an EWS for tsunamis is successively introduced, providing a generic approach to be applied in each EWS for man-made and natural hazards.
1 Introduction
The tsunami disaster affecting the Indian Ocean region on Christmas 2004 demonstrated very clearly the shortcomings in tsunami detection, public warning processes as well as intergovernmental warning message exchange in the Indian Ocean region (Esbr´ı et al., 2010). W¨achter et al. (2011) out-line that this event in 2004 triggered various international ef-forts focused on tsunami early warning for the Indian Ocean
personalized messages in sufficient time to initiate and have time for evacuation procedures. Customized messages can be sent by more than ten dissemination channels: Short Message Service (SMS) to subscribers, SMS via cell broad-casting (under investigation and dependent on arrangements with local operators), e-mail, fax, narrowcast and broad-cast television, Really Simple Syndication (RSS) feed, social media (Facebook, Twitter, etc.), instant messaging, Voice over Internet Protocol (VoIP), frequency modulation (FM) radio, Radio Data System (RDS) and sirens (Esbr´ı et al., 2010, 2012). The system prototype developed in DEWS is the result of the committed collaboration of 20 partners in the European Union (EU), Indonesia, Sri Lanka, Thailand, Japan and New Zealand, combining qualified technologi-cal competence and application experience. Interoperability with international cooperation mechanisms was also taken into account, including decisions of the Intergovernmental Oceanographic Commission of the United Nations Educa-tional, Scientific and Cultural Organization (UNESCO-IOC), to ensure relevance and transferability of results to other tsunami-prone areas. The main scientific and technical out-comes are the prototype for a National Centre (NC), intended for use at the national level; and the prototype for the so-called Wide Area Centre (WAC), intended for use at interna-tional level, in order to allow exchange of information among NCs and to act as an umbrella centre for the whole region. W¨achter et al. (2011) report that these developments are con-tinued by the project Collaborative, Complex and Critical Decision-Support in Evolving Crises (TRIDEC, TRIDEC, 2011) funded under the European Union’s FP7. TRIDEC focuses on real-time intelligent information management in Earth management. The addressed challenges include the de-sign and implementation of a robust and scalable service in-frastructure supporting the integration and utilisation of ex-isting resources, with accelerated generation of large vol-umes of data; these include sensor systems, geo-information repositories, simulations and data fusion tools. Additionally, TRIDEC adopts enhancements of SOA principles in terms of event-driven architecture (EDA) design. This will enable the communication and synchronisation of activities between warning centres on local, national and wide-area / regional levels.
2 Methodology
The command and control unit’s graphical user inter-face (GUI) implementation of an EWS for tsunamis is suc-cessively introduced, providing an approach to be applied in other EWS for man-made and natural hazards. Thus, the un-derlying EWS software system architecture and a possible operator’s workflow are presented based on existing precon-ditions and defined scenarios for validation. Then the gen-eral approach of a GUI for various aspects in the domain of EWS is contemplated in detail exemplarily for the GUI
named Command and Control User Interface (CCUI) devel-oped in the projects DEWS and TRIDEC. Finally, the sig-nificance of the application and assessment of the system are considered.
3 Preconditions
The development of EWSs that are people-centred, in par-ticular systems whose warnings are timely and understand-able to those at risk, is encouraged by the Hyogo Framework for Action 2005–2015 (UNISDR, 2006b). To be effective, EWSs must be people-centred and must integrate four inter-related elements: (i) knowledge of the risks faced; (ii) tech-nical monitoring and warning service; (iii) dissemination of meaningful warnings to those at risk; and (iv) public aware-ness and preparedaware-ness to act. Failure in any one of these elements can mean failure of the whole EWS (UN, 2006). Within these four inter-related elements, UN (2006) identi-fies the monitoring and warning services lying at the core of the system. They must have a sound scientific basis for pre-dicting and forecasting and must reliably operate twenty-four hours a day. Continuous monitoring of hazard parameters and precursors is necessary to generate accurate warnings in a timely fashion.
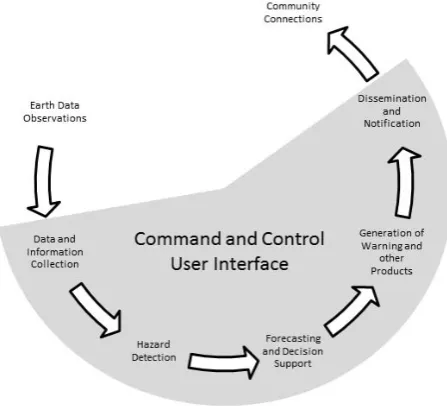
Fig. 1. Key Operational Components of an EWS for tsunami (USIOTWS, 2007) with CCUI.
population, including seasonal populations and remote loca-tions; communication system should be two-way and inter-active to allow for verification that warnings have been re-ceived, and should be complemented by equipment mainte-nance and upgrade programs implemented and redundancies enforced so that back-up systems are in place in the event of a failure. UNISDR (2006b) concludes that there are clear references to the importance of early warning, and to be ef-fective, EWSs need to effectively disseminate messages and warnings.
For monitoring systems developed, UNISDR (2006b) moreover requests that networks available and agreed with experts and relevant authorities are monitored with data re-ceived, processed and available in meaningful formats in real time or near-real time, and that data routinely is archived and accessible for verification and research purposes. For fore-casting and warning systems established, UNISDR (2006b) includes data analysis, prediction and warning generation with data and warning products issued within international standards and protocols. UNISDR (2006b) emphasizes that warning centres should be equipped with appropri-ate equipment needed to handle data and run prediction models and that measures should be implemented to rou-tinely monitor and evaluate operational processes, includ-ing data quality and warninclud-ing performance. Complementary, USIOTWS (2007) provides an overview of the key opera-tional and organizaopera-tional requirements of an EWS centre for tsunami as they currently exist at the two National Oceanic and Administration (NOAA) tsunami warning centres and at the Japan Meteorological Agency (JMA), including various links in the end-to-end chain, meaning from initial to final steps required for a successful system. These steps include
full-service EWS centre is to provide accurate and timely tsunami warnings and bulletins to populations in its area of responsibility (AOR) 24 h per day, 7 days per week (24/7). To accomplish this mission, a EWS centre detects and analy-ses events throughout its AOR. Events that are above a previ-ously established threshold activate the centre’s alarm system and initiate an investigation that includes the following four basic steps: locate and characterize the event and its prob-ability of creating a hazard; review automated analysis, and if necessary, modify the automated results; obtain continuous data from sites and sensors, to verify the existence of a hazard and to calibrate models; prepare and disseminate information to appropriate emergency management officials and others.
Furthermore UNESCO (2011a) specifies detailed require-ments of the design and implementation for the Indian Ocean Tsunami Warning System (IOTWS). The overall objective of the IOTWS is to efficiently identify and mitigate the hazards posed by local and distant tsunamis. To achieve this objec-tive, an end-to-end tsunami warning system (TWS) is needed that includes hazard detection and forecast, threat evaluation and alert formulation, alert dissemination of public safety messages, and preparedness and response (see Fig. 2).
4 Use case and scenarios
The system prototype has been designed and implemented to support plausible scenarios for a National Tsunami Warning Centre (NTWC) and to demonstrate the treatment of simu-lated tsunami threats with an essential subset of a NTWC, covering operational as well as tsunami detection and alert-ing functions and demonstratalert-ing the feasibility and the po-tentials of the approach for the involved partner countries.
In terms of demonstrating the escalation of a hazard case comprised from operational to tsunami mode, the treatment of the tsunami is therefore divided into five phases. Phase 1 outlines the operational mode. Phases 2 to 5 describe the tsunami mode from earthquake detection to warning dissem-ination:
– Phase 1 – Tsunami Monitoring: normal observations are performed and incoming information from the con-nected sensors and sensor systems are monitored. – Phase 2 – Earthquake Detection: from the connected
seismic sensor system, an initial alert with measure-ments and further refinemeasure-ments are received that indicate an earthquake at an ocean bottom trench in the moni-tored region has been detected. If the earthquake mea-surements received exceed certain magnitude thresh-olds, an initial warning message is created and sent to registered target groups.
– Phase 3 – Tsunami Assessment and Verification: based on the sensor measurements from the seismic sys-tem and additional sea level measuring stations, such as buoys and tide gauges, the simulation system is requested to provide a set of feasible pre-computed tsunami simulations. The monitoring continues by receiving further measurements of sensors which are compared to the set of simulations and clearly indicate that a tsunami has been triggered. Further tsunami sim-ulation sets are inquired to match the new measurements received.
– Phase 4 – Compilation of Tsunami Messages: based on accurate sensor measurements received and based on the requested tsunami simulations, the situation picture is improved and affected areas are calculated providing data concerning the estimated severity. If a high proba-bility for a tsunami event is detected and affirmed by ac-curate sea level measurements received, a warning mes-sage is composed and sent including information about estimated times of arrival and severity for different iden-tified threatened areas.
– Phase 5 – Post Tsunami Communication: finally sta-tus bulletins are compiled and sent informing about the phased down tsunami threat, including detailed infor-mation such as measured wave heights at the coast and improved damage estimations.
The country reports of the DEWS partners in the Indian Ocean have shown that Indonesia, Thailand and Sri Lanka have reached different steps of evolution in the field of EWS, especially in deploying sensor systems for tsunami detection. Since Indonesia has had the largest set of installed sensors and one of the most developed organisational governmental structure to operate national EWSs, this country has been se-lected for demonstration and evaluation purposes, at first.
Furthermore, Indonesia is located along the most promi-nent active contipromi-nental margin in the Indian Ocean, the so-called Sunda Arc, and therefore is one of the most threat-ened regions of the world in terms of natural hazards such as earthquakes and tsunamis. Thus, Indonesia is characterized by its unique geotectonic position and the resulting conse-quences in terms of natural hazards. Accordingly, the spe-cific geodynamic situation of Indonesia requires a tsunami early warning system (TEWS) which, on the one hand, takes into account the extremely short early warning times re-quired, and on the other hand, takes on the challenge of pro-ducing reliable tsunami warnings immediately after an earth-quake based on data with high uncertainties (Lauterjung et al., 2010).
Facing the Sunda Arc, not only Indonesia is potentially af-fected by possible tsunamis but also other countries such as Thailand. But contrary to Indonesia, Thailand is not depen-dent on extremely short early warning times immediately af-ter an earthquake since Thailand is located further away from the Sunda Arc, resulting in longer tsunami travel times until reaching Thailand’s coast. Thus, Thailand has the opportu-nity to use more time to refine successively latest sensor data affirming or disconfirming the occurrence of a tsunami and, if required, to evaluate the estimated destructiveness more pre-cisely. So a second set of simulated tsunami scenarios have been selected for demonstration purpose covering the Thai coastline.
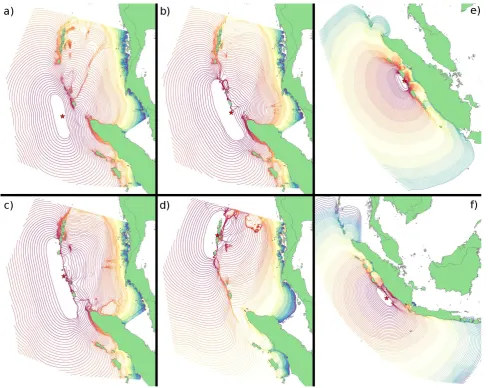
Fig. 3. Virtual scenarios selected in 2009 for testing, demonstration and validation of Thai system (a–d) and Indonesian system (e–f)
with tsunami wave propagation generated by earthquake events: (a) 92.81◦E, 5.94◦N,Mw=8.0 andMw=8.5; (b) 93.87◦E, 6.26◦N,
Mw=8.0 andMw=8.5 andMw=8.8; (c) 92.93◦E, 8.65◦N,Mw=8.0 andMw=8.5 andMw=9.0; (d) 92.67◦E, 12.21◦N,Mw=8.0
andMw=8.5; (e) 97.82◦E, 0.19◦N,Mw=8.0; (f) 101.28◦E, 4.55◦S,Mw=8.25.
5 Generic early warning system architecture
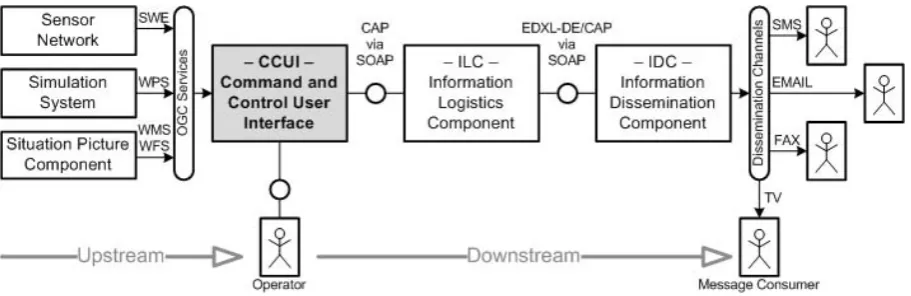
One of the key challenges of the DEWS project is to build a new generation of open standard based EWSs that real-ize reliable hazard detection and effective warning dissem-ination. The project follows a multi-hazard approach, so that the application can be potentially used for all types of hazards. Moreover, it must be transferable to different ge-ographic areas. So to realize these aims, a modular archi-tecture with standardized interfaces has been designed and implemented: first, for the upstream to allow the integration of sensor systems based on open standards; and second, for the downstream comprising information logistics and warn-ing dissemination also based on open standards. A simplified architectural blueprint (Fig. 4) provides an overview of the system architecture depicting major components.
Starting on the left in Fig. 4 you find: the Sensor Network with the seismic system, buoys, tide gauges and various other sensors; the Situation Picture Component (SPC) responsible for maps, geo-data and geo-processing services; and the Sim-ulation System providing pre-factored forecasts of tsunami wave propagation. Hammitzsch and Lendholt (2011) de-scribe that these three components – altogether compiling the upstream information flow – are connected to the CCUI with OGC standards. The CCUI harvests and exposes all neces-sary upstream information, enabling the operator on duty to analyse and understand the current situation picture, to man-age a tsunami threat, and to make decisions for releasing rea-sonable warning messages.
Fig. 4. DEWS architecture simplified (Lendholt and Hammitzsch, 2011a) with CCUI.
point out that the downstream comprising the message gener-ation workflow is divided into three phases and components. Firstly, the CCUI releases an initial warning message with-out any specific message for recipients and independent from specific user settings. Secondly, based on the initial warning message, the Information Logistics Component (ILC) gen-erates one customized message for each user and the respec-tive dissemination channel. Thirdly, the Information Dissem-ination Component (IDC) converts the customized messages into channel specific formats and finally disseminates them to the message recipients.
UDIGAPP (2009) summarizes that existing standards as well as free and open source software have been integrated wherever possible. The CCUI, a rich client application based on the Eclipse Rich Client Platform (RCP) and the User-friendly Desktop Internet GIS (uDig), integrates vari-ous OGC services. Using OGC Web Map Service (WMS) and Web Feature Service (WFS), spatial data are utilized to depict the situation picture and to integrate a simulation sys-tem via OGC Web Processing Service (WPS) to identify af-fected areas. Warning messages are compiled and transmit-ted in the OASIS Common Alerting Protocol (CAP) stan-dard together with addressing information defined via OA-SIS Emergency Data Exchange Language – Distribution El-ement (EDXL-DE). Internal interfaces are realized with Sim-ple Object Access Protocol (SOAP) web services.
In TRIDEC, H¨aner et al. (2011) reconsider that the key challenge is establishing communication infrastructures of interoperable services through which management of dy-namically increasing volumes and dimensionality of dis-parate information is efficiently possible. To this end, a future architecture will be based on SOA 2.0, an event-driven extension of SOA principles. This approach supports creating high-level business events from low-level system events. Events are created by analysing real-time data from services, business processes including service chaining, or system components and enhanced with details such as de-pendencies or causal relationships discovered by correlating
other events and additional information. This process is fa-cilitated by applying data-fusion and pattern-matching tech-niques as well as know-how derived from various knowledge bases, each covering domain-specific information. This ap-proach supports and improves decision processes in evolv-ing crises. Even more important, this allows collaboratevolv-ing systems to respond dynamically in real-time, automate deci-sion processes, or to autonomously take actions like service-orchestration and -choreography to react on unique event pat-terns. The architecture also enables evolvement and evolu-tion of systems by facilitating long-running processing capa-bilities, e.g. data-mining of information from various asyn-chronous events, time series, information networks, numeri-cal models, messages, or human feedback as well as the de-duction of patterns, trends, and rules over a long period of monitoring.
6 Command and control workflow
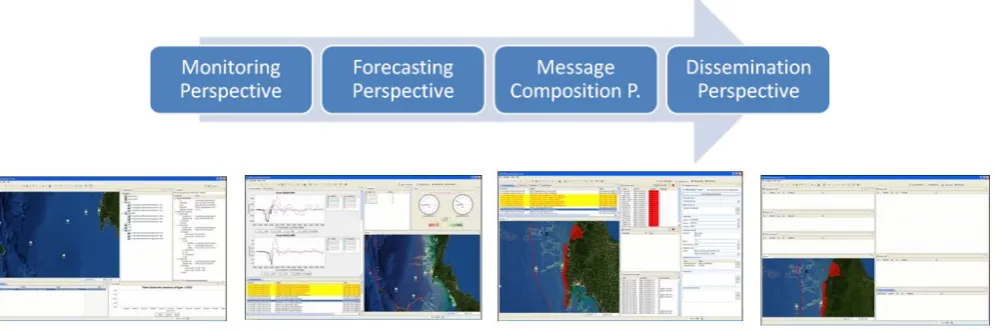
Fig. 5. Perspectives guide operators in comprehensive workflow.
of the user interface allows operators finding the best layout according to their needs without fearing to lose the initially intended layout.
Based on this approach, the CCUI perspectives have to be identified and designed successively with their particular as-sembly, content and functionality as well as their interplay. Furthermore, the CCUI must be flexible enough to be used in different workplace scenarios. The situation in different warning centres is based on national sensitivities and prop-erties in the deployment area. Therefore it cannot be esti-mated how many operators will work on how many screens. For example, one operator processes all tasks or many oper-ators work together, each of them managing only a subset of the overall process. In each case the perspectives and views should dovetail each other and support the operators’ work-flow without interference in a consistent manner.
Following main perspectives might support operators do-ing their tasks in EWSs for man-made and natural hazards. The Monitoring Perspective provides the survey of a specific area and contributes an overall situation picture to the opera-tor with geo-spatial information to track running events. The Forecasting Perspective supports the operator in analysing different probable forecasts provided and selected by the simulation system based on available sensor measurements. The Message Composition Perspective facilitates the oper-ator to prepare and send warning messages or system mes-sages. The Dissemination Perspective provides a compre-hensive overview of the status of disseminated messages sent through the different dissemination channels and allows ob-serving all disseminations initiated for specific user groups. The Situation Picture Perspective provides a set of preconfig-ured and selected thematic map layers and allows incorporat-ing dynamically additional information in the map to anal-yse specifics of a given situation. The Maintenance Perspec-tive enables the operator to maintain sensors and sensor net-works by means of requesting sensor observations, planning
services as well as rebinding and disconnecting them. The Administration Perspective allows the administration of con-figurations and settings needed for the information logistics. As depicted in Fig. 4, the CCUI is a central component, al-lowing the operator to access and interact with the different resources and functionalities provided by the system. The System Monitoring Perspective allows monitoring of the sys-tem itself to ensure its proper operation.
Summarized four perspectives (Fig. 5) of the CCUI sup-port the operators in their duty to manage an imminent threat such as a tsunami: the Monitoring Perspective, the Forecast-ing Perspective, the Message Composition Perspective and the Dissemination Perspective. Additionally, various wiz-ards accelerate the operator’s work with automatic opera-tions within these perspectives. Finally, the Situation Pic-ture Perspective, the Maintenance Perspective, the Admin-istration Perspective and the System Monitoring Perspective help the operators to carry out surrounding tasks done in ad-vance, while or after an imminent hazard threat.
7 Monitoring Perspective
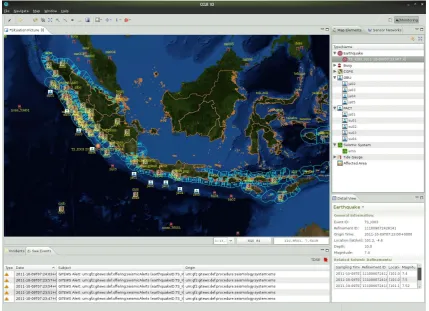
Fig. 6. Monitoring Perspective.
in analysing the respective situation and allows the operator making decisions based on all-embracing information. For that purpose events are classified by relevance relating to the situation and thresholds configured in advance and specific to the monitored region.
The reported events are the central elements in the Moni-toring Perspective. So the events received must be visualized as incoming elements to the operator and they must be ac-cessed with their respective information by the operator in a convenient and clear way.. Thus, the incoming events have a message-like character and could be managed according to a known pattern, analogously to an e-mail client inbox. So the vital view of the Monitoring Perspective is the Incom-ing Events View constitutIncom-ing the inbox of received events but also serving as a kind of history of past events. The events are organized by their time of occurrence so that the latest events are automatically displayed on top. Moreover, the listed events are provided with additional metadata, e.g. in-dicating that critical thresholds have been exceeded and that the possible effects are estimated to be of minor or major im-pact. Additional filter mechanisms restrict the list of events according to qualified criteria, emphasize related events and grey out events that are replaced by other events updating previous events. Also, the Incoming Events View enables the operator to track incidents opened and administered by
Fig. 7. Forecasting Perspective.
and affected areas in cases of a NTWC. The Map View is also used to display information with geographic context regard-ing to selected events in the Incomregard-ing Events View. Events, for example those originated by buoys or tide gauges, pro-duce a graphical accentuation depicting the position, sensor type and event type; whereas events originated by seismic sensors produce a graphical icon depicting the position of the earthquake centre. Complementary, the Map Elements View lists elements contained in the map. Typical elements that appear in this list are sensors, geo-referenced events such as earthquakes, and affected areas generated during message composition. According to the selected event, further details are displayed in the Detail View in order to give a precise understanding of the respective event data. The appearance of this view strongly depends on the event type selected. For example, the information displayed could be description and measurements of one of the available sensors selected in the Map Elements View but also sensed earthquake information of a seismic alert selected within the Incoming Events View. Plus, additional metadata such as calculated information on the aftershock probability and status information can be inte-grated in the Detail View.
Finally, measured data are displayed in form of time se-ries for the different sensors in the Time Sese-ries View. Graphs allow the operator to track successively the incoming data
graphically depicted in this view. Thus the operator is en-abled to investigate conveniently measurements of selected events or selected sensors.
8 Forecasting Perspective
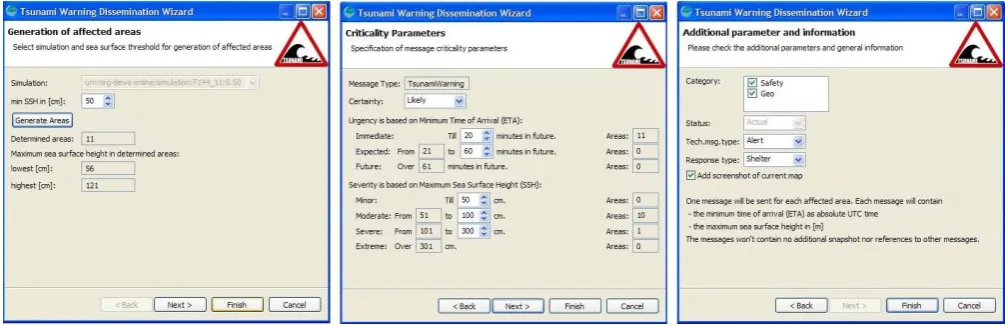
Fig. 8. Tsunami Warning Dissemination Wizard.
for the respective sensor includes differently coloured graphs for each predicted measurement calculated by the simula-tion system and a graph in black representing the real time measurement of the respective sensor updated automatically when new measurements are available via incoming events. In this vein the operator is enabled to compare and approve the forecasts given by the simulation system with the real measurement. The predicted time series for each sensor are also listed in the two small boxes to the right of a chart. The box called Simulation Visibility is used to select all or only single time lines which should be displayed in the chart. The box called Simulation Weighting is important for the ranking of the probable predictions. While examining each timeline the selections performed in the Simulation Weighting box are summarized in the Ranking View. In the Ranking View the forecasts are simply ordered by the count of their selec-tion done within the Simulaselec-tion Weighting of each sensor graph. By this selection process the simulation with the high-est probability leads to an optimal forecast result and can be used for the dissemination of warning messages. Each listed forecast might contain additionally details of the key infor-mation, e.g. the earliest estimated time of arrival (ETA) and the maximum of estimated wave heights (EWH) in cases of a NTWC. In this vein the most reasonable simulation forecast can be used for the computation of affected areas and finally for warning message dissemination.
The forecast selected in the ranking list is displayed in the Map View with coloured isochrones. The outlined isochrones represent the tsunami wave propagation in time between the earthquake occurrence and the impact at the coast. The distance between two isochrones accounts for a defined time range appropriate for the monitored region. Also, the isochrones are updated frequently to display the current position of the tsunami wave front as calculated by the selected forecast with an isochrone marked in red.
Finally the Time Measurements View integrates relevant time measurements and information. When selecting a fore-cast in the ranking list, updated information is displayed not
only in the map but also in the time measurements. The time measurements provide the UTC time of the occurrence of the initial event of an incident, the present UTC time and the rel-ative time difference between the event time and the present time as delta value.
The Forecasting Perspective also integrates and reuses the Incoming Events View introduced in the Monitoring Per-spective. Since the selected events serve the input for the simulation calculation, the operator is enabled to trigger another simulation calculation based on the latest received events directly in the Forecasting Perspective.
9 Tsunami Warning and Dissemination Wizard
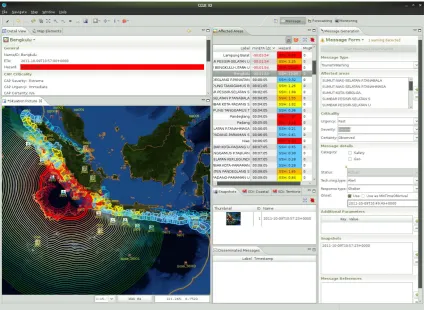
Fig. 9. Message Composition Perspective.
10 Message Composition Perspective
The Message Composition Perspective depicted in Fig. 9 supports the operator to prepare, to send and to observe the initiated warning dissemination. This perspective is either opened by the operator to disseminate messages manually or it is opened automatically in the background when starting the Tsunami Warning Dissemination Wizard with a selected forecast.
The Map View still depicts the specific geographic region with the information provided by the other perspectives. The calculated affected areas are displayed additionally in the map according to the selected forecast. On the one hand, the automatically calculated affected areas are mapped to ad-ministrative areas and on the other hand free hand shapes manually selected by the operator with tools available in the tool bar can be added as well. Automatically calculated ar-eas are coloured by the predicted threat level in accordance with the colour scheme recommended by the US Department of Homeland Security (Lendholt and Hammitzsch, 2011b). Red coloured areas are at high risk; less endangered areas are depicted in orange, yellow or blue. Selected areas are also listed with additional information in the Affected Ar-eas View so that the operator is able to manage the affected areas and reuse them later on, e.g. when composing refined
warning messages the listed areas serve as input for the mes-sage composition of the intended warning dissemination and are attached to a warning message.
Furthermore, the operator is enabled to take snapshots of the currently displayed map, which are stored in the Snap-shots View and attached later on to a warning message pro-viding an evident situation picture.
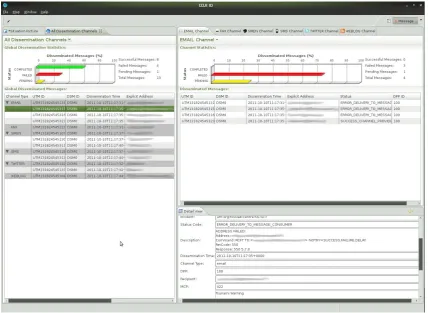
Fig. 10. Dissemination Perspective.
warning message. Each message can be reused as a template for a refined message later on and pre-sets the form values of the Message Composition View.
The Ranking View introduced in the Forecasting Perspec-tive is also available to allow changing the selection of fore-casts. In this vein the operator is able to switch between the different estimated wave propagations of the different fore-casts and their respectively calculated affected areas to anal-yse the most feasible forecast for dissemination.
Again the Incoming Events View is included as well to allow tracking of current events and to provide updates with latest information of the monitored region.
11 Dissemination Perspective
The Dissemination Perspective depicted in Fig. 10 provides a comprehensive overview of the status of disseminated mes-sages sent through the different dissemination channels with a Channel Status View for each of the channels. These views display detailed status reports received and aggregated from the respective telecommunication providers. The Dissem-ination Perspective is designed to be expandable dynami-cally with additional views to allow the addition of further dissemination channels not initially considered. Thus each view represents one channel and displays status information
according to the on-going dissemination of warning mes-sages. Additionally, one view aggregates information of all channels related message exchange between the dissemina-tion infrastructure and the respective disseminadissemina-tion channel provider and displays a short summary of the status informa-tion.
Since the dynamic nature of this perspective is dependent on the available channels and each channel might be fun-damentally different in various aspects, each channel view is configured simultaneously with the registration of the re-spective channel. Consequently, a set of common and un-derstandable status report information is used for all channel types equally and represented in the views. Then the spe-cific aspects of each channel such as the different number of providers, the different number of message recipients reach-able by each channel or different status notification mecha-nisms, codes and scope for each channel are mapped to the simplified set of the views.
12 Other perspectives
The Maintenance Perspective provides a user interface for maintaining all sensors and sensor networks by means of questing sensor observations, planning services as well as re-binding and disconnecting them, and thus the perspective is highly dependent on the connected sensor network.
Finally, the System Monitoring Perspective integrates spe-cific views enabling operators to observe and configure inter-nals of the CCUI and other parts of the system. For exam-ple, different status information such as errors or warnings provided by different plug-ins of the CCUI monitor the be-haviour of the CCUI. Also system errors can be detected and logged to allow technicians to investigate and fix detected problems. Analogously, all actions that have been taken by an operator during managing an incident can be recorded. This could be valuable information in order to investigate and replay the performed actions as well as to use for training purposes later on.
13 Perspectives communication and operators intercommunication
Based on the approach of composing the CCUI into perspec-tives, their interplay has to be guaranteed in the CCUI, being flexible enough to be used in different workplace scenarios. The situation in different warning centres is based on national sensitivities and properties in the deployment area. Therefore it cannot be estimated how many operators will work on how many screens. For example, one operator might take care of all tasks or many operators work together, each of them managing only a subset of the overall process. In each case the perspectives and views should dovetail each other and support the operators workflow in a consistent manner and without interruption.
To pursue the idea of many operators working together and each of them managing a subset of the overall process in a dedicated perspective, it follows that each operator uses one workstation with the respective CCUI perspective opened. Thus the perspectives have to communicate output generated by one operator, as input to other operators’ persectives. A
SPC via WPS to calculate the affected areas based on the selected forecast. If appropriate, additional expert informa-tion could be attached by the operator to guide the opera-tor at the Message Composition Perspective. The operaopera-tor at the Message Composition Perspective then receives this new input besides the calculated affected areas for dissemina-tion and tasks the service framework to disseminate warning messages using again standards such as CAP, EDXL-DE and SOAP. Finally, the different dissemination providers deliver the warning messages and return the result of dissemination to the Dissemination Perspective, enabling its operator to re-act on dissemination failures. The outlined communication of perspectives relies on a service framework and the per-spectives bind to this service framework via plug-ins. The communication and responsibilities of perspectives could be defined and realized dependent on the current needs of the respective EWS by including the required plug-ins in the ap-propriate perspectives to contain the desired communication facilities and functionality. Thus, the CCUI is highly cus-tomizable and flexible to serve the varying requirements of different EWS. Additionally, this service framework should address further functionality of the perspectives intercommu-nication such as a history store keeping log of actions carried out and decisions made by operators to allow further exami-nation of emerged tsunami threats.
14 Caveats
CCUI is based on a concept that allows plugging in other, modified or additional functionality, the CCUI has been de-signed to work primarily with the described use case and sce-narios.
That is, for example, that any tsunami forecasting software is going to be very dependent on the methodology to generate the actual prediction. This process may require a significant amount of input from the operator. So, to assist the operator in elaborating an accurate forecast other components might be required and accessed by perspectives and views not pre-sented in this paper. For instance, in the case of incorporat-ing source inversion tools to construct a tsunami source in-stead of selecting one from a pre-computed data base would require modifications to the CCUI. Apart from, that adap-tions are dependent on the adopter’s requirements, the devel-opment of the CCUI is not completed, still advancing and incorporating results achieved in on-going activities in col-laboration with scientists, end users and stakeholders. Thus the CCUI is going to integrate requested functionally suc-cessively enabling the application of the CCUI with fewer modifications in future for areas other than those presented here.
Summarized the introduced CCUI is a proposal and a start-ing point every adopter might extend with its respective do-main specific knowledge to achieve a comprehensive CCUI with a first basic set of adequate components.
15 Validation
In several project-internal demonstrations performing the complete EWS prototype including the presented CCUI, the designed concepts and implementation have been reviewed by DEWS project partners, including the:
– Meteorology, Climatology and Geophysics Agency (BMKG), Indonesia, operating the 24/7 NTWC for Indonesia and developing Regional Tsunami Watch Provider (RTWP) capability for the Indian Ocean region (UNESCO, 2011a)
– National Disaster Warning Center (NDWC), Ministry of Information and Communication Technology, Thai-land, operating the 24/7 NTWC for Thailand and de-veloping RTWP capability for the Indian Ocean region (UNESCO, 2011a)
– Thai Meteorological Department (TMD), Seismologi-cal Bureau, Thailand, developing RTWP capability for the Indian Ocean region (UNESCO, 2011a)
– Department of Disaster Prevention and Mitigation (DDPM), Ministry of Interior, Royal Thai Government, Thailand
– Disaster Management Centre (DMC), Ministry of Dis-aster Management and Human Rights, Sri Lanka
In 2009 the CCUI has received preliminary evaluation by the involved stakeholders and domain experts from Indone-sia, Thailand, and Sri Lanka at a workshop and at an end user panel. Through open-ended survey questions the re-quirements of the system have been controlled and succes-sively refined. The validation will be continued successucces-sively at trial basis in a test bed without any functionality to the out-side world for evaluation and testing purposes based on the successful deployments of the CCUI in conjunction with the overall system in 2011 at the premises of:
– BMKG (mentioned above), and
– Kandilli Observatory and Earthquake Research In-stitute (KOERI), Turkey, representing Tsunami Na-tional Contact (TNC) and Tsunami Warning Focal Point (TWFP) for Turkey (UNESCO, 2011b), estab-lishing operation as NTWC for Turkey and establish-ing prospective Tsunami Watch Provider (TWP), for-merly Regional Tsunami Warning Centre (RTWC) or Regional Tsunami Service Provider (RTSP), responsi-bilities for a NEAM sub-region (Eastern Mediterranean, Aegean and Black Seas) ( ¨Ozel, 2010, Hammitzsch et al., 2012).
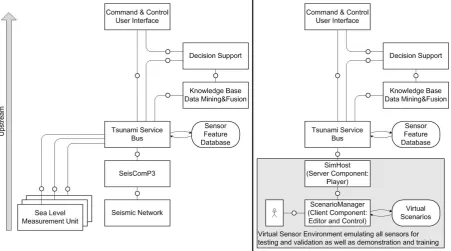
For validation, the strategy described by Babeyko et al. (2010) has been applied using hypothetical future events for testing and training of core software system compo-nents. The system is being detached from real physical sen-sors and is being connected to a virtual sensor environment (see Fig. 11) fed by pre-computed so-called virtual scenario datasets of different sensor types. The fully synthetic vir-tual scenarios contain modelled sensor signals stored in nat-ural sensor formats. Virtual scenarios can be any time played back on input to the software units. The latter does not actu-ally realize if incoming data come from real or from virtual world. Furthermore, synthetic scenarios are fully under con-trol of their developers. That makes them an ideal toolkit to simulate all possible situations which may realize in later operational work. Together with historical events, fully syn-thetic hyposyn-thetical scenarios provide a valuable basis for tun-ing and testtun-ing of the components as well as for teachtun-ing and training of the future warning centre personnel. Moreover, historical records, while being of highest priority, neverthe-less cannot provide all necessary data for the extensive sys-tem verification and validation. Data are sparse and irregular; some sensor types were not available. Due to the same rea-sons, historical events are not the best scenarios for teaching and training of the warning centre personnel. In this respect, synthetic scenarios, which provide all possible coherent sen-sor data to the same event, appear to be the best candidates for validation, testing and training. The virtual scenarios se-lected for validation are listed in Figs. 12, 13 and 3.
Fig. 11. System connected to real sensor environment (left), and connected to virtual sensor environment (right).
Ocean-wide Tsunami Warning and Communication Exercise in 2011 (IOWave11, UNESCO, 2011c) with the virtual sce-nario close to Aceh (Indonesia, see Fig. 12) and similar to the North Sumatra earthquake of 26 December 2004 which parameters provide the base for the scenario used in the IOWave11. The validation of the system performed against a real tsunami event is pending and has been made possible only by the deployment at KOERI as part of currently on-going activities within the frame of the TRIDEC project and by the deployment at BMKG as part of resumed and contin-ued DEWS activities. In the context of TRIDEC, the overall system including the CCUI is currently under further devel-opment and more extensive evaluation and revision of this system is expected to be completed in the future with multi-ple experts from research and responsible agencies offering their opinions on the system. Thus, also location-specifics, such as the validation of the system fed by sea levels which do contain noise and tidal components as the real system have, will be considered to confirm that the CCUI can be used in an unlikely event to analyse a real situation. There-fore, the location-specific CCUI has been installed on both locations having access to the respective sensor systems, i.e. sea level stations and the seismic system, serving raw data and/or post-processed data of real sensors, in addition to a CCUI installed together with a virtual sensor network for testing and training purposes. So the installed versions at KOERI and BMKG serve as a basis for a proof-of-concept, i.e. for validation purposes. It is important to know how the system reacts in real events with real data such as earth-quake events (a) not generating a tsunami but felt at the coast,
(b) generating a tsunami with high uncertainty while tsunami prediction, and (c) generating a tsunami with low uncertainty while tsunami prediction. The system should therefore be further evaluated to communicate feedback reporting experi-ences with the system and its behaviour in different events. The feedback will be used for improving the system until it works as expected by the involved stakeholders. Finally, decision-makers in local and regional authorities have ex-pressed interest in the system (ICT, 2010).
16 Conclusions and future application
Fig. 12. Virtual scenarios with tsunami wave propagation generated by earthquake events selected in 2011 for testing, demonstration and
validation of Indonesian system as well as used for training: Bengkulu, left) based on historic event in 2007, according to Lorito et al. (2008), 101.09◦E, 4.67◦S,Mw=8.5; Nias, middle) based on historic event in 2005, according to Babeyko et al. (2010), 97.29◦E, 1.88◦N,Mw=
8.7; Aceh, right) fictitious event similar to historic event in 2004, according to Hoechner et al. (2008), 94◦E, 5.8◦N,Mw=9.0.
Fig. 13. Virtual scenarios with tsunami wave propagation generated by earthquake events (and with virtual sensor environment) selected in
2011 for testing, demonstration and validation of Turkish system as well as used for training: East Crete 1, top-left) based on historic event in 1303, 27.1◦E, 34.5◦N,Mw=8.0; East Crete 2 top right) fictitious event, 29.0◦E, 35.0◦N,Mw=8.5; West Cyprus, bottom left) fictitious
Fig. 14. CCUI version (right screen) used for international communication with national CCUIs, e.g. with the CCUI version (left screen) for
Indonesia, both deployed at BMKG.
(Hammitzsch et al., 2010). Especially the arrangement of functionalities within the user interface by usage of Perspec-tives and Views allowing access to functionalities associated with larger self-contained tasks in a comprehensive workflow and the underneath stack of generic frameworks leverage the reuse and adoption of the CCUI for specific applications in the field of EWSs for natural and man-made hazards. The CCUI in conjunction with the overall system was installed in 2011 at KOERI as part of TRIDEC project activities, and at BMKG as part of continued DEWS activities, leveraging results achieved in TRIDEC for evaluation and testing pur-poses in a closed and secure test environment within the do-main of tsunami crisis management and solely used by its technical personnel. The deployed versions of the system correspond to software intended for future use in a national centre for tsunami early warning after extensive location-specific validation has been successfully completed, either with different real events occurring real time or recorded. Also a successful validation importantly includes interna-tional communication with other nainterna-tional centres (Lendholt et al., 2012), exemplarily depicted in Fig. 14, considering the intended evolution of today’s TWSs to regional or even global system-of-systems (W¨achter et al., 2012).
Supplementary material related to this article is available online at:
http://www.nat-hazards-earth-syst-sci.net/12/555/2012/ nhess-12-555-2012-supplement.zip.
Acknowledgements. The work presented in this paper is part of
the research and development in the DEWS project (contract no. 045453), partially funded by the 6th Framework Program of the European Commission. Many individuals and institutions from Eu-rope, Thailand, Indonesia and Sri Lanka have contributed towards the development of DEWS and its CCUI. The editors like to ex-press their sincere thanks to all of them for their support and coop-eration. Especially it should be noted that for the upstream direc-tion, DEWS integrates results of GITEWS, in particular, the inte-gration platform for heterogeneous sensor systems named Tsunami Service Bus (Fleischer et al., 2010), and pre-computed scenarios for tsunami hazard forecasting calculated by the simulation software setup utilized for the scenario generation (Behrens et al., 2010), as well as findings on tsunami source modelling which provides initial conditions for tsunami and findings on the modelling of the tsunami wave propagation for the computing of matching scenarios and virtual scenarios together with the strategy of using hypothet-ical future events for validation, testing and training (Babeyko et al., 2010). Further findings and developments are carried out within the TRIDEC project (contract no. 258723), supported by the 7th Framework Program of the European Commission. Suffice it to say that the achieved results are also based on the collective creativ-ity, idealism and optimism of a global community sharing results of performed work and findings with free and open source licenses. It is impossible to acknowledge all these individuals and institutions that have contributed thusly.
The authors are grateful to the anonymous reviewers and to the editor for their comments that have helped to improve the earlier version of the paper.
Edited by: S. Tinti
References
Babeyko, A. Y., Hoechner, A., and Sobolev, S. V.: Source model-ing and inversion with near real-time GPS: a GITEWS perspec-tive for Indonesia, Nat. Hazards Earth Syst. Sci., 10, 1617–1627, doi:10.5194/nhess-10-1617-2010, 2010.
Behrens, J., Androsov, A., Babeyko, A. Y., Harig, S., Klaschka, F., and Mentrup, L.: A new multi-sensor approach to simulation assisted tsunami early warning, Nat. Hazards Earth Syst. Sci., 10, 1085–1100, doi:10.5194/nhess-10-1085-2010, 2010.
DEWS (Distant Early Warning System): available at: http://www. dews-online.org (last access: 30 October 2010), 2008.
Esbr´ı, M. ´A., Esteban, J. F., Hammitzsch, M., Lendholt, M., Mu-tafungwa, E.: DEWS: Distant Early Warning System – Innova-tive system for the early warning of tsunamis and other hazards, in: Jornadas Ib´ericas de Infraestructuras de Datos Espaciales (JI-IDE), Lisbon, Portugal, 27–29 October 2010, 2010.
Esbri Palomares, M. A., Hammitzsch, M., and Lendholt, M.: A hazard-independent approach for the standardised multi-channel dissemination of warning messages, in: European Geosciences Union (EGU) General Assembly 2012, Vienna, Austria, 22–27 April 2012, Geophys. Res. Abstr., EGU2012-10014, EGU Gen-eral Assembly 2012, Vienna, Austria, 2012.
Fleischer, J., H¨aner, R., Herrnkind, S., Kloth, A., Kriegel, U., Schwarting, H., and W¨achter, J.: An integration plat-form for heterogeneous sensor systems in GITEWS – Tsunami Service Bus, Nat. Hazards Earth Syst. Sci., 10, 1239–1252, doi:10.5194/nhess-10-1239-2010, 2010.
H¨aner, R., W¨achter, J., Hammitzsch, M., Lentholt, M., Sabeur, Z., and Poslad, S.: Event-Driven Service Oriented Architecture Foundations for Industrial and Natural Crises Management Sce-narios, Geophys. Res. Abstr., Vol. 13, EGU2011-11974, EGU General Assembly 2011, Vienna, Austria, 2011.
Hammitzsch, M. and Lendholt, M.: Evolving an information logis-tics database for geospatial early warning systems, Geomalogis-tics, Nat. Hazards Risk, 2, 95–109, 2011.
Hammitzsch, M., Lendholt, M., and W¨achter, J.: Distant Early Warning System for Tsunamis – A wide-area and multi-hazard approach, in: European Geosciences Union (EGU) General As-sembly 2010, Vienna, Austria, 02–07 May 2010, Geophys. Res. Abstr., EGU2010-4496, EGU General Assembly 2010, Vienna, Austria, 2010.
Hammitzsch, M., Necmioglu, O., Reißland, S., Lendholt, M., Co-moglu, M., Ozel, N. M., and W¨achter, J.: TRIDEC Natural Cri-sis Management Demonstrator for Tsunamis, in: European Geo-sciences Union (EGU) General Assembly 2012, Vienna, Austria, 22–27 April 2012, Geophys. Res. Abstr., EGU2012-7275, EGU General Assembly 2012, Vienna, Austria, 2012.
Hoechner, A., Babeyko, A. Y., and Sobolev, S. V.: En-hanced GPS inversion technique applied to the 2004 Suma-tra earthquake and tsunami, Geophys. Res. Lett., 35, L08310, doi:10.1029/2007GL033133, 2008.
ICT Results: New tsunami early warning system stands guard, available at: http://cordis.europa.eu/ictresults/index.cfm?tpl= article\&ID=91371 (last access: 17 August 2010), 2010. Lauterjung, J., M¨unch, U., and Rudloff, A.: The challenge of
in-stalling a tsunami early warning system in the vicinity of the Sunda Arc, Indonesia, Nat. Hazards Earth Syst. Sci., 10, 641– 646, doi:10.5194/nhess-10-641-2010, 2010.
Lendholt, M. and Hammitzsch, M.: Generic Information Logistics
for Early Warning Systems, Proceedings of the 8th International ISCRAM Conference, Lisbon, Portugal, May 2011, 2011a. Lendholt, M. and Hammitzsch, M.: Addressing administrative units
in international tsunami early warning systems: shortcomings in international geocode standards, Int. J. Digital Earth, 2011, 1–16, doi:10.1080/17538947.2011.584574, 2011b.
Lendholt, M., Hammitzsch, M., and W¨achter, J.: The Common Alerting Protocol (CAP) and Emergency Data Exchange Lan-guage (EDXL) – Application in Early Warning Systems for Nat-ural Hazard, in: European Geosciences Union (EGU) General Assembly 2010, Vienna, Austria, 02–07 May 2010, Geophys. Res. Abstr., Vol. 12, EGU2010-8428-1, EGU General Assembly 2010, Vienna, Austria, 2010.
Lendholt, M., Hammitzsch, M., and Esbri, M. ´A: Integrating Na-tional Tsunami Early Warning Systems – Towards Ocean-wide System-of-Systems Networks. Proceedings of the 9th Interna-tional ISCRAM Conference, Vancouver, Canada, April 2012, in review, 2012.
Lorito, S., Romano, F., Piatanesi, A., and Boschi, E.: Source pro-cess of the September 12: Mw 8.4 southern Sumatra earthquake from tsunami tide gauge record inversion, Geophys. Res. Lett., 35, L02310, doi:10.1029/2007GL032661, 2008.
L¨owe, P., Hammitzsch, M., and Lendholt, M.: Significance of FOSSGIS in the TRIDEC Project. In Geoinformatics FCE CTU 2011, Prague, Czech Republic, May 19–20, 2011, avail-able at: http://geoinformatics.fsv.cvut.cz/gwiki/Significance of FOSSGIS in the TRIDEC Project (last access: 17 June 2011), 2011.
¨
Ozel, N. M.: Turkey Report Slides NEAMTWS-VII. In 7th Session of the Intergovernmental Coordination Group for the Tsunami Early Warning and Mitigation System in the North-eastern Atlantic, the Mediterranean and Connected Seas (ICG/NEAMTWS-VII), Paris, France, 23–25 November 2010, available at: http://ioc-unesco.org/index.php?option=com oe\
&task=viewDocumentRecord\&docID=6447 (last access: 15 July 2011), 2010.
TRIDEC (Collaborative, Complex and Critical Decision-Support in Evolving Crisis): available at: http://www.tridec-online.eu (last access: 12 November 2011), 2012.
UDIGAPP: uDig Application Gallery, DEWS – Distant Early Warning System for Tsunamis: A Multi-hazard Approach, avail-able at: http://udig.refractions.net/gallery/dews/ (last access: 30 October 2010), 2009.
UN: Global Survey of Early Warning Systems, available at: http://www.unisdr.org/2006/ppew/info-resources/ewc3/ Global-Survey-of-Early-Warning-Systems.pdf, 2006.
UNESCO: Indian Ocean Tsunami Warning and Mitigation System IOTWS. Implementation Plan Eighth Session of the Intergovern-mental Coordination Group for the Indian Ocean Tsunami Warn-ing and Mitigation System (ICG/IOTWS-VIII), Melbourne, Aus-tralia, 3–6 May 2011, IOC Technical Series No. 71. (Revision 4), 2011a.
UNESCO: Interim Operational Users Guide for the Tsunami Early Warning and Mitigation System in the North-eastern Atlantic, the Mediterranean and Connected Seas (NEAMTWS), Version 1.9, 4 March 2011, 2011b.