Cryptography Using Contrast Enhancement
M. M. Raghavendra, Sharvani, Satya Narayana, Vijay Kumar, Venkata Raju ECE, Brindavan Institute of Technology And Sciences Kurnool, Andhra Pradesh, India
ABSTRACT
The proposed method of cryptography using contrast enhancement consists of two processes - extraction and recovery. Very often, the communication is required to be secure when the data is sensitive. The existing methods such as the Difference Expansion and Expansion Embedding suffer from undesirable distortion, which makes these methods unsuitable or less reliable. These methods use FFT (fast fourier transform) and this may result in loosing the data at the receiver part. The technique used in proposed system is discrete wavelet transform to achieve data without any loss. The message is embedded into cover image based on key and then, the covered image is transmitted. In this proposed system, one first contribution is a histogram shifting modulation, which adaptively takes care of the image content using the image prediction-errors and, by considering their immediate neighbourhood, the proposed scheme inserts data in textured areas where other methods fail to do so. This method inserts the carrier (cover) in the textured area and thus reduces the distortion. It also increases the embedding capacity of the cover image. In that way, the message embedded and extractor remain synchronized for message extraction and image reconstruction.
Keywords : Discrete wavelet transform, Contrast enhancement
I.
INTRODUCTION
Image data hiding using discrete wavelet transform by contrast enhancement has been intensively studied in the community of signal processing. Also referred as invertible or lossless data hiding, this technique is to embed a piece of information into a carrier signal to generate the marked one, from which the original signal can be exactly recovered after extracting the embedded data. This is useful in some sensitive applications where no permanent change is allowed on the carrier signal. In the literature, most of the proposed algorithms are for digital images to embed invisible data or a visible watermark. Digital communication has become an essential part of infrastructure nowadays, a lot of applications are Internet based The techniques available to achieve this goal is Reversible data hiding technique, the message is transformed into some other form and then the embedded message is transmitted. In reversible data hiding, the data is embedded in a cover file and the cover file is transmitted. This paper proposed a
present your research findings and your analysis of those findings. Discussed in Section
II.
LITERATURE REVIEW
Up till now more work or research has been done in reversible data hiding techniques. Lots of efficient techniques are proposed till. The work done in reversible data hiding techniques are as follows: So by considering this in , Kede Ma, Weiming Zhang, Xianfeng Zhao, Nenghai Yu and Fenghua Li has proposed a technique for embedding the data in reversible manner using reserve room before encryption. Vacating room from the encrypted images losslessly is sometimes difficult and not efficient, so if we reverse order of encryption and vacating room, i.e., reserving room before image encryption, the RDH tasks in encrypted images would be more natural and much easier which gives the reserving room before encryption.There are some standard IDH algorithms available which are ideal for reserving room before encryption and can be easily applied to Framework RRBE to achieve better performance compared with techniques from Framework VRAE. This is because in this new framework, follow the old idea that first lossless data gets compressed with the redundant image content and then encrypts it with respect to protecting privacy. Wen-Chung Kuo, Po-Yu Lai, Lih-ChyauWuu has proposed a adaptive reversible data hiding method. A new scheme based on histogram and slope method enhancing the data hiding capacity and also the efficiency increases and maintains the high quality of image. Kuo-Ming, Wen-Kai Su, Ting-Wen Chen, Li-Ming Chen has proposes the method which is the combination of data hiding, half-toning and vector quantization technique. In this the embedding of text into gray scale image is done. Abraham .G, in proposed the method in which a text in encrypted gray scale image is done in separable manner. Encryption of the image is done by content owner using encryption key by uplifting the pixels positions. Data hiding is done by data hiding key using
histogram modification method. Malik, Anjali Sardana, Jaya in has proposed another different approach for visual cryptography which consists of three steps: 1.Sieving 2.Division 3. Shuffling to generate random shares. The advantage of this is that minimal computation requirement to generate the binary secret image without loss of quality of image. Yi-Hui Chen, Ci-Wei lan and Chiaio-Chih Huang in have proposed the another different approach for visual cryptography is authentication mechanism. In this there are two procedures :
a) Encryption procedure
b) Decryption procedure Cryptography is an art of securely transferring the message from sender to receiver. It uses the key concept for encryption the message information known as cryptography. It is used when communicating over the untrusted media such as internet. Cryptography is the technique that used in securely transfers the information with the use of algorithm which is un-readable by the third-party. Decryption of secret image and authenticated image is obtain by difference expansion.
III.
ENCRYPTION
introduces distortion. This distortion is reduced by the dynamic predictive error histogram shifting algorithms and it increases the quality of the embedded image. The text is usually in the form of a binary sequence. The underflow and overflow problems were avoided in our proposed system.
Figure 1. procedure of the proposed reversible data hiding system.
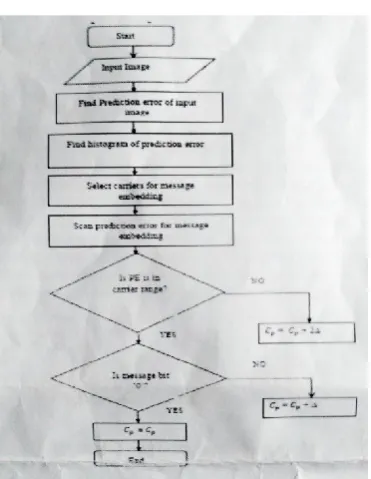
3.1 Algorithm for message embedding 1. Browse the input image
2. Calculate Prediction error of input image 3. Plot histogram of prediction error 4. select the text document .
5. Convert message into binary bits
Following flowchart gives details of message embedding process.
Figure 2. Flow Chart for Message Embedding
3.2 Prediction Error:
In proposed block diagram first step is to find prediction error. This means that the prediction-error neighbourhood is not derived from the original image but from a copy of it where pixels for embedding are replaced by their predicted-values. An alternative to this strategy is to compute the prediction-error neighbourhood using the block of nine pixel neighbour’s.
Figure 3. Pixel Neighbourhood for Prediction
Above figure 3 shows Pixel neighbourhood for prediction in a 3* 3 pixels block B, is estimated through its neighbour’s pixels. From here on, we work with the image prediction-error. Considering the pixel block in Figure 3.5 the prediction-error of the pixel is given by
ei,j = pi,j - pi,j (1)
Where pi,j is the predicted value of pi,j derived from its
eight nearest neighbour pixels : Pi,j= ( ∑3i,j=1 pi,j –p2,2 ) / 8 (2)
It is important to notice that as well as all pixels identified by ‘x’ in Figure 3.5 are modified after embedding. As a consequence, the prediction-error neighbourhood of will also vary if it is computed based on eq. (2)
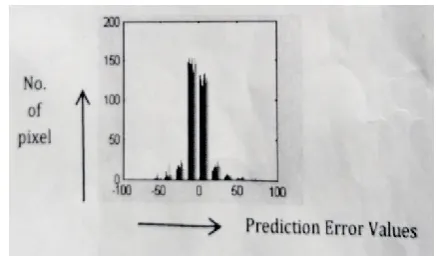
3.3 Histogram of Prediction Errors:
distribution of a continuous variable (quantitative variable) and was first introduced by Karl Pearson. It is a kind of bar graph. To construct a histogram, the first step is to "bin" the range of values that is, divide the entire range of values into a series of intervals— and then count how many values fall into each interval. The bins are usually specified as consecutive, non over lapping intervals of a variable. However, a bounding box-based ground truth is far from accurate, as also stated by Wang and Li.
n = ∑ki=1 mi (3)
Where, n = the total number of observations K = total number of bins
Histograms plots how many times (frequency) each intensity value in image occurs. Example: Image (left) has 256 distinct grey levels (8 bits) . Histogram (right) shows frequency (how many times) each gr ay level occurs.
Figure 4. Histogram of Prediction Error for Input Image
3.4 Classical and Dynamic Histogram Shifting:
There are two types of histogram shifting first one is classical histogram shifting and another is dynamic histogram shifting. Out of these two types dynamic histogram shifting is more efficient.
3.4.1 Basic HS Modulation Principles:
The basic principle of Histogram Shifting modulation, generally samples with values associated to the class of the histogram maxima , are then shifted to the gap or kept unchanged to encode one bit of the message, i.e., ‘0‘ or ‘1‘. As stated previously, we name samples that belong to this class as ―carriers. Other samples, i.e., ―non carriers, are simply shifted. At the
extraction stage, the extractor just has to interpret the message from the samples of the classes and invert watermark distortions .Obviously, in order to restore exactly the original message.
Figure 5. Dynamic Histogram Modulation Applied on Predict Errors
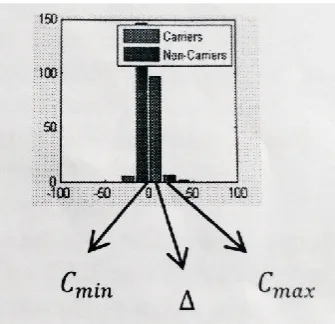
3.6 Classification of Carriers:
The prediction-error can thus be HS modulated as illustrated in the figure 3.11. In that case, prediction-errors which do not belong to the carrier-class = [ -Δ , Δ] are considered as ―non carriers and are shifted of + Δ / -Δ depending on their sign (+Δ if ˃= ; -Δ if <= 0 ). Prediction errors within the class = [ -Δ , Δ] the carriers are used for embedding is left unchanged to encode ‘0‘ or shifted to the range of
[-2 , -Δ] or [Δ , 2Δ], depending on its sign, to encode ‘1‘. Notice that, even though message insertion is conducted in the prediction-error, it is the image pixels which are modulated
Cc = Max (h) – 1 (4) Cc = Max (h) + 1 (5) Where,
Cc = Carriers selected for message embedding
Figure 6. Carriers Range and Area for Input Image
3.5 Text to Binary Conversion: The data to be embedded will be in the form of character. So, at first text will be converted into ASCII codes then into binary bits and then binary bits will get embedded into the image using equations.
3.6 Message Embedding: Carriers are classified from the histogram of prediction error of pixel values. Then the secret image converted into binary sequence. For example a, ascii value of ‘a’ is 97 is converted into binary numbers like 01100001, Embed this binary values in carriers. Finally we get distortion less embedded image.
And if the prediction error is not in the range of carriers then use following formula to change central pixel value.
C p = C p + 2 ∆ (7)
Where,
C p = Central pixel value
∆ = Carrier range (8)
Where C max = maximum value of carrier range
C min= minimum value of carrier range
3.7 Decryption Process:
When data receiver acquires the data embedded image, he can completely extract the hidden information as well as recover the original image without loss. It can be performed with an inverse operation on the data hider side.
3.7.1 Algorithm for extraction of message:
The algorithm for extraction of message is as follows 1. Load embedded image
2. Calculate prediction error of data embedded image. 3. From the values of prediction error find out message bit whether it is ‘0’ or ‘1’by applying
Equations
4. Convert binary bits into characters. 5. check not to overflow and under flow.
Figure 7. Flow Chart for Message Extraction C
3.8 RESULTS AND DISCUSSION
The experiment is performed on various images of different dimensions in order to hide secret information. The information that we want to hide is in the form of character, which is embedded into each of these images. The result of experiment is compared based on the following image quality metrics:
1. Peak Signal to Noise Ratio (PSNR). 2. Mean Square Error (MSE).
3. Capacity of Embedding.
High PSNR value and low MSE value signifies the good quality of image. The MSE and PSNR are the most widely used metrics in the literature that’s why we use them.
Figure 9. Extracted Message
3.9 Experimental Analysis of Quality of Restored Image
The PSNR computes the peak signal-to-noise ratio, in decibels, between two images. This ratio is often used as a quality measurement between the original and a Restored image. The higher the PSNR, the better the quality of the restored, or reconstructed image. The Mean Square Error (MSE) and the Peak Signal to Noise Ratio (PSNR) are the two error metrics used to compare image quality.
IV.
CONCLUSION
In the proposed work then embed and extractor remains integrated because the extractor will have the same reference image. Reversible data hiding is based on dynamic prediction error; histogram shifting reduces the distortion and also improves the security of the original image. The proposed system providing embedding capacity of 64 characters that is 512 binary bits. A dynamic histogram shifting is used to improve capacity and quality, security of the image. The experimental results have shown that the contrast image can be enhanced by increasing PSNR value. Moreover, the original image can be exactly recovered without any additional degradation. Thus, we can say that the proposed algorithm has made the image contrast enhancement reversible. Improving the algorithm robustness, and can be used in the medical and satellite images with the better versatality
V.
REFERENCES
[1]. Dawen Xu, Rangding Wang, and Yun Q. Shi, Fellow, IEEE "Data Hiding in Encrypted H.264/AVC Video Streams by Code word Substitution" IEEE Transaction On Information Forensics and Security, Vol. 9, NO. 4, April 2014 applied to machine vibration analysis," in Proc. ASCI, 1999, pp. 398–405.
[2]. Kede Ma. Weiming Zhang, Xianfeng Zhao, Nenghai Yu,Fenghua Li, "Reversible Data Hiding in Images by Reserving Room Before Encryption", IEEE Trans on Information Forensics and security, Vol. 8, No. 3, March 2013
[3]. Kuo-Ming Hung, Wen-Kai Su, Ting-Wen Chen, LiMing Chen, "Reversible Data Hiding Base on VQ and Halftoning Technique", International Conference on Microelectronics, Communication and Renewable Energy (ICMiCR-2013).
[4]. Jose, R.; Abraham, G, "A separable reversible data hiding in encrypted image with improved performance", Emerging Research Areas and 2013 International Conference on Microelectronics, Communications and Renewable Energy( AICERA/ICMiCR), 2013 Annual International Conference l'IEEE 2013. [5]. Siddhartha Malik, Anjali Sardana, Jaya, "A
Keyless Approach to Image Encryption", 2012 international conference on Communication systems and Network Technologies l'2012 IEEE [6]. Yi-Hui Chen, Ci-Wei lan and Chiao Chih
Huang, " A verifiable Visual Cryptography Scheme", Fifth International Conference and Evolutionary Computing l' IEEE 2011
[7]. D. Coltuc, "Improved embedding for predictionbased reversible watermarking," IEE E Trans. Inf. Forensics Security, vol. 6, no. 3, pp. 873–882, Sep. 2011.
[9]. Histogram",10th International Conference on Intelligent Systems Design and Application, l' IEEE 2010 (2002) The IEEE website. Online]. Available: http://www.ieee.org/
[10]. W. Pan, G. Coatrieux, N. Cuppens, F. Cuppens, and C. Roux, "An additive and lossless watermarking method based on invariant image approximation and Haar wavelet transform," in Proc. IEEE EMBC Conf., Buenos Aires, Argentina, 2010, pp. 4740–4743. 11H. J. Hwang, H. J. Kim, V. Sachnev, and S. H. Joo, "Reversible watermarking method using optimal histogram pair shifting based on prediction and sorting Internet Inform. Syst., vol. 4, no. 4, pp. 655–670, Aug. 2010. 11C. H.Yang andM.H. Tsai, "Improving histogram based reversible data hiding by interleaving predictions," IET Image Process., vol. 4, no. 4, pp. 223–234, Aug. 2010.
Biblography:-
M.M.Raghavendra,Mtech(Ph.D),Bits-Knl,Department of ECE
M.Sharvani,B.Tech,Bits- Knl,Department of ECE
K.Satyanarayanareddy,B.Tech,Bits-Knl,Department of ECE
K.Vijay Kumar,B.Tech, Bits- Knl,Department of ECE