Nat. Hazards Earth Syst. Sci., 11, 2253–2261, 2011 www.nat-hazards-earth-syst-sci.net/11/2253/2011/ doi:10.5194/nhess-11-2253-2011
© Author(s) 2011. CC Attribution 3.0 License.
Natural Hazards
and Earth
System Sciences
The effect of material properties on the seismic performance of
Arch Dams
B. Sevim
G¨um¨us¸hane University, Department of Civil Engineering, 29000, G¨um¨us¸hane, Turkey Received: 1 July 2011 – Accepted: 18 July 2011 – Published: 19 August 2011
Abstract. The paper investigates the effect of material prop-erties on the seismic performance of arch dam-reservoir-foundation interaction systems based on the Lagrangian ap-proach using demand-capacity ratios. Type-5 arch dam is selected as a numerical application. The linear time his-tory analyses of the arch dam-reservoir-foundation interac-tion system are carried out for different material properties. The foundation is taken into account as massless; behaviour of the reservoir is assumed to be linearly elastic, inviscid and irrotational. The north-south component of the Erzincan earthquake in 1992 is chosen as a ground motion. Dynamic equations of motions obtained from 3-D finite element mod-elling of the coupled system are solved by using the New-mark integration algorithm. The damage levels of the cou-pled system for the different material properties are demon-strated by using demand-capacity ratios and cumulative in-elastic durations. The time histories and maximum values of the displacements and principal stresses, and performance curves, are obtained from linear analyses. It is clearly seen from the study that the different material properties affect the seismic behaviour of the dam.
1 Introduction
An arch dam, built to obtain energy, is a solid concrete hy-draulic structure curved in plan and possibly in elevation, which transmits a large portion of the water pressure and other loads by means of thrust (arch action) to the abutment utilising the compressive strength of its material. Therefore, arch dams require sophisticated engineering knowledge in designing and construction. The possible failure of dams
Correspondence to: B. Sevim ([email protected])
retaining large quantities of water presents a hazard for life and property during earthquakes. In addition, the structural damage to these structures can be a considerable economic loss for the government. Many studies have been done on the earthquake behaviour of arch dams by many researchers, past and present (Sevim et al., 2011a, b; Akk¨ose et al., 2008, 2007; Oliveira and Faria, 2006; Alves and Hall, 2006; Shahkarami et al., 2004; Lotfi and Espander, 2004; USACE, 2003). The common aim of these studies is to provide the op-timum arch dam system related to safety and economy. This means that the main gains are aimed at building dams safer, more economically and more useful. So, the selected or as-sumed material properties must be optimally safe and eco-nomical. Because material properties are the most important component of a dam for reliable design and construction.
It is known that the reservoir considerably affects the dy-namic response of the dam during earthquakes. Three ap-proaches are used to consider reservoir effects in the anal-yses: the Westergaard (Westergaard, 1933), Euler (Dun-gar, 1978) and Lagrangian (Wilson and Khalvati, 1983) ap-proaches. In the Westergaard approach, a vibrated mass dis-persion with the dam is considered. In this approach, the dam is rigid, the reservoir has constant depth and infinite ex-tent in the upstream direction, the effect of the waves at the free surface is negligible, and the water is incompressible. In the Euler approach, the displacements are the variables in the structure; the pressures are the variables in the fluid. Since the variables in the fluid and structure are different in this ap-proach, special interface equations are required to solve the coupled system. However, in the Lagrangian approach, the displacements are the variables in both the fluid and the struc-ture. So there is no need for any extra interface equations in the Lagrangian approach. For that reason, compatibility and equilibrium are automatically satisfied at the nodes along the interfaces between fluid and structure.
The earthquake behaviour of arch dams must be evalu-ated using a 3-D model. The nonlinear procedures are re-quired to assess the seismic damage level of concrete dams in earthquake-prone areas. However, it is generally known that nonlinear time history analysis of dam-reservoir-foundation systems demand too much memory and time on the comput-ers. It is also possible to use linear procedures for qualitative estimating of the damage level of concrete arch dams sub-jected to earthquakes (Ghanaat, 2002; USACE, 2003). A lin-ear lin-earthquake analysis of a concrete dam subjected to strong ground motion gives peak tensile stresses greater than the dynamic tensile strength of concrete, so that nonlinear pro-cedures are required to assess the seismic safety of concrete dams in earthquake-prone areas.
The main purpose of this study is to assess the seismic per-formance of arch dams including dam-reservoir-foundation interaction using demand-capacity ratios and cumulative in-elastic durations obtained for different material properties. In this paper, firstly general literature review concerning seis-mic behaviour of arch dams is presented. Then the formu-lation of the Lagrangian approach and seismic damage cri-teria for arch dams are given. After that, a numerical exam-ple is presented with results of time history analyses applied for different material properties. And finally, conclusions in-ferred from the study are presented.
2 Finite element formulation of fluid-structure systems by Lagrangian approach
The formulation of the fluid system based on the Lagrangian approach is given according to references (Wilson and Khal-vati, 1983; Calayır, 1994). In this approach, fluid is assumed to be linearly elastic, inviscid and irrotational. The equations of motion of the fluid system have a similar form with those of the structure system when the Lagrangian approach is con-sidered in the formulations. To obtain the coupled equations of the fluid-structure system, the determination of the inter-face condition is required. Because the fluid is assumed to be inviscid, only the displacement in the normal direction to the interface is continuous at the interface of the system. As-suming that the positive face is the structure and the negative face is the fluid, the boundary condition at the fluid-structure interface is,
U−n =U+n (1)
whereUnis the normal component of the interface displace-ment (Akkas¸ et al., 1979). Using the interface condition, the equations of motion of the coupled system-to-ground motion including damping effects are given by,
McU¨c+CcU˙c+KcUc=Rc (2) in which Mc, Ccand Kcare the mass, damping and stiffness matrices for the coupled system andUc,U˙c,U¨candRcare the vectors of the displacements, velocities, accelerations and external loads of the coupled system, respectively.
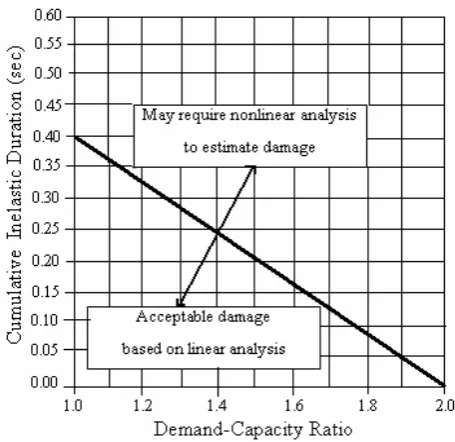
Fig.1. Performance curve for linear elastic analysis of arch dams (Ghanaat, 2002; USACE, 2003).
4. Numerical Example
A double curvature Type-5 arch dam, which was suggested in ‘‘Arch Dams’’ symposium in England in 1968, is selected as a numerical example (Arch Dams, 1968). The geometric properties of Type-5 arch dam are given in Fig. 2. The height of the dam is selected 120m and computed thickness of dam at the top is 5.35m and at the base is 23.35m. Type-5 arch dam is developed considering reservoir and foundation. Some views of finite element model of the dam-reservoir-foundation system are given in Fig. 3. Finite element model of downstream face of Type-5 arch dam, and sections and node selected for comparison of the results are given in Fig. 4. There are three unknown displacements at each nodal point in dam, foundation and reservoir finite element model. 4355 nodes and 3188 finite element are used modeling of the Type-5 arch dam-reservoir-foundation system. 148 solid, 1560 solid and 1480 fluid finite elements concerning to dam, foundation and reservoir, respectively, are considered in the finite element model of the coupled system.
6/21
Fig. 1. Performance curve for linear elastic analysis of arch dams
(Ghanaat, 2002; USACE, 2003).
3 Damage criteria for Arch Dams
The earthquake performance of arch dams is evaluated in ac-cordance with displacements, stresses, demand-capacity ra-tios (DCR) and the cumulative inelastic duration. DCR for arch dams is defined as the ratio of the calculated arch or cantilever stresses-to-tensile strength of the concrete used in the dam. The dam response to the maximum design earth-quake is considered to be within the linear elastic range of behaviour with little or no possibility of damage if computed DCR values are less than or equal to 1. The dam is consid-ered to exhibit a nonlinear response in the form of opening and closing of contraction joints and cracking of the hori-zontal joints (lift lines) and concrete if the estimated DCR values exceed 1. The level of nonlinear response or opening and cracking of concrete is considered acceptable if the DCR value<2, overstressed region is limited to 20 percent of the dam surface area, and the cumulative inelastic duration falls below the performance curve given in Fig. 1 (Ghanaat, 2002; USACE, 2003). The maximum permitted DCR for linear analysis of concrete dams is 2. A demand-capacity ratio of 2 allows stresses up to twice the static tensile strength of the concrete or to the level of dynamic apparent tensile strength, as long as the overstressed region is less than 20 percent of the dam surface area. The cumulative duration beyond a cer-tain level of DCR is obcer-tained by multiplying the number of stress values exceeding that level by the time-step of the time history analysis. The cumulative inelastic duration in Fig. 1 refers to the total duration of all stress excursions beyond a certain level of demand-capacity ratio.
B. Sevim: The effect of material properties on the seismic performance of Arch Dams 2255
Plan
xa=0.3825-0.0425(z-3)2
1.1625 unit
Symmetry
8.65 unit
80o
86o
92o
98o
104o 106o C0
C1
C2
C4 C3
C5,6
Reference
Cylinder 8.65 unit 0.2675 unit
1.
5
unit
z
0.287 unit 6 unit
xw=1.28-0.05(z-4.5)2
x
Crown-Cross Section
Level C0 C1 C2 C3 C4 C5 C6
Radius (unit) 3.67 5.29 6.64 7.72 8.54 8.80 8.50
Central Angle 80o 86o 92o 98o 104o 106o 106o
Fig. 2. The view in plan and vertical crown cross section of Type-5 arch dam.
Fig. 3. Some views of Type-5 arch dam-reservoir-foundation system.
Fig. 4. Finite element model of downstream face of the dam.
Fig. 2. The view in plan and vertical crown cross-section of Type-5 arch dam.
Plan
xa=0.3825-0.0425(z-3)2
1.1625 unit
Symmetry
8.65 unit
80o
86o
92o
98o 104o 106o C0
C1
C2
C4 C3
C5,6
Reference Cylinder 8.65 unit
0.2675 unit
1.
5
unit
z
0.287 unit 6 unit
xw=1.28-0.05(z-4.5)2
x
Crown-Cross Section
Level C0 C1 C2 C3 C4 C5 C6
Radius (unit) 3.67 5.29 6.64 7.72 8.54 8.80 8.50
Central Angle 80o 86o 92o 98o 104o 106o 106o
Fig. 2. The view in plan and vertical crown cross section of Type-5 arch dam.
Fig. 3. Some views of Type-5 arch dam-reservoir-foundation system.
Fig. 4. Finite element model of downstream face of the dam.
7/21
Fig. 3. Some views of the Type-5 arch dam-reservoir-foundation
system.
Plan
xa=0.3825-0.0425(z-3)2
1.1625 unit
Symmetry
8.65 unit
80o
86o
92o
98o
104o
106o
C0
C1
C2
C4
C3
C5,6
Reference Cylinder 8.65 unit
0.2675 unit
1.
5
unit
z
0.287 unit 6 unit
xw=1.28-0.05(z-4.5)2 x
Crown-Cross Section
Level C0 C1 C2 C3 C4 C5 C6
Radius (unit) 3.67 5.29 6.64 7.72 8.54 8.80 8.50
Central Angle 80o 86o 92o 98o 104o 106o 106o Fig. 2. The view in plan and vertical crown cross section of Type-5 arch dam.
Fig. 3. Some views of Type-5 arch dam-reservoir-foundation system.
Fig. 4. Finite element model of downstream face of the dam.
7/21
Fig. 4. Finite element model of downstream face of the dam.
4 Numerical example
A double curvature Type-5 arch dam, which was suggested in “Arch Dams” symposium in England in 1968, is selected as a numerical example (Arch Dams, 1968). The geomet-ric properties of the Type-5 arch dam are given in Fig. 2. The height of the dam is a selected 120 m and computed thickness of the dam at the top is 5.35 m and at the base is 23.35 m. The type-5 arch dam is developed considering the reservoir and foundation. Some views of the finite element model of the dam-reservoir-foundation system are given in Fig. 3. The finite element model of the downstream face of Type-5 arch dam, and sections and node selected for com-parison of the results, are given in Fig. 4. There are three un-known displacements at each nodal point in the dam, foun-dation and reservoir finite element model. 4355 nodes and 3188 finite element are used in the modelling of the Type-5 arch dam-reservoir-foundation system. 148 solid, 1560 solid and 1480 fluid finite elements concerning the dam, founda-tion and reservoir, respectively, are considered in the finite element model of the coupled system.
In this study, the length of the reservoir is taken to be as much as three times the dam height to represent the impounded water (USACE, 2003). In the finite element model of Type-5 arch dam, the dam-reservoir-foundation interaction effects are represented by the Lagrangian ap-proach. The coupling elements are defined in the interface
2256 B. Sevim: The effect of material properties on the seismic performance of Arch Dams
Group Case
Modulus (MPa)
Poisson
Ratio Density (kg/m3) Strength (MPa)
E1 3.0E4 0.15 2500 3
1 E2 2.5E4 0.15 2500 3
E3 2.0E4 0.15 2500 3
P1 3.0E4 0.15 2500 3
Dam 2 P2 3.0E4 0.20 2500 3
P3 3.0E4 0.25 2500 3
W1 3.0E4 0.15 2500 3
3 W2 3.0E4 0.15 2200 3
W3 3.0E4 0.15 2800 3
Reservoir Fluid 80 2.07E3 - 1000 -
Foundation Solid 45 2.1E4 0,3 - -
Linear analyses are performed using ERZIKAN/ERZ-NS component of 1992 Erzincan earthquake (Fig. 5) (Url-1, 2010) which occurred in the North Anatolian Fault. The acceleration is applied to the dam trough upstream-downstream direction. Because of the computational demand of this method, only the first 6.5 seconds of the earthquake were used during calculations. Such an abbreviated duration of time was not expected to adversely affect results as the first few seconds of the Erzincan Earthquake were the most effective (Fig. 5). Element matrices are computed using the Gauss numerical integration technique (Bathe, 1996). The Newmark method is used in the solution of the equation of motions. Rayleigh damping is considered in the analyses and damping ratio is selected as 5%. Linear analyses of coupled system are carried out by using ANSYS finite element program (ANSYS, 2010).
0 1 2 3 4 5 6 7 8 9 10 11 12 1
Time (s) 3
-6.0 -3.0 0.0 3.0 6.0
A
cce
ler
atio
n (m
/s
²)
Max=0.515g
Fig. 5. The time-history of ground motion acceleration of the 1992 Erzincan Earthquake.
9/21
Fig. 5. The time-history of ground motion acceleration of the 1992
Erzincan Earthquake.
of fluid-structure to hold equal the displacements between two reciprocal nodes. So, compatibility and equilibrium are automatically satisfied at the nodes along the interfaces be-tween dam-reservoir-foundation. The length of the founda-tion was taken into account as much as the dam height in the downstream, downward and cross directions. Because of the massless foundation, the analyses considered only the effects of foundation flexibility. So the foundation model ex-tended to a distance beyond which its effects on deflections and natural frequencies of the dam become negligible (US-ACE, 2003).
The main idea of the study is to investigate the effects of different material properties on the seismic performance of arch dams. For this purpose, the changes in foundation and reservoir material properties are selected as constant. How-ever, the material properties of the dam are listed in three groups. In the first group, three elasticity modules are se-lected as Case E1, E2, and E3; Poisson ratio and mass den-sity are constant. In the second group, three Poisson ratios are selected as Case P1, P2, and P3; elasticity modulus and mass density are constant. In the third group, three mass densities are selected as Case W1, W2, and W3; elasticity modulus and Poisson ratio are constant. The material prop-erties of first cases of each group are defined as the same. Therefore, totaly seven different material properties are de-fined and seven different linear time history analyses are per-formed to investigate the seismic performance of Type-5 arch dam. The tensile strength of each material is selected as constant to evaluate the results in the performance curves equally. In the study, material properties selected in the anal-yses are summarized in Table 1.
Linear analyses are performed using ERZIKAN/ERZ-NS component of the 1992 Erzincan earthquake (Fig. 5) (Url-1, 2011) which occurred in the North Anatolian Fault. The ac-celeration is applied to the dam trough upstream-downstream direction. Because of the computational demand of this method, only the first 6.5 seconds of the earthquake were used during calculations. Such an abbreviated duration of time was not expected to adversely affect the results as the first few seconds of the Erzincan Earthquake were the most effective (Fig. 5). Element matrices are computed using the Gauss numerical integration technique (Bathe, 1996). The Newmark method is used in the solution of the equation of
4.1. The Effects of Elasticity Modulus on the Seismic Performance of Type-5 Arch Dam
In this part of the study, three elasticity modules are selected as E1, E2, and E3; Poisson ratio
and mass density are constant (Table 1). The variation of maximum horizontal displacements
on II-II section (Fig.4) of Type-5 arch dam obtained from linear analyses for E1, E2, and E3
cases are depicted in Fig. 6. The maximum displacements are obtained at the crest point and
its values are occurred as 7.2cm, 7.8cm, and 8.1cm for E1, E2, and E3 cases, respectively.
0.0 3.0 6.0 9.0
Displacement (cm)
0 20 40 60 80 100 120
Heig
ht
(m)
E1
E2
E3
Fig. 6. The variation of maximum displacements on II-II section of the arch dam for Case E.
The time histories of horizontal displacements in upstream-downstream direction at the nodal
point 48 (Fig. 4) of the arch dam are plotted for each case in Fig. 7 (a-c). The time histories of
displacements are seen as similar, however displacements increase with decreasing of
elasticity modulus.
10/21
Fig. 6. The variation of maximum displacements on II-II section of
the arch dam for Case E.
motions. Rayleigh damping is considered in the analyses and damping ratio is selected as 5 %. Linear analyses of the cou-pled system are carried out by using ANSYS finite element program (ANSYS, 2010).
4.1 The effects of elasticity modulus on the seismic performance of Type-5 Arch Dam
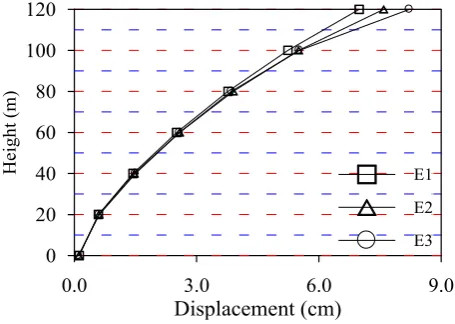
In this part of the study, three elasticity modules are selected as E1, E2, and E3; Poisson ratio and mass density are con-stant (Table 1). The variation of maximum horizontal dis-placements on II-II section (Fig. 4) of Type-5 arch dam ob-tained from linear analyses for E1, E2, and E3 cases are de-picted in Fig. 6. The maximum displacements are obtained at the crest point and its values occurred as 7.2 cm, 7.8 cm, and 8.1 cm for E1, E2, and E3 cases, respectively.
The time histories of horizontal displacements in an upstream-downstream direction at the nodal point 48 (Fig. 4) of the arch dam are plotted for each case in Fig. 7a–c. The time histories of displacements are seen as similar, however, displacements increase with decreasing of elasticity modu-lus.
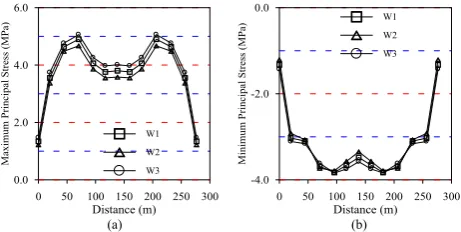
The variation of maximum and minimum principal stresses along I-I section (Fig. 4) are plotted in Fig. 8 for each case. It can be seen from Fig. 8 that the highest max-imum and minmax-imum principal stresses obtained from Case E1, E2 and E3, respectively. The maximum principal stresses are similar in the abutment and the middle parts of the dam. However, the minimum principal stresses are similar only in the abutment parts, but the highest stresses occur in the mid-dle parts of the dam for Case E1, E2 and E3, respectively.
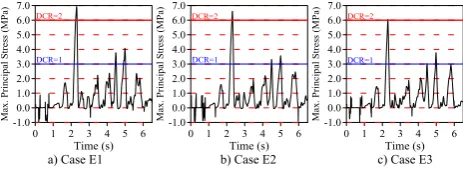
The time histories of maximum principal stresses (tensile stress) at nodal point 48 for each case are plotted by display-ing the demand-capacity ratios (DCR) in Fig. 9a–c. In this study, the tensile strength of the concrete material is selected as 3 MPa. It is clearly seen from Fig. 9 that some values of
B. Sevim: The effect of material properties on the seismic performance of Arch Dams 2257
Table 1. Material properties of Type-5 arch dam-reservoir-foundation system.
Group Case Material Properties
Elasticity Poisson Mass Tensile
Modulus (MPa) Ratio Density (kg m−3) Strength (MPa)
E1 3.0E4 0.15 2500 3
1 E2 2.5E4 0.15 2500 3
E3 2.0E4 0.15 2500 3
P1 3.0E4 0.15 2500 3
Dam 2 P2 3.0E4 0.20 2500 3
P3 3.0E4 0.25 2500 3
W1 3.0E4 0.15 2500 3
3 W2 3.0E4 0.15 2200 3
W3 3.0E4 0.15 2800 3
Reservoir Fluid 80 2.07E3 – 1000 –
Foundation Solid 45 2.1E4 0.3 – –
0 1 2 3 4 5 6
Time (s) -9.0 -6.0 -3.0 0.0 3.0 6.0 9.0 D is pla ce me nt ( cm)
0 1 2 3 4 5 6
Time (s) -9.0 -6.0 -3.0 0.0 3.0 6.0 9.0 D is pla ce me nt ( cm)
0 1 2 3 4 5 6
Time (s) -9.0 -6.0 -3.0 0.0 3.0 6.0 9.0 D is pla ce me nt ( cm)
a) Case E1 b) Case E2 c) Case E3
Fig. 7. The time histories of displacements at the nodal point 48 of arch dam for Case E.
The variation of maximum and minimum principal stresses along I-I section (Fig. 4) are plotted in Fig. 8 for each case. It can be seen from Fig. 8 that the highest maximum and minimum principal stresses obtained from Case E1, E2, and E3, respectively. The maximum principal stresses are similar in abutment and middle parts of the dam. However, the minimum principal stresses are similar only in abutment parts, but the highest stresses occur in middle parts of the dam for Case E1, E2, and E3, respectively.
11/21
Fig. 7. The time histories of displacements at the nodal point 48 of
arch dam for Case E.
the maximum principal stresses are over than DCR = 1 for all cases. It means that the maximum principal stresses occurred on the dam are much more than tensile strength of concrete used in the dam body.
The performance curves at nodal point 48 (Fig. 4) of the arch dam are presented in Fig. 10 for Case E1, E2, and E3. The level of nonlinear response or opening construc-tion joints and/or cracking of concrete is considered accept-able if the DCR value<2 (USACE, 2003). The results show that demand-capacity ratios for Case E2 and E3 are less than 2 and the cumulative inelastic durations at all demand-capacity ratios almost falls below the acceptance curve. It can be stated that the linear analyses of the
dam-reservoir-0 50 100 150 200 250 300
Distance (m) 0.0 2.0 4.0 6.0 Maxi mum Pri ncipal Stress (MPa) E1 E2 E3
0 50 100 150 200 250 300
Distance (m) -4.0 -2.0 0.0 Min imu m Prin cip al Stres s (M Pa) E1 E2 E3
(a) (b)
Fig. 8. The maximum (a) and minimum (b) stresses at section I-I of arch dam for Case E.
The time histories of maximum principal stresses (tensile stress) at nodal point 48 for each case are plotted by displaying the demand-capacity ratios (DCR) in Fig. 9 (a-c). In this study, tensile strength of concrete material is selected as 3 MPa. It is clearly seen from Fig. 9 that some values of maximum principal stresses are over than DCR=1 for all cases. It means that the maximum principal stresses occurred on the dam are much more than tensile strength of concrete used in dam body.
0 1 2 3 4 5 6
Time (s) -1.0 0.0 1.0 2.0 3.0 4.0 5.0 6.0 7.0 Ma x. Pr in ci pa l St re ss (M P a)
0 1 2 3 4 5 6
Time (s) -1.0 0.0 1.0 2.0 3.0 4.0 5.0 6.0 7.0 Ma x. Pr in ci pa l St re ss (M P a)
0 1 2 3 4 5 6
Time (s) -1.0 0.0 1.0 2.0 3.0 4.0 5.0 6.0 7.0 Ma x. Pr in ci pa l St re ss (M P a)
DCR=2 DCR=2 DCR=2
DCR=1 DCR=1 DCR=1
a) Case E1 b) Case E2 c) Case E3
Fig. 9. The time histories of maximum stresses at nodal point 48 of the arch dam for Case E.
The performance curves at nodal point 48 (Fig. 4) of the arch dam are presented in Fig. 10 for Case E1, E2, and E3. The level of nonlinear response or opening construction joints and/or cracking of concrete is considered acceptable if the DCR value<2 (USACE, 2003). The results show that demand-capacity ratios for Case E2, and E3 are less than 2 and the cumulative inelastic durations at all demand-capacity ratios almost falls below the acceptance
12/21
Fig. 8. The maximum (a) and minimum (b) stresses at section I-I
of arch dam for Case E.
0 50 100 150 200 250 300
Distance (m) 0.0 2.0 4.0 6.0 Maxi mum Pri ncipal Stress (MPa) E1 E2 E3
0 50 100 150 200 250 300
Distance (m) -4.0 -2.0 0.0 Min imu m Prin cip al Stres s (M Pa) E1 E2 E3
(a) (b)
Fig. 8. The maximum (a) and minimum (b) stresses at section I-I of arch dam for Case E.
The time histories of maximum principal stresses (tensile stress) at nodal point 48 for each case are plotted by displaying the demand-capacity ratios (DCR) in Fig. 9 (a-c). In this study, tensile strength of concrete material is selected as 3 MPa. It is clearly seen from Fig. 9 that some values of maximum principal stresses are over than DCR=1 for all cases. It means that the maximum principal stresses occurred on the dam are much more than tensile strength of concrete used in dam body.
0 1 2 3 4 5 6
Time (s) -1.0 0.0 1.0 2.0 3.0 4.0 5.0 6.0 7.0 Ma x. Pr in ci pa l St re ss (M P a)
0 1 2 3 4 5 6
Time (s) -1.0 0.0 1.0 2.0 3.0 4.0 5.0 6.0 7.0 Ma x. Pr in ci pa l St re ss (M P a)
0 1 2 3 4 5 6
Time (s) -1.0 0.0 1.0 2.0 3.0 4.0 5.0 6.0 7.0 Ma x. Pr in ci pa l St re ss (M P a)
DCR=2 DCR=2 DCR=2
DCR=1 DCR=1 DCR=1
a) Case E1 b) Case E2 c) Case E3
Fig. 9. The time histories of maximum stresses at nodal point 48 of the arch dam for Case E.
The performance curves at nodal point 48 (Fig. 4) of the arch dam are presented in Fig. 10 for Case E1, E2, and E3. The level of nonlinear response or opening construction joints and/or cracking of concrete is considered acceptable if the DCR value<2 (USACE, 2003). The results show that demand-capacity ratios for Case E2, and E3 are less than 2 and the cumulative inelastic durations at all demand-capacity ratios almost falls below the acceptance
12/21
Fig. 9. The time histories of maximum stresses at nodal point 48 of
the arch dam for Case E.
foundation system is sufficient for Case E2 and E3 and no or little damage may occur on the dam body. However, the demand-capacity ratios for Case E1 exceed 2 and the cumu-lative inelastic duration is substantially greater than the ac-ceptable level. It is thought that Case E1 will cause signifi-cant damage on the dam body. Therefore, nonlinear analysis of the coupled system under material properties with Case E1 would require a more accurate estimate of the damage.
2258 B. Sevim: The effect of material properties on the seismic performance of Arch Dams
for Case E2 and E3 and no or little damage may occur on the dam body. However, the
demand-capacity ratios for Case E1 exceed 2 and the cumulative inelastic duration is
substantially greater than the acceptable level. It is thought that Case E1 will be caused
significant damage on the dam body. Therefore, nonlinear analysis of the coupled system
under material properties with Case E1 would require for more accurate estimate of the
damage.
1.0 1.2 1.4 1.6 1.8 2.0
Demand-Capacity Ratio
0.00 0.10 0.20 0.30 0.40 0.50 Inelastic Cumula tive Duration (s) E1 E2 E3Fig. 10. Performance curves at nodal point 48 of the arch dam for Case E1, E2, and E3.
4.2. The Effects of Poisson Ratio on the Seismic Performance of Type-5 Arch Dam
In this part of the study, three Poisson ratios are selected as P1, P2, and P3; elasticity modulus
and mass density are constant (Table 1). The variation of maximum horizontal displacements
on II-II section (Fig.4) of Type-5 arch dam obtained from linear analyses for P1, P2, and P3
cases are depicted in Fig. 11. The maximum displacements are obtained at the crest point and
its values are almost near to each other.
13/21
Fig. 10. Performance curves at nodal point 48 of the arch dam for
Case E1, E2 and E3.
0.0 3.0 6.0 9.0
Displacement (cm)
0 20 40 60 80 100 120Height (m) P1
P2
P3
Fig. 11. The variation of maximum displacements on II-II section of the arch dam for Case P.
The time histories of horizontal displacements in upstream-downstream direction at the nodal
point 48 (Fig.4) of the arch dam are plotted for each case in Fig. 12 (a-c). The time histories
of displacements for each case are similar to each other. This shows that different Poisson
ratios do not change the results affluently.
0 1 2 3 4 5 6
Time (s)
-9.0 -6.0 -3.0 0.0 3.0 6.0 9.0D
is
pla
ce
me
nt
(
cm)
0 1 2 3 4 5 6
Time (s)
-9.0 -6.0 -3.0 0.0 3.0 6.0 9.0D
is
pla
ce
me
nt
(
cm)
0 1 2 3 4 5 6
Time (s)
-9.0 -6.0 -3.0 0.0 3.0 6.0 9.0D
is
pla
ce
me
nt
(
cm)
a) Case P1
b) Case P2
c) Case P3
Fig. 12. The time histories of displacements at the nodal point 48 of arch dam for Case P.
The variation of maximum and minimum principal stresses along I-I section (Fig. 4) are
plotted in Fig. 13 for each case. It can be seen from Fig. 13 that the distribution of the
maximum and minimum principal stresses obtained from Case P1, P2, and P3 are similar to
each other.
Fig. 11. The variation of maximum displacements on II-II section
of the arch dam for Case P.
4.2 The effects of Poisson ratio on the seismic performance of Type-5 Arch Dam
In this part of the study, three Poisson ratios are selected as P1, P2 and P3; elasticity modulus and mass density are con-stant (Table 1). The variation of maximum horizontal dis-placements on II-II section (Fig. 4) of Type-5 arch dam ob-tained from linear analyses for P1, P2 and P3 cases are de-picted in Fig. 11. The maximum displacements are obtained at the crest point and its values are almost near to each other. The time histories of horizontal displacements in an upstream-downstream direction at the nodal point 48 (Fig. 4) of the arch dam are plotted for each case in Fig. 12a–c. The time histories of displacements for each case are similar to each other. This shows that different Poisson ratios do not change the results affluently.
0.0 3.0 6.0 9.0
Displacement (cm) 0 20 40 60 80
Height (m) P1
P2
P3
Fig. 11. The variation of maximum displacements on II-II section of the arch dam for Case P.
The time histories of horizontal displacements in upstream-downstream direction at the nodal point 48 (Fig.4) of the arch dam are plotted for each case in Fig. 12 (a-c). The time histories of displacements for each case are similar to each other. This shows that different Poisson ratios do not change the results affluently.
0 1 2 3 4 5 6
Time (s) -9.0 -6.0 -3.0 0.0 3.0 6.0 9.0 D is pla ce me nt ( cm)
0 1 2 3 4 5 6
Time (s) -9.0 -6.0 -3.0 0.0 3.0 6.0 9.0 D is pla ce me nt ( cm)
0 1 2 3 4 5 6
Time (s) -9.0 -6.0 -3.0 0.0 3.0 6.0 9.0 D is pla ce me nt ( cm)
a) Case P1 b) Case P2 c) Case P3
Fig. 12. The time histories of displacements at the nodal point 48 of arch dam for Case P.
The variation of maximum and minimum principal stresses along I-I section (Fig. 4) are plotted in Fig. 13 for each case. It can be seen from Fig. 13 that the distribution of the maximum and minimum principal stresses obtained from Case P1, P2, and P3 are similar to each other.
14/21
Fig. 12. The time histories of displacements at the nodal point 48
of arch dam for Case P.
0 50 100 150 200 250 300
Distance (m) 0.0 2.0 4.0 6.0 Maxi mum Pri ncipal Stress (MPa) P1 P2 P3
0 50 100 150 200 250 300
Distance (m) -4.0 -2.0 0.0 M inim um P ri nc ipa l St re ss ( M Pa ) P1 P2 P3
(a) (b)
Fig. 13. The maximum (a) and minimum (b) stresses at section I-I of arch dam for Case P.
The time histories of maximum principal stresses (tensile stress) at nodal point 48, which is the most representative crest point of downstream side of the dam, for each case are plotted by displaying the demand-capacity ratios (DCR) in Fig. 14 (a-c). It is clearly seen from Fig. 14 that some values of maximum principal stresses are over than DCR=1 for all cases. It means that the maximum principal stresses occurred on the dam are much more than tensile strength of concrete used in dam body.
0 1 2 3 4 5 6
Time (s) -1.0 0.0 1.0 2.0 3.0 4.0 5.0 6.0 7.0 Ma x. Pr in ci pa l St re ss (M P a)
0 1 2 3 4 5 6
Time (s) -1.0 0.0 1.0 2.0 3.0 4.0 5.0 6.0 7.0 Ma x. Pr in ci pa l St re ss (M P a)
0 1 2 3 4 5 6
Time (s) -1.0 0.0 1.0 2.0 3.0 4.0 5.0 6.0 7.0 Ma x. Pr in ci pa l St re ss (M P a) DCR=2 DCR=2 DCR=2 DCR=1 DCR=1 DCR=1
a) Case P1 b) Case P2 c) Case P3
Fig. 14. The time histories of maximum stresses at nodal point 48 of the arch dam for Case P.
The performance curves at nodal point 48 (Fig. 4) of the arch dam are presented in Fig. 15 for Case P1, P2, and P3. The level of nonlinear response or opening construction joints and/or cracking of concrete is considered acceptable if the DCR value<2 (USACE, 2003). The results show that demand-capacity ratios for all three cases are more than 2 and the cumulative inelastic durations at all demand-capacity ratios almost exceed above the acceptance curve. It can be stated that the linear analyses of dam-reservoir-foundation system
15/21
Fig. 13. The maximum (a) and minimum (b) stresses at section I-I
of arch dam for Case P.
The variation of maximum and minimum principal stresses along I-I section (Fig. 4) are plotted in Fig. 13 for each case. It can be seen from Fig. 13 that the distribution of the maximum and minimum principal stresses obtained from Case P1, P2 and P3 are similar to each other.
The time histories of maximum principal stresses (tensile stress) at nodal point 48, which is the most representative crest point of the downstream side of the dam, for each case are plotted by displaying the demand-capacity ratios (DCR) in Fig. 14a–c. It is clearly seen from Fig. 14 that some values of maximum principal stresses are over than DCR = 1 for all cases. It means that the maximum principal stresses which occurred on the dam are much more than tensile strength of concrete used in the dam body.
The performance curves at nodal point 48 (Fig. 4) of the arch dam are presented in Fig. 15 for Case P1, P2 and P3. The level of nonlinear response or opening construction joints and/or cracking of concrete is considered acceptable if the DCR value<2 (USACE, 2003). The results show that demand-capacity ratios for all three cases are more than 2 and the cumulative inelastic durations at all demand-capacity ra-tios almost exceed the acceptance curve. It can be stated that the linear analyses of dam-reservoir-foundation system is in-sufficient for Case P1, P2 and P3 and some or significant damage may occur on the dam body. Therefore, nonlinear analysis of the coupled system under material properties with Case P1, P2 and P3 would require more accurate estimates of the damage.
B. Sevim: The effect of material properties on the seismic performance of Arch Dams 2259
0 50 100 150 200 250 300
Distance (m) 0.0 2.0 4.0 6.0 Maxi mum Pri ncipal Stress (MPa) P1 P2 P3
0 50 100 150 200 250 300
Distance (m) -4.0 -2.0 0.0 M inim um P ri nc ipa l St re ss ( M Pa ) P1 P2 P3
(a) (b)
Fig. 13. The maximum (a) and minimum (b) stresses at section I-I of arch dam for Case P.
The time histories of maximum principal stresses (tensile stress) at nodal point 48, which is the most representative crest point of downstream side of the dam, for each case are plotted by displaying the demand-capacity ratios (DCR) in Fig. 14 (a-c). It is clearly seen from Fig. 14 that some values of maximum principal stresses are over than DCR=1 for all cases. It means that the maximum principal stresses occurred on the dam are much more than tensile strength of concrete used in dam body.
0 1 2 3 4 5 6
Time (s) -1.0 0.0 1.0 2.0 3.0 4.0 5.0 6.0 7.0 Ma x. Pr in ci pa l St re ss (M P a)
0 1 2Time (s)3 4 5 6
-1.0 0.0 1.0 2.0 3.0 4.0 5.0 6.0 7.0 Ma x. Pr in ci pa l St re ss (M P a)
0 1 2Time (s)3 4 5 6
-1.0 0.0 1.0 2.0 3.0 4.0 5.0 6.0 7.0 Ma x. Pr in ci pa l St re ss (M P a) DCR=2 DCR=2 DCR=2 DCR=1 DCR=1 DCR=1
a) Case P1 b) Case P2 c) Case P3
Fig. 14. The time histories of maximum stresses at nodal point 48 of the arch dam for Case P.
The performance curves at nodal point 48 (Fig. 4) of the arch dam are presented in Fig. 15 for Case P1, P2, and P3. The level of nonlinear response or opening construction joints and/or cracking of concrete is considered acceptable if the DCR value<2 (USACE, 2003). The results show that demand-capacity ratios for all three cases are more than 2 and the cumulative inelastic durations at all demand-capacity ratios almost exceed above the acceptance curve. It can be stated that the linear analyses of dam-reservoir-foundation system
15/21
Fig. 14. The time histories of maximum stresses at nodal point 48
of the arch dam for Case P.
is insufficient for Case P1, P2, and P3 and some or significant damage may occur on the dam body. Therefore, nonlinear analysis of the coupled system under material properties with Case P1, P2, and P3 would require for more accurate estimate of the damage.
1.0 1.2 1.4 1.6 1.8 2
Demand-Capacity Ratio .0 0.00 0.10 0.20 0.30 0.40 0.50 Inelastic Cumulative Duration (s) P1 P2 P3
Fig. 15. Performance curves at nodal point 48 of the arch dam for Case P1, P2, and P3.
4.2. The Effects of Mass Density on the Seismic Performance of Type-5 Arch Dam
In this part of the study, three mass densities are selected as W1, W2, and W3; elasticity modulus and poisson ratio are constant (Table 1). The variation of maximum horizontal displacements on II-II section (Fig.4) of Type-5 arch dam obtained from linear analyses for W1, W2, and W3 cases are depicted in Fig. 16. The maximum displacements are obtained at the crest point and its values are near to each other. But they are a little higher for higher mass density values.
16/21
Fig. 15. Performance curves at nodal point 48 of the arch dam for
Case P1, P2 and P3.
4.3 The effects of mass density on the seismic performance of Type-5 Arch Dam
In this part of the study, three mass densities are selected as W1, W2 and W3; elasticity modulus and poisson ratio are constant (Table 1). The variation of maximum horizontal displacements on II-II section (Fig. 4) of Type-5 arch dam obtained from linear analyses for W1, W2 and W3 cases are depicted in Fig. 16. The maximum displacements are ob-tained at the crest point and its values are near to each other. But they are a little higher for higher mass density values.
The time histories of horizontal displacements in the upstream-downstream direction at the nodal point 48 (Fig. 4) of the arch dam are plotted in Fig. 17a–c for each case. The time histories of displacements for each case are similar to each other. This shows that different mass densities do not change the results affluently.
The variation of maximum and minimum principal stresses along I-I section (Fig. 4) are plotted in Fig. 18 for each case. It can be seen from Fig. 18 that the distribution of the maximum and minimum principal stresses obtained from Case W1, W2 and W3 are similar to each other. Also, the highest values of minimum principal stresses for each case are near. However, the highest values of minimum principal stresses are obtained from W3, W1 and W2, respectively.
0.0 3.0 6.0 9.0
Displacement (cm)
0 20 40 60 80 100 120Height (m) W1
W2
W3
Fig. 16. The variation of maximum displacements on II-II section of the arch dam for Case W
The time histories of horizontal displacements in upstream-downstream direction at the nodal
point 48 (Fig.4) of the arch dam are plotted in Fig. 17 (a-c) for each case. The time histories
of displacements for each case are similar to each other. This shows that different mass
densities do not change the results affluently.
0 1 2 3 4 5 6
Time (s)
-9.0 -6.0 -3.0 0.0 3.0 6.0 9.0D
is
pla
ce
me
nt
(
cm)
0 1 2 3 4 5 6
Time (s)
-9.0 -6.0 -3.0 0.0 3.0 6.0 9.0D
is
pla
ce
me
nt
(
cm)
0 1 2 3 4 5 6
Time (s)
-9.0 -6.0 -3.0 0.0 3.0 6.0 9.0D
is
pla
ce
me
nt
(
cm)
a) Case W1
b) Case W2
c) Case W3
Fig. 17. The time histories of displacements at the nodal point 48 of arch dam for Case W.
The variation of maximum and minimum principal stresses along I-I section (Fig. 4) are
plotted in Fig. 18 for each case. It can be seen from Fig. 18 that the distribution of the
17/21
Fig. 16. The variation of maximum displacements on II-II section
of the arch dam for Case W.
0.0 3.0 6.0 9.0
Displacement (cm) 0 20 40 60 80 100 120
Height (m) W1
W2 W3
Fig. 16. The variation of maximum displacements on II-II section of the arch dam for Case W
The time histories of horizontal displacements in upstream-downstream direction at the nodal point 48 (Fig.4) of the arch dam are plotted in Fig. 17 (a-c) for each case. The time histories of displacements for each case are similar to each other. This shows that different mass densities do not change the results affluently.
0 1 2 3 4 5 6
Time (s) -9.0 -6.0 -3.0 0.0 3.0 6.0 9.0 D is pla ce me nt ( cm)
0 1 2 3 4 5 6
Time (s) -9.0 -6.0 -3.0 0.0 3.0 6.0 9.0 D is pla ce me nt ( cm)
0 1 2 3 4 5 6
Time (s) -9.0 -6.0 -3.0 0.0 3.0 6.0 9.0 D is pla ce me nt ( cm)
a) Case W1 b) Case W2 c) Case W3
Fig. 17. The time histories of displacements at the nodal point 48 of arch dam for Case W. The variation of maximum and minimum principal stresses along I-I section (Fig. 4) are plotted in Fig. 18 for each case. It can be seen from Fig. 18 that the distribution of the
17/21
Fig. 17. The time histories of displacements at the nodal point 48
of arch dam for Case W.
The time histories of maximum principal stresses (tensile stress) at nodal point 48, which is the most representative crest point of downstream side of the dam, for each case are plotted by displaying the demand-capacity ratios (DCR) in Fig. 19a–c. It is clearly seen from Fig. 19 that some values of maximum principal stresses are over than DCR = 1 for all cases. It means that the maximum principal stresses occurred on the dam are much more than tensile strength of concrete used in dam body.
The performance curves at nodal point 48 (Fig. 4) of the arch dam are presented in Fig. 20 for Case W1, W2 and W3. The level of nonlinear response or opening construction joints and/or cracking of concrete is considered acceptable if the DCR value<2 (USACE, 2003). The results show that demand-capacity ratios for all three cases are more than 2
2260 B. Sevim: The effect of material properties on the seismic performance of Arch Dams
maximum and minimum principal stresses obtained from Case W1, W2, and W3 are similar to each other. Also, the highest values of minimum principal stresses for each case are near. However, the highest values of minimum principal stresses are obtained from W3, W1, and W2, respectively.
0 50 100 150 200 250 300
Distance (m) 0.0 2.0 4.0 6.0 Maxi mum Pri ncipal Stress (MPa) W1 W2 W3
0 50 100 150 200 250 300
Distance (m) -4.0 -2.0 0.0 M inim um P ri nc ipa l St re ss ( M Pa ) W1 W2 W3
(a) (b)
Fig. 18. The maximum (a) and minimum (b) stresses at section I-I of arch dam for Case W.
The time histories of maximum principal stresses (tensile stress) at nodal point 48, which is the most representative crest point of downstream side of the dam, for each case are plotted by displaying the demand-capacity ratios (DCR) in Fig. 19 (a-c). It is clearly seen from Fig. 19 that some values of maximum principal stresses are over than DCR=1 for all cases. It means that the maximum principal stresses occurred on the dam are much more than tensile strength of concrete used in dam body.
0 1 2 3 4 5 6
Time (s) -1.0 0.0 1.0 2.0 3.0 4.0 5.0 6.0 7.0 Ma x. Pr in ci pa l St re ss (M P a)
0 1 2 3 4 5 6
Time (s) -1.0 0.0 1.0 2.0 3.0 4.0 5.0 6.0 7.0 Ma x. Pr in ci pa l St re ss (M P a)
0 1 2 3 4 5 6
Time (s) -1.0 0.0 1.0 2.0 3.0 4.0 5.0 6.0 7.0 8.0 Ma x. Pr in ci pa l St re ss (M P a) DCR=2 DCR=2 DCR=2 DCR=1 DCR=1 DCR=1
a) Case W1 b) Case W2 c) Case W3
Fig. 19. The time histories of maximum stresses at nodal point 48 of the arch dam for Case W The performance curves at nodal point 48 (Fig. 4) of the arch dam are presented in Fig. 20 for Case W1, W2, and W3. The level of nonlinear response or opening construction joints and/or
18/21
Fig. 18. The maximum (a) and minimum (b) stresses at section I-I
of arch dam for Case W.
maximum and minimum principal stresses obtained from Case W1, W2, and W3 are similar to each other. Also, the highest values of minimum principal stresses for each case are near. However, the highest values of minimum principal stresses are obtained from W3, W1, and W2, respectively.
0 50 100 150 200 250 300
Distance (m) 0.0 2.0 4.0 6.0 Maxi mum Pri ncipal Stress (MPa) W1 W2 W3
0 50 100 150 200 250 300Distance (m)
-4.0 -2.0 0.0 M inim um P ri nc ipa l St re ss ( M Pa ) W1 W2 W3
(a) (b)
Fig. 18. The maximum (a) and minimum (b) stresses at section I-I of arch dam for Case W.
The time histories of maximum principal stresses (tensile stress) at nodal point 48, which is the most representative crest point of downstream side of the dam, for each case are plotted by displaying the demand-capacity ratios (DCR) in Fig. 19 (a-c). It is clearly seen from Fig. 19 that some values of maximum principal stresses are over than DCR=1 for all cases. It means that the maximum principal stresses occurred on the dam are much more than tensile strength of concrete used in dam body.
0 1 2 3 4 5 6
Time (s) -1.0 0.0 1.0 2.0 3.0 4.0 5.0 6.0 7.0 Ma x. Pr in ci pa l St re ss (M P a)
0 1 2 3 4 5 6
Time (s) -1.0 0.0 1.0 2.0 3.0 4.0 5.0 6.0 7.0 Ma x. Pr in ci pa l St re ss (M P a)
0 1 2 3 4 5 6
Time (s) -1.00.0 1.0 2.0 3.0 4.0 5.0 6.0 7.0 8.0 Ma x. Pr in ci pa l St re ss (M P a) DCR=2 DCR=2 DCR=2 DCR=1 DCR=1 DCR=1
a) Case W1 b) Case W2 c) Case W3
Fig. 19. The time histories of maximum stresses at nodal point 48 of the arch dam for Case W The performance curves at nodal point 48 (Fig. 4) of the arch dam are presented in Fig. 20 for Case W1, W2, and W3. The level of nonlinear response or opening construction joints and/or
18/21
Fig. 19. The time histories of maximum stresses at nodal point 48
of the arch dam for Case W.
and the cumulative inelastic durations at all demand-capacity ratios almost exceed above the acceptance curve. It can be stated that the linear analyses of dam-reservoir-foundation system is insufficient for Case W1, W2 and W3 and some or significant damage may occur on the dam body. There-fore, nonlinear analysis of the coupled system under material properties with Case W1, W2 and W3 would require more accurate estimates of the damage.
5 Conclusions
The study presents the effects of material properties on the seismic performance of arch dam-reservoir-foundation sys-tems by using demand-capacity ratios. The 3-D time history analyses of the coupled system are performed for three differ-ent material groups. In the first group, the elasticity modulus is selected changeable; in the second group, the Poisson ra-tio is selected changeable; and in the third group, the mass density is selected changeable. The time histories and maxi-mum values of the displacements and principal stresses, and performance curves, are obtained from linear analyses to de-termine the material effects on the seismic performance of the Type-5 arch dam.
– The first group analyses show that Type-5 arch dam has a nonlinear behaviour under selected earthquake for higher elasticity modulus of the dam. While demand-capacity ratio exceeds to 2, and the cumulative inelas-tic duration is substantially greater than the acceptable
results show that demand-capacity ratios for all three cases are more than 2 and the
cumulative inelastic durations at all demand-capacity ratios almost exceed above the
acceptance curve. It can be stated that the linear analyses of dam-reservoir-foundation system
is insufficient for Case W1, W2, and W3 and some or significant damage may occur on the
dam body. Therefore, nonlinear analysis of the coupled system under material properties with
Case W1, W2, and W3 would require for more accurate estimate of the damage.
1.0 1.2 1.4 1.6 1.8 2.0
Demand-Capacity Ratio
0.00 0.10 0.20 0.30 0.40 0.50 Inelastic Cumula tive Duration (s) W1 W2 W3Fig. 20. Performance curves at nodal point 48 of the arch dam for Case W1, W2, and W3.
5. Conclusions
The study presents the effects of material properties on the seismic performance of arch
dam-reservoir-foundation systems by using demand-capacity ratios. The 3D time history analyses
of the coupled system are performed for three different material groups. In the first group, the
elasticity modulus is selected changeable; in the second group, the Poisson ratio is selected
changeable; and in the third group, the mass density is selected changeable. The time histories
and maximum values of the displacements and principal stresses, and performance curves are
obtained from linear analyses to determine the material effects on the seismic performance of
Type-5 arch dam.
9
The first group analyses show that Type-5 arch dam has a nonlinear behavior under
selected earthquake for higher elasticity modulus of the dam. While demand-capacity ratio
exceeds to 2, and the cumulative inelastic duration is substantially greater than the acceptable
19/21
Fig. 20. Performance curves at nodal point 48 of the arch dam for
Case W1, W2 and W3.
level for Case E1; it is less than 2, and the cumulative inelastic duration at all demand-capacity ratios almost falls below the acceptance curve for Case E2 and E3. – The second group analyses show that Type-5 arch dam
has a nonlinear behaviour under selected earthquake for all assumed Poisson ratios of the dam. However, the displacement and principal stress results are very near to each other for Case P1, P2 and P3. This implies that the changes on Poisson Ratio are not affected by dam behaviour.
– The third group analyses show that the results obtained for different mass density values are similar to the sec-ond group analyses results. However, it can be stated that the changes on mass density are more effective on the seismic performance of the Type-5 arch dam than the changes on Poisson ratio.
– The results show that demand-capacity ratios for smaller elasticity modules and mass densities are less than 2, and the cumulative inelastic duration at all demand-capacity ratios almost falls below the accep-tance curve. The dam response under the earthquake can be considered to be within the linear elastic range of behaviour with little or no possibility of damage. How-ever, demand-capacity ratios for higher elasticity mod-ules and mass densities exceed 2, and the cumulative inelastic duration is substantially greater than the ac-ceptable level. It is thought that the dam will exhibit a nonlinear response in the form of cracking of the con-crete and/or opening of the construction joints. Then a nonlinear analysis would be required for a more accu-rate estimate of the damage.
– In this study, the changes of selected material properties are about 20–30 %, however, the changes of the results
B. Sevim: The effect of material properties on the seismic performance of Arch Dams 2261 are smaller, especially obtained for Poisson ratios and
mass densities. On the other hand, if it is necessary to compare material properties, the author can suggest that the elasticity modulus is more effective on the seismic performance of Type-5 arch dam than the Poisson ratio and mass density.
Edited by: M. E. Contadakis
Reviewed by: two anonymous referees
References
Akkas¸, N., Akay, H. U., and Yılmaz, C.: Applicability of General-Purpose Finite Element Programs in Solid-Fluid Interaction Problems, Comput. Struct., 10, 773–783, 1979.
Akk¨ose, M., Adanur, S., Bayraktar, A., and Dumanoˇglu, A. A.: Elasto-Plastic Earthquake Response of Arch Dams Including Fluid-Structure Interaction by The Lagrangian Approach, Appl. Math. Modell., 32, 2396–2412, 2008.
Akk¨ose, M., Bayraktar, A., and Dumanoˇglu, A. A.: Reservoir Water Level Effects on Nonlinear Dynamic Response of Arch Dams, J. Fluid. Struct., 24, 418–435, 2007.
Alves, S. W. and Hall, J. F.: System Identification of a Concrete Arch Dam and Calibration of Its Finite Element Model, Earth-quake Eng. Struc., 35, 1321–1337, 2006.
ANSYS: Swanson Analysis System, US, 2010.
Arch Dams: a Review of British Research and Development, Pro-ceedings of the Symposium Held at the Institution of Civil Engi-neers, London, England, 1968.
Bathe, K. J.: Finite Element Procedures in Engineering Analysis, Englewood Cliffs, New Jersey, Prentice-Hall, 1996.
Calayır, Y.: Dynamic Analysis of Concrete Gravity Dams using the Eulerian and Lagrangian Approaches, Ph.D. Thesis, Karadeniz Technical University, Trabzon, Turkey, 1994 (in Turkish).
Dungar, R.: An Efficient Method of Fluid-Structure Coupling in the Dynamic Analysis of Structures, Int. J. Num. Meth. Eng., 13, 93–107, 1978.
Ghanaat, Y.: Seismic Performance and Damage Criteria for Con-crete Dams, Proceedings of the 3rd US-Japan Workshop on Advanced Research on Earthquake Engineering for Dams, San Diego, California, 2002.
Lotfi, V. and Espandar, R.: Seismic Analysis of Concrete Arch Dams by Combined Discrete Crack and Non-orthogonal Smeared Crack Technique, Eng. Struct., 26, 27–37, 2004. Oliveira, S. and Faria, R.: Numerical Simulation of Collapse
Sce-narios in Reduced Scale Tests of Arch Dams, Eng. Struct., 28, 1430–1439, 2006.
Sevim, B., Bayraktar, A., and Altunıs¸ık, A. C.: Finite Element Model Calibration of Berke Arch Dam using Operational Modal Testing, J. Vib. Control, 17(7) 1065–1079, 2011a.
Sevim, B., Altunıs¸ık, A. C., Bayraktar, A., Akk¨ose, M., and Calayır, Y.: Water Length and Height Effects on the Earthquake Behav-ior of Arch Dam-Reservoir-Foundation Ssystems, KSCE J. Civil Eng., 15(2), 295–303, 2011b.
Shahkarami, A., Delforouzi, M., and Salarirad, H.: Study of the Compression and Tension Factors of Safety with a 3-D FE Model for an Arch Dam and Rock Foundation: a Case Study of the KarunIII Arch Dam in Iran, Int. J. Rock Mech. Min., 41(3) 623– 628, 2004.
Url-1: PEER (Pacific Earthquake Engineering Research Centre): http://peer.berkeley.edu/smcat/search.html, 10 April 2011. USACE: United States Army Corps of Engineers, Time-History
Dynamic Analysis of Concrete Hydraulic Structures, Engineer-ing and Design, 2003.
Westergaard, H. M.: Water Pressures on Dams during Earthquakes, Transactions, ASCE, 98, 418–433, 1933.
Wilson, E. L. and Khalvati, M.: Finite Elements for the Dynamic Analysis of Fluid-Solid Systems, Int. J. Num. Meth. Eng., 19, 1657–1668, 1983.