www.nat-hazards-earth-syst-sci.net/9/2135/2009/ © Author(s) 2009. This work is distributed under the Creative Commons Attribution 3.0 License.
and Earth
System Sciences
On the statistical relationship between cloud optical and
microphysical characteristics and rainfall intensity for convective
storms over the Mediterranean
E. Cattani, F. Torricella, S. Laviola, and V. Levizzani
Institute of Atmospheric Sciences and Climate, National Research Council, ISAC-CNR, Bologna, Italy
Received: 1 April 2009 – Revised: 10 December 2009 – Accepted: 10 December 2009 – Published: 23 December 2009
Abstract. The relationship between the multi-spectral cloud field characterization from the Advanced Very High Res-olution Radiometer (AVHRR) and the rainfall intensities from the Advanced Microwave Sounding Unit-module B (AMSU-B) data were studied for a convective storm event, which occurred during the first 15 days of June 2007 over the Mediterranean. The cloud products exploited in this analy-sis, cloud mask, type, optical thickness, and effective radius, are obtained from the NOAA-NESDIS operational process-ing system Clouds from the AVHRR-Extended algorithm (CLAVR-x), whereas the rain intensity values are retrieved from the AMSU-B brightness temperatures via a fast algo-rithm, using opaque frequencies (centred at 183 GHz) to cor-rect for the presence of water vapour affecting the retrieval results. The algorithm is conceived to discriminate between convective and stratiform rain using a suitable set of thresh-olds; the retrieval is subsequently carried out separately for the two types.
A test for the discrimination of precipitating from non-precipitating areas was based on the comparison between the precipitation information and the retrieved cloud param-eters. The test produced a cloud optical thickness threshold value, beyond which the precipitation initiates, and an ef-fective radius range for the identification of the precipitating clouds. The results stemming from the application of the test to the June 2007 case study are very encouraging, although still preliminary and restricted to the analyzed Mediterranean storms. In particular, the test shows high potential for delin-eating non-precipitating areas (more than 90% of success-ful cases for every considered cloud type) and to identify precipitating ice clouds related to convective rain (confirmed by 82% of hits). On the other hand, the relative inability to address the stratiform cloud systems is proved by the fact
Correspondence to: E. Cattani ([email protected])
that the majority of the missed cases, for each cloud types, is characterized by light rain intensities (≤3 mm h−1).
1 Introduction
Given the obvious strong links between cloud microphys-ical properties and precipitation, a more unified approach to observing cloud properties is necessary in order to im-prove the performances of the satellite retrieval algorithms and our knowledge of clouds and precipitation processes (e.g., Stephens and Kummerow, 2007). Recent studies have demonstrated the effectiveness of such an approach. Nauss et al. (2008) showed the effectiveness of the use of cloud prop-erties derived from optical satellite data for the delineation of precipitation areas. Likewise, precipitation indices from vis-ible, near infrared and infrared (VIS, NIR, IR) spectral fea-tures, tuned by means of co-located ground measurements of rain intensity (gathered from gauge or radar networks), showed a high correlation with precipitation and thus were used to derive precipitation likelihood (Thoss et al., 2001).
2136 E. Cattani et al.: Statistical relationship for convective storms over the Mediterranean
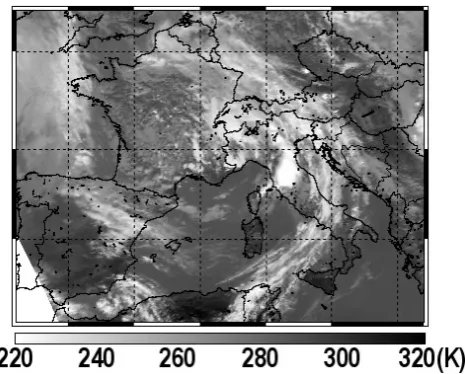
Fig. 1. 1 June 2007, 10:54 UTC. AVHRR (NOAA-18) brightness
temperatures at 10.8 µm over the selected area.
In this work the same methodology was applied to the 1– 15 June 2007 case study, exploiting the cloud products from the Advanced Very High Resolution Radiometer (AVHRR) and the rain intensities retrieved from the Advanced Mi-crowave Sounding Unit-module B (AMSU-B), to further in-vestigate the statistical relationships between the cloud pa-rameters and the rain intensity field.
2 The case study
The study is focused over the western Mediterranean basin, Italy, and Central Europe (35◦–52◦N and 9◦W–22◦E, see Fig. 1) for the first 15 days of June 2007. In this period, a very unstable weather characterized the whole region, par-ticularly Italy. The most severe events took place during the first 10 days of the month, when a low-pressure system lo-cated over central-South Europe associated with cold air at high levels, fostered heavy thunderstorms and downpours on the 1st and 2nd. On 7 June and, again, on 11th and 13th, the thunderstorms over the Italian peninsula intensified, with very high cumulated precipitation values and a strong light-ning activity.
3 Instruments and data
The characterization of the cloudy scenarios was carried out by means of AVHRR cloud products of the Clouds from the AVHRR-Extended algorithm (CLAVR-x) at a spatial resolu-tion of 4×4 km2. The CLAVR-x is the operational process-ing system of the National Oceanic and Atmospheric Admin-istration (NOAA) National Environmental Satellites, Data and Information Service (NESDIS) for detecting clouds from
AVHRR data and to derive the corresponding cloud proper-ties (Heidinger, 2003; Pavolonis et al., 2005; for further de-tails see also http://cimiss.ssec.wisc.edu/clavr). The cloudy pixels were selected using the cloud mask product, which re-ports 4 levels of probability (clear, probably clear, probably cloudy, and cloudy), whereas the cloud type product with the six cloud categories, fog, water, supercooled water, opaque ice, cirrus and multi-layer cloud, was exploited to pinpoint the cloud thermodynamic phase. The cloud optical thickness and effective radius products were utilized to complete the cloud characterization.
The rain intensities from the AMSU-B data were com-puted using the 183-WSL algorithm developed at ISAC-CNR (Laviola and Levizzani, 2008a, b). The rain rate inten-sities are inferred exploiting the perturbation induced by the rain drops onto the strong water vapour absorption band cen-tred at 183.31 GHz. Since the 183.31 GHz band is strongly dependent on the temperature and humidity profiles, a series of thresholds were computed in order to remove the areas characterized by the absorption of condensed water vapour and those interested by the scattering of snow, which could be erroneously classified as rain. The algorithm was also conceived to discriminate between convective and stratiform rain using a suitable set of thresholds. The spatial ground resolution of the derived rain product is 16×16 km2.
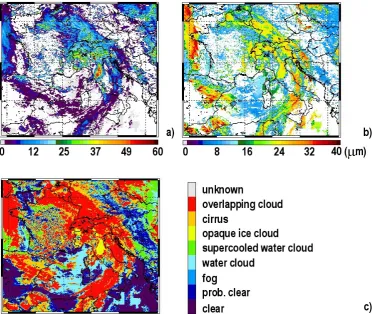
For the present analysis the data from the AVHRR and AMSU-B sensors on board the NOAA-18 platform were ex-ploited, thus ensuring simultaneous and co-located observa-tions of the scenarios. Figure 2 shows an example of the AVHRR cloud products on 1 June 2007, 10:54 UTC. The rain intensity map retrieved by the 183-WSL algorithm for the same NOAA-18 overpass of Fig. 2 is presented in Fig. 3.
4 Statistical analysis
Fig. 2. 1 June 2007, 10:54 UTC. AVHRR cloud products used in the statistical analysis: (a)τ, (b)Re, and (c) cloud type.
Due to the different spatial resolution of the AVHRR and AMSU-B derived products, all the data were re-projected over a common 0.1◦×0.1◦ regular lat-lon grid, in order to establish the relationships between cloud parameters and rain intensity data. On average one AMSU-B and about 4 AVHRR pixels fell in each grid cell. Table 2 reports the statistics relative to the re-projected data. The percentages listed in the second column of Table 2 (except for the “rainy but clear” and the “cloudy” categories that refer to the total number of grid cells) are computed with respect to the num-ber of cloudy grid cells. The numnum-ber of the rainy grid cells and the corresponding percentages computed with respect to each subset of cloudy grid cells are reported in Table 2 as well. A grid cell was defined cloudy in the case where 70% of the AVHRR pixels falling within that grid cell were classi-fied by the AVHRR cloud mask as cloudy. The same thresh-old (70%) was applied to identify the other categories, i.e. cloudy grid cells over the sea, land, coast, covered by water, ice or overlapping clouds.
Clouds over land have the highest number of occurrences (59% of the total number of cloudy cells) also owing to the much higher number of land cells in the analysed region. They are also the most raining (19.7% of clouds over land are raining against 2.9% over the sea). Ice clouds show the great-est percentage of raining grid cells, whereas only a very low
Table 1. Number of observations (pixels) of the two instruments
during the analysis period (1–15 June 2007). The data reported in the table are derived from the AVHRR CLAVR-x cloud products and the 183-WSL rain algorithm applied to AMSU-B data.
# pixels
AVHRR 899 827
cloudy 543 248
ice clouds 72 856 water clouds 207 717 overlapping clouds 262 675 over the sea 192 617 over the land 328 881 over the coast 21 750
AMSU-B 183 147
rainy 12 212
2138 E. Cattani et al.: Statistical relationship for convective storms over the Mediterranean
Fig. 3. 1 June 2007, 10:54 UTC. Rain intensity retrieved by the
183-WSL algorithm applied to AMSU-B brightness temperatures.
5 Results
The gridded data presented in the previous section were used to evaluate the possible relationships between rain intensity andτ andRe.
In Fig. 4a–b the scatter plots of rain intensity against cloud optical thickness are shown for a) the ice cloud grid cells and b) for the overlapping clouds. The green symbols re-fer to the cloudy grid cells over land, whereas blue sym-bols represent those over the sea. The solid lines connect-ing the diamond symbols represent the 75th, 50th, and 25th percentiles. A positive correlation between rain intensity and optical thickness in the variability range of the data (τ≤60 and RI≤20 mm h−1) is evident from the scatter plots. The binned analysis presented in Fig. 4c–d makes the relationship between rain intensity and optical thickness further stand out. This analysis was carried out by binning all rain data in 1 mm h−1 intervals and then averaging the correspond-ingτ values. With this kind of data visualization the rela-tionship between rain intensities and τ is much more vis-ible. Moreover, a threshold value ofτ∼15 beyond which precipitation is initiated, is evident as well. The agreement with the analogous plot for ice clouds of Fig. 2b reported by Torricella et al. (2008) is good, except for the optical thick-ness threshold value (∼40). This discrepancy is due to the fact that MODIS cloud optical thickness values are generally higher than those retrieved from AVHRR data: the mean op-tical thickness value from MODIS data is 25.11 against 9.38 for the AVHRR, whereas when selecting only precipitating cloudy grid cells the MODIS meanτ is 54.23, whereas for the AVHRR is about 20.
Table 2. Statistics of the analyzed grid cells for the whole study period. The percentages reported in the second column are computed with respect to the number of cloudy grid cells, with the exception of the “rainy but clear” and the “cloudy” categories that refer to the total number of the grid cells. The percentages of the rainy grid cells are relative to each subset of cloudy grid cells.
# grid % # rainy % rainy
cells grid grid
cells cells
total 1 975 428 100
rainy but clear 570 0.03
cloudy 89 475 4.5 11 642 13.01
over the sea 33 031 37 948 2.9
over the land 52 946 59 10 448 19.7 coast contam.
(discarded) 3498 3.9
water clouds 23 435 26.2 187 0.8
ice clouds 4991 5.6 1387 27.8
overlapping clouds 31 904 35.7 7151 22.4
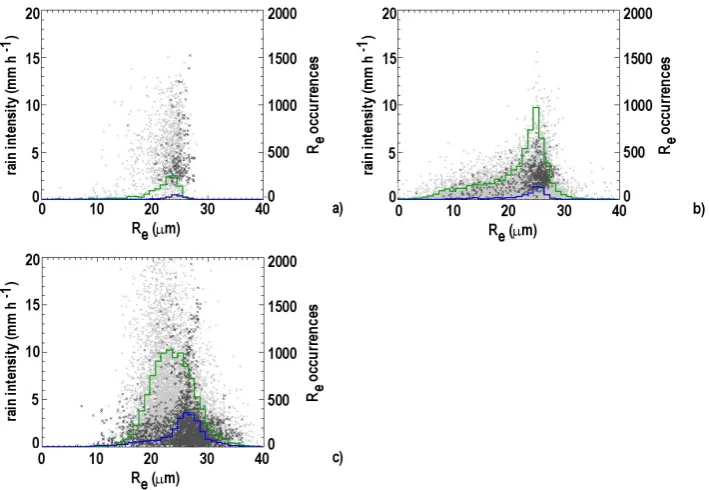
The relationship between the rain intensities and the cor-respondingRevalues is investigated in Fig. 5a–c, where the scatter plots for the AVHRR and AMSU-B data sets (Fig. 5a and b for ice clouds and overlapping clouds, respectively), and for ice clouds examined with the MODIS and AMSR-E data according to Torricella et al. (2008) (Fig. 5c) are shown. From these scatter plots it is evident that the AMSR-E de-rived rain intensities reach values much higher than the cor-responding AMSU-B retrieved intensities. The scatter plots and the over-plottedRehistograms show very similar trends regardless of the cloud type: the majority of the occurrences are accumulated in theRerange between 20 and 30 µm, with which also the higher rain intensities (RI≥5 mm h−1) are mainly associated. No analogous scatter plots for the wa-ter clouds are displayed due to the scarce number of raining water cloud grid cells, which are by no means enough for a meaningful statistic.
Thus a possible method to identify potentially precipitat-ing cloudy pixels stems from the analysis of the relation-ships betweenτ,Re and rain intensities: when retrieving a
Revalue between 20 and 30 µm and aτvalue greater than 15 (or 40 in case of MODIS cloud parameter data set) the pixel can be safely considered as raining.
Fig. 4. Rain intensity as a function of cloud optical depth for ice cloud grid cells (a) and overlapping cloud grid cells (b). Cloudy grid
cells over land and sea correspond to the green and blue symbols, respectively. Solid lines in (a) and (b) represent the 75th, 50th, and 25th percentiles. In (c) and (d) the results of the binned analysis are shown, carried out by binning all rain data in intervals of 1 mm h−1and then averaging the correspondingτvalues.
2140 E. Cattani et al.: Statistical relationship for convective storms over the Mediterranean
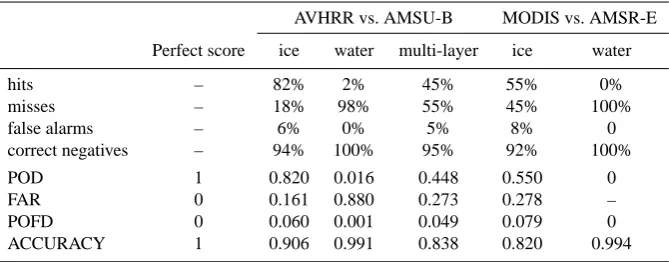
Table 3. Performances of theτandRetest: statistical parameters for the two data sets, AVHRR vs. AMSU-B and MODIS vs. AMSR-E and for the different cloud categories.
AVHRR vs. AMSU-B MODIS vs. AMSR-E
Perfect score ice water multi-layer ice water
hits – 82% 2% 45% 55% 0%
misses – 18% 98% 55% 45% 100%
false alarms – 6% 0% 5% 8% 0
correct negatives – 94% 100% 95% 92% 100%
POD 1 0.820 0.016 0.448 0.550 0
FAR 0 0.161 0.880 0.273 0.278 –
POFD 0 0.060 0.001 0.049 0.079 0
ACCURACY 1 0.906 0.991 0.838 0.820 0.994
b,c, andd computed for the two data sets according to the definition given by Ebert (2005):
a= hits rain (τ≥τthres.andRe∈[20, 30] µm)/
rain (RI>0.1 mm h−1)
b= misses no rain (τ <τthres.orRe∈/[20, 30] µm)/ rain (RI>0.1 mm h−1)
c= false alarms rain (τ≥τthres.andRe∈[20, 30] µm)/ no rain (RI≤0.1 mm h−1)
d= correct negatives no rain (τ <τthres.orRe∈/[20, 30] µm)/
no rain (RI≤0.1 mm h−1).
From the combinations of these four elements the following statistical parameters were computed:
POD (probability of detection) =a/ (a+b) FAR (false alarm rate) =c/(a+c) POFD (probability of false detection) =c/(d+c) ACCURACY (fraction correct) = (a+d)/N,
whereN=a+b+c+d.
The test demonstrates to be particularly effective in iden-tifying the non-precipitating clouds. As shown by the percentages of correct negatives, more than 90% of non-precipitating cloudy grid cells (RI≤0.1 mm h−1) for each cloud category do not satisfy the τ and Re test and are correctly classified as non-precipitating. Conversely, the effectiveness of the test in delineating the precipitating areas, represented by the hit percentages in Table 3, depends on the cloud type. A positive result is obtained for the AVHRR-AMSU-B ice precipitating clouds with 82% of success and 18% (250 grid cells out of 1387, the total number of the ice grid cells with RI>0.1 mm h−1) erroneously classified as non-precipitating on the basis of the test response. It is noteworthy that 52% of these misclassified grid cells are associated with rain intensities not greater than 3 mm h−1 and 79% are classified as stratiform by the 183-WSL rain algorithm. The good performances of theτ andRe test in
discriminating between ice precipitating or non-precipitating clouds are summarized by the categorical statistics reported in Table 3; high values of POD and ACCURACY (0.820 and 0.906, respectively), and low values of FAR and POFD (0.161 and 0.060). For the overlapping clouds the percentage of the test success is greatly decreased (45% of hits against 82% for the ice clouds), but as before the majority of the precipitating overlapping clouds missed by the test are associated with light rain and identified as stratiform by the rain retrieval (3097 out of 3920 grid cells do not satisfy the test). Note that the test succeeded, as demonstrated by the high ACCURACY value (0.838), even in this case of multi-layered clouds, which represents the most challenging situation due to the fact that precipitation could be not necessarily connected to the higher cloud layer, for which theτ andRevalues are retrieved from satellite (in particular
Re). Theτ andRetest was applied also to the water clouds despite of the scarce number of these grid cell type: almost all water clouds were not identified as precipitating from the microphysical point of view (missed events are 98%), but they are characterized by RI≤3 mm h−1 and classified as stratiform by the rain retrieval algorithm. It is important to note that in this case the very high value of the ACCURACY (0.991) is due only to the test effectiveness in classifying the non-precipitating water clouds (100% of correct negatives).
6 Conclusions
The links between the cloud characteristics and precipita-tion for convective storms occurred over the Mediterranean in June 2007 were studied by exploiting the cloud products from the AVHRR and the rain intensities retrieved from the AMSU-B, both onboard the NOAA-18 platform. The same case study was analysed in a previous work (Torricella et al., 2008), using the MODIS and AMSR-E data.
A test for the discrimination of the precipitating from the non-precipitating clouds was presented, inferred by the syn-ergistic analysis of the cloud characteristics and the corre-sponding rain intensity values. It is based on the results obtained from the analysis of the RI versusτ andRe scat-ter plots andRe histograms for precipitating clouds, where a clear positive correlation betweenτ and the precipitation intensity is revealed, with a cloud optical thickness thresh-old value (∼15) for the precipitation startup, and the ma-jority of precipitating clouds showingRe values in the [20, 30] µm range, which correspond to the heaviest precipitation with RI values up to 15 mm h−1. Analogous results were ob-tained from the analysis of the MODIS-AMSR-E data set, with the only difference of aτ threshold value of 40. The test showed an appreciable capability of detecting precipi-tating clouds connected to convective processes and signif-icant rain intensity values (RI≥5 mm h−1), but it is com-pletely unable to identify stratiform cloud systems producing light rain (RI≤3 mm h−1), as for the emblematic case of the water clouds. Moreover, the applicability of this methodol-ogy to delineate the precipitating areas is to be considered restricted to this particular case study. Future work will be addressed to assess the test performances for further case studies, in order to refine the capability to identify precipi-tating convective cloud systems and to develop a strategy for identifying stratiform and water clouds connected to warm rain processes. Particularly for this cloud type, the evaluation of the relationships between cloud parameters and rain in-tensity will require the analysis of other case studies, mainly in tropical regions, where the number of precipitating water clouds is large enough to establish a meaningful statistic.
Furthermore the completion of this kind of analysis will require to take into account the uncertainties of the exploited cloud and precipitation data sets, associated with the partic-ular retrieval algorithm and measurement errors, and case study characteristics. The impact of these uncertainties on the analysis results is evident also in this June 2007 case study, where, for example, the τ threshold value for the precipitation startup is dependent on the particular data set used. As specified in Sect. 5, MODISτ values are generally greater than those retrieved from the AVHRR data, and more-over a higher number of occurrences with RI>15 mm h−1are present in the AMSR-E data with respect to the RI data set retrieved by the 183-WSL algorithm from AMSU-B bright-ness temperatures, as it is evident in Fig. 5. As customary in satellite derived products disseminated by operational
agen-cies or research groups, the most useful and predictive in-dicator of the reliability of output physical quantities values can be found in a suite of quality flags, describing the de-gree of the reliability of the retrieval for each observation or group of observations. In processing AVHRR, AMSR-E, and MODIS products we selected only those data hav-ing the highest degree of reliability accordhav-ing to the adopted retrieval schemes. However none of them encloses an er-ror estimation on the output physical quantities, and this can be easily understood being the accuracy of the retrieval re-sult associated with the overall status of the atmospheric col-umn, largely unknown, and the results of validation cam-paigns only generically correlated with single retrieval val-ues. There is an obvious necessity to account for the retrieval uncertainties in the statistical analysis, but there is also an in-herent difficulty, or the impossibility as in this case, of find-ing cloud products and precipitation retrieval error (or error estimates). Only multi-instrument intensive measurements campaigns can supply the needed amount of data and ancil-lary observations describing the true state of the atmosphere. The validation of satellite cloud and precipitation retrieval algorithms is a very complex and still in progress activity, which requires dedicated airborne and in situ measurements to obtain the cloudy scenario characterization as well as re-liable networks of rain gauges and radar to provide indepen-dent rainfall measurements. An exhaustive summary about the recent validation activities of several satellite precipita-tion products can be extracted from Ebert et al. (2007) and Turk et al. (2009), whereas examples of performance evalu-ation of cloud retrieval algorithms can be found in Nauss et al. (2005) and Ham et al. (2009).
Acknowledgements. The authors are grateful to W. Straka III,
A. Heidinger and G. Vicente from NOAA-NESDIS for kindly providing the AVHRR cloud products from the CLAVR-x al-gorithm. Support is gratefully acknowledged from the projects
AEROCLOUDS of the Italian Ministry of Education, University
and Scientific Research (MIUR), Progetto Strategico “Nowcasting
avanzato con l’uso di tecnologie GRID e GIS” of Regione Puglia,
and EUMETSAT’s Satellite Application Facility on Support to
Operational Hydrology and Water Management (H-SAF).
Edited by: S. Michaelides, K. Savvidou, and F. Tymvios Reviewed by: two anonymous referees
References
Ebert, E. E., Janowiak, J. E., and Kidd, C.: Comparison of near-real-time precipitation estimates from satellite observations and numerical models, B. Am. Meteorol. Soc., 88, 47–64, 2007. Ebert, E. E.: WWRP/WGNE Joint Working Group on
2142 E. Cattani et al.: Statistical relationship for convective storms over the Mediterranean
Ham, S.-H., Sohn, B.-J., Yang, P., and Baum, B. A.: Assessment of the quality of MODIS cloud products from radiance simulations, J. Appl. Meteorol. Clim., 48, 1591–1612, 2009.
Heidinger, A. K.: Rapid daytime estimation of cloud properties over a large area from radiance distributions, J. Atmos. Ocean. Tech., 20, 1237–1250, 2003.
Laviola, S. and Levizzani, V.: Rain retrieval using the 183 GHz ab-sorption lines, in: IEEE Proc. MicroRad, 10th Specialist Meet-ing Radiometry and Remote SensMeet-ing of Environment, Firenze, doi:10.1109/MICRAD.2008.4579505, 11–14 March 2008a. Laviola, S. and Levizzani, V.: Observing precipitation with
AMSU-B opaque channels: the 183-WSL algorithm, 4th IPWG Workshop, Beijing, 13–17 October 2008b.
Nauss, T., Thies, B., Turek, A., Bendix, J., and Kokhanovsky, A.: Operational discrimination of raining from non-raining clouds in mid-latitudes using multispectral satellite data, in: Precipitation: Advances in measurement, estimation and prediction, edited by: Michaelides, S., Springer, 171–194, 2008.
Nauss, T., Kokhanovsky, A. A., Nakjima, T. Y., Reudenbach, C., and Bendix, J.: The intercomparison of selected cloud retrieval algorithms, Atmos. Res., 78, 46–78, 2005.
Pavolonis, M. J., Heidinger, A. K., and Uttal, T.: Daytime global cloud typing from AVHRR and VIIRS: Algorithm description, validation, and comparisons, J. Appl. Meteorol., 44, 804–826, 2005.
Stephens, G. L. and Kummerow, C. D.: The remote sensing of clouds and precipitation from space: A review, J. Atmos. Sci., 64, 3742–3765, 2007.
Thoss, A., Dybbroe, A., and Bennartz, R.: The Nowcasting SAF Precipitating Clouds Products, Proccedings of the 2001 EUMET-SAT Satellite Data User’s Conference, Antalya, Turkey, 1–5 Oc-tober 2001.
Torricella, F., Cattani, E., and Levizzani, V.: Rain area delineation by means of multispectral cloud characterization from satellite, Adv. Geosci., 17, 43–47, 2008,
http://www.adv-geosci.net/17/43/2008/.