1
Effect of haunch on the stresses of box culvert
Osama S. Hussien
1, 21
Associate Professor, Civil Engineering Dept., Northern Border University, K.S.A.
2
On leave from Civil Engineering Dept., Al-Azhar University, Cairo, Egypt
Email: [email protected], [email protected]
Tel: +966540242418
Abstract
Culverts are often required under earth embankment to allow for the crossing of a watercourse, like streams, to prevent the road embankment from obstructing the natural waterway. The opening of the culvert is determined based on the waterway required to accommodate the design flood, whereas the thickness of the culvert section is designed based on the loads applied to the culvert. This paper studies some design parameters of box culverts, such as the thickness of the haunch, the coefficient of earth pressure, the thickness of box culvert, and depth of fill on the top slab, to show the effect of haunch on the stresses of the box culvert. The study investigated the variation in stresses and the cost comparison made for different width of the box culvert. The percentage reduction in the cost of culvert based on the presence of haunch is presented.
Keywords:
Box culverts; Haunch; Cushion; Earth pressure; Surcharge loading; Breadth of the culvert.
Introduction
Culverts can be of different shapes such as arch, slab, and box. They are constructed of brick, stone, or reinforced concrete. Reinforced concrete box culvert consists of top slab, bottom slab and vertical walls built monolithically to form a closed rectangular or square single or multiple cells. Box culverts may be either an inverted U on a concrete base foundation (crown unit) or a U-shaped trough with a lid (inverter unit). By using one or more intermediate vertical wall, multiple cell box culverts are formed.
Vent size of the culvert is determined based on flood discharge from the upstream side. Since culvert passes through the earth embankment, it is subjected to the same traffic loads as the road and therefore designed for such loads. The major reason box culverts are favored for this type of construction is that they are a cost-effective means of construction, yielding the desired useful lifespan with minimal maintenance. Box culverts can be installed quickly reducing the road closure time required for replacement of a bridge.
The analysis of box culvert is based on a set of loading conditions, which the component must withstand. These loads may vary depending on the direction of action, type of deformation, and nature of the structural action. They may be vertical uniform distributed load, the weight of sidewalls, and lateral earth pressure on vertical sidewalls.
2
Literature review:
B.N. Sinha and R.P. Sharma (2009) provided a full discussion on the provisions in the Codes, considerations, and justification of the aspects of design. The study concluded that the box for cross drainage works across high embankments has many advantages compared to a slab culvert.
H. Maximos, et al., (2010) summarized the experimental program to evaluate the fatigue effects on reinforced concrete (RC) box culverts and the resulting recommendations that were made to the (AASHTO). Test results show a good distribution of the load resistance between the two reinforcement directions in box culvert sections.
S. Shreedhar and R Shreedhar (2013) evaluated design coefficients for bending moment, shear force and normal thrust for various loading cases for different ratios of L/H = 1.0, 1.25, 1.5, 1.75 and 2.0 for three cell box culvert. This study concluded that the critical sections considered are the span center of the top and bottom slabs and support sections and at the center of the vertical walls.
L. A. Chandrakant and P. V. Malgonda (2014) developed an excel program for analysis and it is compared with software results. This study concluded that the case of loading that yields the maximum moment is when box culvert is empty, with live load surcharge on the top slab of the box and superimposed surcharge load on earth fill.
M.G. Kalyanshetti and S.A. Gosavi (2014) analyzed 12 m channel length with 2m to 6m height variation, which is divided into a single cell, double cell, and triple cell. The analysis was done by using the stiffness matrix method and a computer program in C language developed for the cost evaluation. The study carried out related to variation in bending moment; subsequently, a cost comparison was made for different aspect ratios.
N. Kolate, et al. (2014) studied some design parameters of box culverts like the angle of dispersion, the effect of earth pressure and depth of cushion provided on the top slab of box culverts. This study concluded that the box without cushion having low design moments and shear stress as compared to the box having the cushion.
K. K. Sahu and S. Sharma (2015) compared the cost with and without considering the optimum thicknesses. An attempt is made to generate charts of bending moments for the top and bottom slabs, such that from these charts the values of bending moments can be evaluated at any intermediate aspect ratio.
Y. V. Kumar and C. Srinivas (2015) found out stresses such as bending moment and shear force of the structure under railway loading and these stresses computed by computational methods as well as conventional methods. They concluded that the finite element method gives the less value of stresses than grillage and the conventional method.
3
load combination with empty box found to be the critical combination of all values of aspect ratios under consideration.
S. R. Krishna and Ch. H. Rao (2017) identified the behavior of box culvert with and without the interaction of soil. This study concluded that the bending moment values of the top slab increased by 19% without soil interaction condition when compared to soil interaction.
Saurav and I. Pandey (2017) presented a comparative study of the analysis of the conventional method using STAAD software and FEM using ANSYS software. The study concluded that the culvert design through finite element method would not only save material and money but also make the design safer.
A. R. Polra, et al. (2017), presented a review on the analysis and cost-comparison of box culvert for the different aspect ratio of the cell. They concluded that greater stresses are found in box culvert structures without cushion, compare to box culvert with cushion. Besides, if the angle of dispersion is 0°, the intensity of the live load is maximum.
Research Significance
From the previous literature review, it is noted that the effect of haunch on the stresses of the culvert was not studied. Therefore, this research focuses on the impact of using haunches on the economy of the culvert design.
Analysis Section
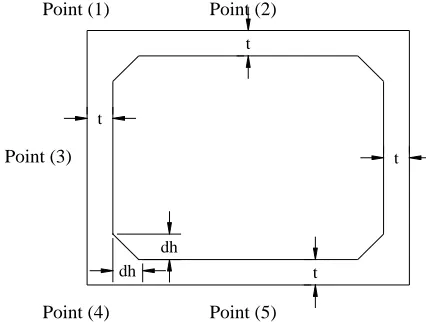
The box culvert under consideration is shown in Fig. (1). It is studied by using (SAP2000) program to calculate the stresses and to explain the elastic behavior of a box culvert under variable loads, by changing some parameters such as width (B) and thickness (t) of the culvert, and the dimensions of the haunch, (dh).
The earth pressure on vertical sidewalls of the box culvert is computed according to the Coulomb’s Theory. The earth pressure intensity is given by P=Ki ρ H, where Ki is a coefficient of active earth pressure, ρ is the density of soil and H is the vertical height of the box. The earth can exert pressure on the sidewall, minimum as active and maximum as passive, or in between (called at-rest pressure). The value of Ki depends on the site condition. If the structure was constructed before the backfilling of earth, the coefficient of earth pressure should be taken at rest. In such a situation, the value of the coefficient of earth pressure shall be more than the active condition. The coefficient of earth pressure in case of box culvert is taken as 0.333 for soil having φ=30°. The density of soil is 1.8 t/m3, the unit weight of concrete is 2.5 t/m3, the cushion is 50 cm, and the live load is 0.4 t/m2.
4
Fig. (1) Points of calculating stresses
Result
To assess the impact of introducing haunches for the culvert, the normal stresses are computed, using finite element analysis. The stresses in the horizontal direction (S11) and in the vertical direction (S22) are computed and compared for each configuration.
1- Case b = 6m
Fig. (2a) S11 at point (1) for case b=6m Fig. (2b) S11 at point (2) for case b=6m
Fig. (2c) S11 at point (3) for case b=6m Fig. (2d) S11 at point (4) for case b=6m Point (1) Point (2)
Point (3)
Point (4) Point (5) t
dh dh
t
t
t
0 10 20 30 40 50 60 70 80
0.4 0.45 0.5 0.55 0.6
S
11
Thickness of Culvert Point (1)
dh = 0 dh = 0.4 dh = 0.45 dh = 0.5
-200 -150 -100 -50 0
0.4 0.45 0.5 0.55 0.6
S
1
1
Thickness of Culvert
Point (2)
dh = 0
dh = 0.4
dh = 0.45
dh = 0.5
-2.9 -2.8 -2.7 -2.6 -2.5 -2.4 -2.3
0.4 0.45 0.5 0.55 0.6
S
11
Thickness of Culvert Point (3)
dh = 0 dh = 0.4 dh = 0.45 dh = 0.5
0 20 40
60
80 100
0.4 0.45 0.5 0.55 0.6
S
11
Thickness of Culvert Point ( )
5
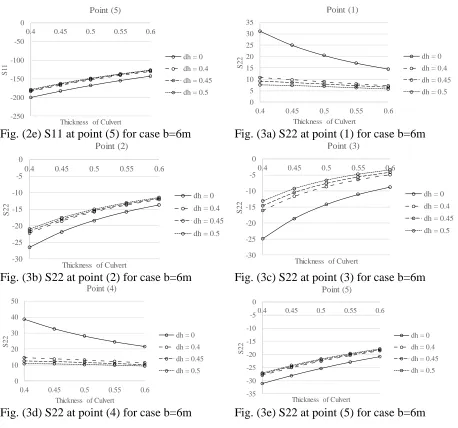
Fig. (2e) S11 at point (5) for case b=6m Fig. (3a) S22 at point (1) for case b=6m
Fig. (3b) S22 at point (2) for case b=6m Fig. (3c) S22 at point (3) for case b=6m
Fig. (3d) S22 at point (4) for case b=6m Fig. (3e) S22 at point (5) for case b=6m
Table (1) Ratio between stress S11 without haunch and with 40 cm haunch for b=6m
Table (2) Ratio between stress S22 without haunch and with 40 cm haunch for b=6m
-250 -200 -150 -100 -50 0
0.4 0.45 0.5 0.55 0.6
S
11
Thickness of Culvert Point ( )
dh = 0 dh = 0.4 dh = 0.45 dh = 0.5
0 5 10 15 20 25 30 35
0.4 0.45 0.5 0.55 0.6
S
22
Thickness of Culvert Point ( )
dh = 0 dh = 0.4 dh = 0.45 dh = 0.5
-30 -25 -20 -15 -10 -5 0
0.4 0.45 0.5 0.55 0.6
S
22
Thickness of Culvert Point (2)
dh = 0 dh = 0.4 dh = 0.45 dh = 0.5
-30 -25 -20 -15 -10 -5 0
0.4 0.45 0.5 0.55 0.6
S
22
Thickness of Culvert Point (3)
dh = 0 dh = 0.4 dh = 0.45 dh = 0.5
0 10 20 30 40 50
0.4 0.45 0.5 0.55 0.6
S
22
Thickness of Culvert Point (4)
dh = 0 dh = 0.4 dh = 0.45 dh = 0.5
-35 -30 -25 -20 -15 -10 -5 0
0.4 0.45 0.5 0.55 0.6
S
22
Thickness of Culvert
Point (5)
dh = 0
dh = 0.4
dh = 0.45
dh = 0.5
S11 t = 0.4 t = 0.45 t = 0.5 t = 0.55 t = 0.6 Point (1) 75.06% 70.90% 67.50% 64.68% 62.39% Point (2) 15.74% 14.53% 13.50% 12.61% 11.82% Point (3) -18.88% -16.43% -14.26% -12.75% -11.67% Point (4) 81.88% 79.09% 77.28% 76.32% 76.18% Point (5) 8.03% 8.66% 8.93% 8.99% 8.93%
6
Table (3) % difference for an amount of concrete for cases with and without haunch for b=6m
Figs. (2a-2e) show the relationship between the thickness of culvert and dimensions of haunch for S11 at points 1, 2, 3, 4, and 5. When the thickness of culvert increases by 12.5% of the original culvert thickness, the stress S11 decreases by an average 9.99% at the point (1) 13.22% at the point (2), 0.38% at the point (3), 10.44% at the point (4), and 8.25% at the point (5). All these values are computed for dimensions of haunch varies from 0 cm to 50 cm.
When the dimensions of haunch increases by 12.5% of the original culvert thickness, the stress S11 decreases by an average of 19.95% at the point (1) 2.32% at the point (2), 0.37% at the point (3), 34.93% at the point (4), and 1.4% at the point (5). All these values are computed for the thickness of culvert varies from 40 cm to 60 cm.
Figs. (3a-3e) show the relationship between the thickness of culvert and dimensions of haunch for S22 at points 1, 2, 3, 4, and 5. When the thickness of culvert increases by 12.5% of the original culvert thickness, the stress S22 decreases by an average of 10.39% at the point (1) 14.3% at the point (2), 26.02% at the point (3), 7.88% at the point (4), and 9.8% at the point (5). All these values are computed for dimensions of haunch varies from 0 cm to 50 cm.
When the dimensions of haunch increases by 12.5% of the original culvert thickness, the S22 decreases by an average 12.82% at the point (1), 2.46% at the point (2), 12.23% at the point (3), 11.14% at the point (4), and 1.79% at the point (5). All these values are computed for the thickness of culvert varies from 40 cm to 60 cm.
From Table (1), we can find that introducing a 40 cm haunch decreases the values of S11 by an average 68.11% for point (1) and 78.15% for point (4), while the average reduction is 13.64% for point, (2) and 8.71% for point (5).
From Table (2), we can find that the effect of 40 cm haunch decreases the values of S22 by an average 56.98% for point (1) and 54.38% for point (4), while the average reduction is 14.19% for point, (2) and 10.77% for point (5).
From Table (3), we can find that the maximum difference in concrete quantities is 3.36% between case without hunch and case with the 50cm hunch.
7
2- Case b = 5.5 m
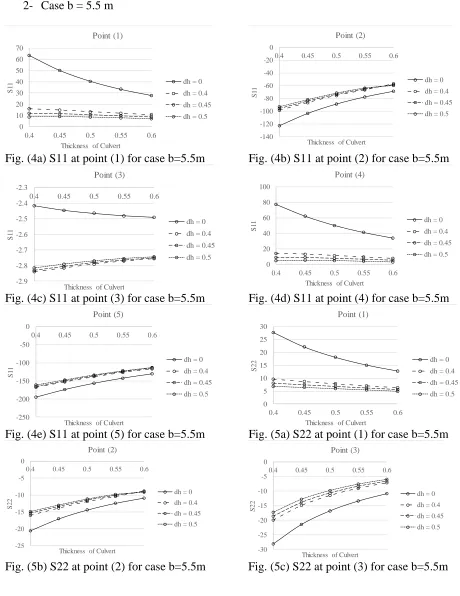
Fig. (4a) S11 at point (1) for case b=5.5m Fig. (4b) S11 at point (2) for case b=5.5m
Fig. (4c) S11 at point (3) for case b=5.5m Fig. (4d) S11 at point (4) for case b=5.5m
Fig. (4e) S11 at point (5) for case b=5.5m Fig. (5a) S22 at point (1) for case b=5.5m
Fig. (5b) S22 at point (2) for case b=5.5m Fig. (5c) S22 at point (3) for case b=5.5m 0 10 20 30 40 50 60 70
0.4 0.45 0.5 0.55 0.6
S
11
Thickness of Culvert
Point ( )
dh = 0
dh = 0.4
dh = 0.45
dh = 0.5
-140 -120 -100 -80 -60 -40 -20 0
0.4 0.45 0.5 0.55 0.6
S
11
Thickness of Culvert
Point (2)
dh = 0
dh = 0.4
dh = 0.45
dh = 0.5
-2.9 -2.8 -2.7 -2.6 -2.5 -2.4 -2.3
0.4 0.45 0.5 0.55 0.6
S
11
Thickness of Culvert Point (3)
dh = 0 dh = 0.4 dh = 0.45 dh = 0.5
0 20 40 60 80 100
0.4 0.45 0.5 0.55 0.6
S
11
Thickness of Culvert
Point (4)
dh = 0
dh = 0.4
dh = 0.45
dh = 0.5
-250 -200 -150 -100 -50 0
0.4 0.45 0.5 0.55 0.6
S
11
Thickness of Culvert
Point (5)
dh = 0
dh = 0.4
dh = 0.45
dh = 0.5
0 5 10 15 20 25 30
0.4 0.45 0.5 0.55 0.6
S
22
Thickness of Culvert
Point (1)
dh = 0
dh = 0.4
dh = 0.45
dh = 0.5
-25 -20 -15 -10 -5 0
0.4 0.45 0.5 0.55 0.6
S
22
Thickness of Culvert
Point (2)
dh = 0
dh = 0.4
dh = 0.45
dh = 0.5
-30 -25 -20 -15 -10 -5 0
0.4 0.45 0.5 0.55 0.6
S
22
Thickness of Culvert
Point (3)
dh = 0
dh = 0.4
dh = 0.45
8
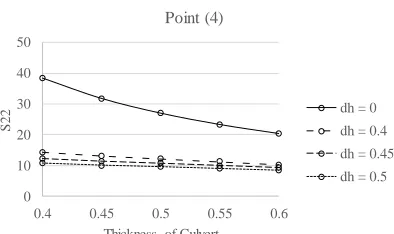
Fig. (5d) S22 at point (4) for case b=5.5m Fig. (5e) S22 at point (5) for case b=5.5m
Table (4) Difference for S11 between case without hunch and case with 40 cm hunch for case b=5.5 m
Table (5) Difference for S22 between case without hunch and case with 40 cm hunch for case b=5.5 m
Table (6) Difference for an amount of concrete between case without hunch and other cases for case b=5.5 m
Figs. (4a-4e) show the relationship between the thickness of culvert and dimensions of haunch for S11 at points 1, 2, 3, 4, and 5.
When the thickness of culvert increases by 12.5% of the original culvert thickness, the S11 decreases by an average 10.07% at the point (1) 12.2% at the point (2), 0.33% at the point (3), 12.75% at the point (4), and 8.91% at the point (5). All these values are computed for dimensions of haunch varies from 0cm to 50 cm.
When the dimensions of haunch increases by 12.5% of the original culvert thickness, the S11 decreases by an average 20.29% at the point (1), 1.65% at the point (2), 0.34% at the point (3), 36.91% at the point (4), and 1.73% at the point (5). All these values are computed for the thickness of culvert varies from 40cm to 60 cm.
Figs. (5a-5e) show the relationship between the thickness of culvert and dimensions of haunch for S22 at points 1, 2, 3, 4, and 5.
0 10 20 30 40 50
0.4 0.45 0.5 0.55 0.6
S
22
Thickness of Culvert
Point (4)
dh = 0
dh = 0.4
dh = 0.45
dh = 0.5
-35 -30 -25 -20 -15 -10 -5 0
0.4 0.45 0.5 0.55 0.6
S
22
Thickness of Culvert
Point (5)
dh = 0
dh = 0.4
dh = 0.45
dh = 0.5
S11 t = 0.4 t = 0.45 t = 0.5 t = 0.55 t = 0.6 Point (1) 75.13% 70.67% 67.31% 64.57% 62.34% Point (2) 19.72% 16.41% 15.11% 13.98% 16.70% Point (3) -17.60% -15.13% -13.18% -11.69% -10.64% Point (4) 82.18% 78.98% 77.44% 76.85% 77.21% Point (5) 14.23% 12.35% 11.86% 11.36% 10.87%
S22 t = 0.4 t = 0.45 t = 0.5 t = 0.55 t = 0.6 Point (1) 65.30% 60.79% 56.87% 53.67% 51.02% Point (2) 22.29% 18.87% 17.46% 16.18% 19.38% Point (3) 29.06% 30.27% 31.26% 32.40% 33.64% Point (4) 62.72% 58.64% 54.78% 51.59% 48.94% Point (5) 17.84% 15.70% 15.18% 14.64% 14.16%
9
When the thickness of culvert increases by 12.5% of the original culvert thickness, the S22 decreases by an average 11.08% at the point (1) 13.18% at the point (2), 22.59% at the point (3), 8.7% at the point (4), and 10.58% at the point (5). All these values are computed for dimensions of haunch varies from 0cm to 50 cm.
When the dimensions of haunch increases by 12.5% of the original culvert thickness, the S22 decreases by an average 12.87% at the point (1), 1.93% at the point (2), 7.93% at the point (3), 11.4% at the point (4), and 2.3% at the point (5). All these values are computed for the thickness of culvert varies from 40cm to 60 cm.
From Table (4), we can find that the effect of 40 cm haunch decreases the values of S11 by an average 68% for point (1) and 78.53% for point (4). While the average is 16.38% for point, (2) and 12.14% for point (5)
From Table (5), we can find that the effect of 40 cm haunch decreases the values of S22 by an average 57.53% for point (1) and 55.34% for point (4). While the average is 18.84% for point, (2) and 15.5% for point (5)
From Table (6), we can find that the maximum difference for concrete is 3.45% between case without hunch and case with the 50cm hunch
3- Case b = 5 m
Fig. (6a) S11 at point (1) for case b=5m Fig. (6b) S11 at point (2) for case b=5m
Fig. (6c) S11 at point (3) for case b=5m Fig. (6d) S11 at point (4) for case b=5m 0
10 20 30 40 50 60 70
0.4 0.45 0.5 0.55 0.6
S
11
Thickness of Culvert
Point ( )
dh = 0
dh = 0.4
dh = 0.45
dh = 0.5
-100 -80 -60 -40 -20 0
0.4 0.45 0.5 0.55 0.6
S
11
Thickness of Culvert
Point (2)
dh = 0
dh = 0.4
dh = 0.45
dh = 0.5
-2.9 -2.8 -2.7 -2.6 -2.5 -2.4
0.4 0.45 0.5 0.55 0.6
S
11
Thickness of Culvert
Point (3)
dh = 0
dh = 0.4
dh = 0.45
dh = 0.5
0 10 20 30 40 50 60 70 80
0.4 0.45 0.5 0.55 0.6
S
11
Thickness of Culvert
Point (4)
dh = 0
dh = 0.4
dh = 0.45
10
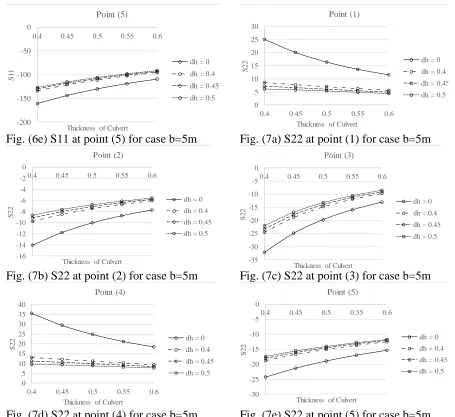
Fig. (6e) S11 at point (5) for case b=5m Fig. (7a) S22 at point (1) for case b=5m
Fig. (7b) S22 at point (2) for case b=5m Fig. (7c) S22 at point (3) for case b=5m
Fig. (7d) S22 at point (4) for case b=5m Fig. (7e) S22 at point (5) for case b=5m
Table (7) Difference for S11 between case without hunch and case with 40 cm hunch for case b=5 m
Table (8) Difference for S22 between case without hunch and case with 40 cm hunch for case b=5 m
-200 -150 -100 -50 0
0.4 0.45 0.5 0.55 0.6
S
11
Thickness of Culvert Point (5)
dh = 0 dh = 0.4 dh = 0.45 dh = 0.5
0 5 10 15 20 25 30
0.4 0.45 0.5 0.55 0.6
S
22
Thickness of Culvert
Point (1)
dh = 0
dh = 0.4
dh = 0.45
dh = 0.5
-16 -14 -12 -10 -8 -6 -4 -2 0
0.4 0.45 0.5 0.55 0.6
S
22
Thickness of Culvert
Point (2)
dh = 0
dh = 0.4
dh = 0.45
dh = 0.5
-35 -30 -25 -20 -15 -10 -5 0
0.4 0.45 0.5 0.55 0.6
S
22
Thickness of Culvert
Point (3)
dh = 0
dh = 0.4
dh = 0.45
dh = 0.5
0 5 10 15 20 25 30 35 40
0.4 0.45 0.5 0.55 0.6
S
22
Thickness of Culvert
Point (4)
dh = 0
dh = 0.4
dh = 0.45
dh = 0.5
-30 -25 -20 -15 -10 -5 0
0.4 0.45 0.5 0.55 0.6
S
22
Thickness of Culvert
Point (5)
dh = 0
dh = 0.4
dh = 0.45
dh = 0.5
S11 t = 0.4 t = 0.45 t = 0.5 t = 0.55 t = 0.6 Point (1) 74.84% 70.83% 67.56% 64.88% 62.71% Point (2) 24.37% 21.98% 19.97% 18.25% 16.79% Point (3) -16.05% -13.65% -12.15% -10.87% -9.60% Point (4) 82.53% 80.47% 79.49% 79.59% 80.77% Point (5) 16.78% 15.77% 14.81% 13.93% 13.14%
11
Table (9) Difference for an amount of concrete between case without hunch and other cases for case b=5 m
Figs. (6a-6e) show the relationship between the thickness of culvert and dimensions of haunch for S11 at points 1, 2, 3, 4, and 5.
When the thickness of culvert increases by 12.5% of the original culvert thickness, the S11 decreases by an average 10.71% at the point (1) 10.83% at the point (2), 0.33% at the point (3), 18.72% at the point (4), and 8.33% at the point (5). All these values are computed for dimensions of haunch varies from 0cm to 50 cm.
When the dimensions of haunch increases by 12.5% of the original culvert thickness, the S11 decreases by an average 20.36% at the point (1), 3.51% at the point (2), 0.32% at the point (3), 42.74% at the point (4), and 2.27% at the point (5). All these values are computed for the thickness of culvert varies from 40cm to 60 cm.
Figs. (7a-7e) show the relationship between the thickness of culvert and dimensions of haunch for S22 at points 1, 2, 3, 4, and 5.
When the thickness of culvert increases by 12.5% of the original culvert thickness, the S22 decreases by an average 11.15% at the point (1) 11.59% at the point (2), 20.68% at the point (3), 8.94% at the point (4), and 9.91% at the point (5). All these values are computed for dimensions of haunch varies from 0cm to 50 cm.
When the dimensions of haunch increases by 12.5% of the original culvert thickness, the S22 decreases by an average 12.84% at the point (1), 4.79% at the point (2), 5.59% at the point (3), 11.33% at the point (4), and 3.33% at the point (5). All these values are computed for the thickness of culvert varies from 40cm to 60 cm.
From Table (7), we can find that the effect of 40 cm haunch decreases the values of S11 by an average 68.16% for point (1) and 80.57% for point (4). While the average is 20.27% for point, (2) and 14.89% for point (5)
From Table (8), we can find that the effect of 40 cm haunch decreases the values of S22 by an average 58.18% for point (1) and 55.69% for point (4). While the average is 25.91% for point, (2) and 20.53% for point (5)
From Table (9), we can find that the maximum difference for concrete is 3.55% between case without hunch and case with the 50cm hunch
12
Discussion
From the previous, section “Result” It is clear that the S and S22 decreases by the increase of the thickness of culvert or dimensions of haunch because the stiffness of the culvert is increasing. Besides, the amount of concrete for haunch is smaller than for the increase of the thickness of the culvert. The best choice from the economic point of view is the haunch.
Summary and conclusions
For case b = 6m, at the corners of the culvert when the thickness of the culvert and the dimensions of haunch increases by 12.5% of the original culvert thickness for each one, the S11 decreases by an average 10.22 % and 27.45 %, respectively, also the S22 decreases by an average 8.68 % and 11.98 %, respectively. Similarly, in the mid-span of the culvert, the S11 decreases by an average 7.29 % and 1.36 %, respectively, besides, the S22 decreases by an average 16.7 % and 5.49 %, respectively.
For case b = 5.5m, at the corners of the culvert when the thickness of the culvert and the dimensions of haunch increases by 12.5% of the original culvert thickness for each one, the S11 decreases by an average 11.41 % and 28.6 %, respectively, also the S22 decreases by an average 12.13 % and 11.98 %, respectively. Similarly, in the mid-span of the culvert, the S11 decreases by an average 7.15 % and 1.24 %, respectively, besides, the S22 decreases by an average 15.45 % and 4.05 %, respectively.
For case b = 5m, at the corners of the culvert when the thickness of the culvert and the dimensions of haunch increases by 12.5% of the original culvert thickness for each one, the S11 decreases by an average 14.71% and 31.55 %, respectively, also the S22 decreases by an average 10.04 % and 12.08 %, respectively. Similarly, in the mid-span of the culvert, the S11 decreases by an average 6.49 % and 2.03 %, respectively, in addition, the S22 decreases by an average 14.06 % and 4.57 %, respectively.
Comparison between an amount of extra concrete for 40 cm haunch and increasing by 12.5% of the thickness of the culvert = 1: 2.78
1- The presence of 40cm haunch leads to decreases in stresses with an average of 40%. 2- Increasing 12.5% of the dimensions of haunch decreases the values of stresses by an
average of 12%.
3- The increasing 12.5% of the thickness of the culvert decreases the values of stresses by an average of 10.75%.
4- Effect of increasing 12.5% of dimensions of haunch increase the percentage of an amount of concrete by an average of 3.46%.
13
References
A. D. Patel, and A. A. Galatage, (2016)“Analysis of Box Culvert under Cushion Loading”,
International Advanced Research Journal in Science, Engineering and Technology, IARJSET,
ISSN (Online) 2393-8021 ISSN (Print) 2394-1588, Vol. 3, Issue 6, P.P. 163-166
A. R. Polra and S. P. Chandresha, Dr. K. B. Parikh, (2017) “A Review Paper on Analysis and
Cost-Comparison of Box Culvert for the Different Aspect Ratio of Cell”, International Journal of
Engineering Trends and Technology (IJETT), Vol. 44, No. 3, P.P. 112-115.
B. N. Sinha and R. P. Sharma, (2009) “RCC Box Culvert - Methodology and Designs Including
Computer Method”, Journal of the Indian Roads Congress, No. .
H. Maximos, E. Erdogmus, and M. K. Tadros, (2010), “Fatigue Evaluation for Reinforced
Concrete Box Culverts” ACI Structural Journal, 107(1), P.P. 13-20.
K. K. Sahu and S. Sharma, (2015) “Comparison and Study of Different Aspect Ratio of Box
Culvert”, International Journal for Scientific Research & Development IJSRD, Vol. 3, Issue 07,
2015 P.P. 167 – 175
L. A. Chandrakant and P. V. Malgonda, (2014) “Finite Element Analysis of Box Culvert”,
International Journal of Advanced Technology in Engineering and Science www.ijates.com
Volume No.02, Issue No. 06, P.P. 93-102 ISSN (online): 2348 – 7550.
M.G. Kalyanshetti and S.A. Gosavi, (2014) “Analysis of Box Culvert - Cost Optimization for
Different Aspect Ratios of Cell”, International Journal of Research in Engineering and Technology
(IJRET), Volume: 03 Issue: 04, Available @ http://www.ijret.org, P.P. 508-514.
N. Kolate, M. Mathew and S. Mali, (2014), “Analysis and Design of RCC Box Culvert”,
International Journal of Scientific & Engineering Research, Volume 5, Issue 12, P.P. 36-40
Saurav and I. Pandey, (2017), “Economic Design of RCC Box Culvert through Comparative Study of Conventional and Finite Element Method” International Journal of Engineering and Technology
(IJET), Vol 9 No 3, P.P. 1707-1713.
S. R. Krishna and Ch. H. Rao, (20 7), “Study on Box Culvert Soil Interaction” International
Journal of Civil Engineering and Technology (IJCIET), Volume 8, Issue 1, P.P. 734 – 738
S. Shreedhar and R.Shreedhar, (2013), “Design Coefficients for Single and Two Cell Box
Culvert”, International Journal of Civil and Structural Engineering (IJCSER), Volume 3, No 3, P.P.
14
Y. V. Kumar and C. Srinivas, (2015), “Analysis and Design of Box Culvert by Using
Computational Methods”, International Journal of Engineering & Science Research, IJESR, July
2015, Vol-5, Issue-7, P.P. 850-861.
The author declares that there is no conflict of interest regarding the publication of this paper.
Acknowledgments
First and foremost, I would like to express my gratitude to ALLAH for giving me the will to accomplish this work.
The author gratefully acknowledges the approval and the support of this research study by the grant no. Eng-2017-1-8-f-7407 from the Deanship of Science Research at Northern Border University, Arar, K.S.A.