eff e c t s o n lo w e r-li m b m u s cl e f a ti g u e . Jo u r n a l of S t r e n g t h a n d C o n d i tio ni n g R e s e a r c h .
Do w n l o a d e d fr o m : h t t p ://i n si g h t . c u m b r i a . a c . u k /i d/ e p ri n t/ 4 0 8 3 /
U s a g e o f a n y i t e m s f r o m t h e U n i v e r s i t y o f C u m b r i a’ s i n s t i t u t i o n a l r e p o s i t o r y ‘I n s i g h t ’ m u s t c o n f o r m t o t h e f o l l o w i n g f a i r u s a g e g u i d e l i n e s .
Any it e m a n d it s a s s o ci a t e d m e t a d a t a h el d i n t h e U niv e r si ty of C u m b r i a ’s in s ti t u ti o n al r e p o si t o r y I n si g h t ( u nl e s s s t a t e d o t h e r wi s e o n t h e m e t a d a t a r e c o r d ) m a y b e c o pi e d , di s pl ay e d o r p e rf o r m e d , a n d s t o r e d i n li n e wi t h t h e JIS C f ai r d e a li n g g ui d eli n e s ( av ail a bl e h e r e) fo r e d u c a t i o n al a n d n o t-fo r-p r ofi t a c tiviti e s
p r o v i d e d t h a t
• t h e a u t h o r s , ti tl e a n d full bi blio g r a p h i c d e t ail s of t h e it e m a r e ci t e d cl e a rly w h e n a n y p a r t
of t h e w o r k is r ef e r r e d t o v e r b a lly o r i n t h e w ri t t e n fo r m
• a h y p e rli n k/ U RL t o t h e o ri gi n al I n si g h t r e c o r d of t h a t it e m is i n cl u d e d i n a n y ci t a ti o n s of t h e w o r k
• t h e c o n t e n t is n o t c h a n g e d i n a n y w a y
• all fil e s r e q ui r e d fo r u s a g e of t h e it e m a r e k e p t t o g e t h e r wi t h t h e m a i n it e m fil e. Yo u m a y n o t
• s ell a n y p a r t of a n it e m
• r e f e r t o a n y p a r t of a n it e m wi t h o u t ci t a ti o n
• a m e n d a n y it e m o r c o n t e x t u ali s e it i n a w a y t h a t will i m p u g n t h e c r e a t o r ’s r e p u t a t i o n
• r e m ov e o r a l t e r t h e c o py ri g h t s t a t e m e n t o n a n it e m . T h e full p oli cy c a n b e fo u n d h e r e.
Physiological Responses to Linear and Non-Linear Soccer-Specific Match Simulations
and their Effects on Lower-limb Muscle Fatigue
Authors and affiliations:
1Nasir Uddin, 1Owen Jeffries, 2Paul Read, 3Louis Howe, 1Stephen Patterson, 1,4*Mark
Waldron
1.School of Sport, Health and Applied Science, St Mary’s University, Twickenham, London,
UK;
2.Athlete Health and Performance Centre, Aspetar Orthopaedic and Sports Medicine
Hospital, Doha, Qatar;
3.Medical and Sport Sciences, University of Cumbria, Lancaster, UK;
4School of Science and Technology, University of New England, NSW, Australia.
* = corresponding author
Dr. Mark Waldron
Waldegrave Road
Twickenham
TW1 4SX
020 8240 8246
Physiological Responses to Linear and Non-Linear Soccer-Specific Match Simulations
ABSTRACT
We investigated: i) the effects of linear and non-linear soccer simulations on lower-limb
muscle function and physiological responses and ii) evaluated the relationship between
match-running demands and changes in lower-limb muscle function. In a repeated measures
crossover design, 8 participants completed either a linear or non-linear adapted
Loughborough intermittent shuttle test (LIST) on two occasions. The movement of players
was tracked with a global positioning system (GPS), while lower-limb muscle function tests
and physiological measurements were performed before and every 15-min during the
simulation. There was no differences in distance covered, yet high-speed running (P = 0.007),
accelerations (P = 0.008) and decelerations (P = 0.015) were higher in the linear LIST. Mean
heart rate (P = 0.001) and ratings of perceived exertion (P = 0.013) were higher in the
non-linear LIST. Peak landing forces (P = 0.017) and jump height (P = 0.001) were reduced
between baseline and 90-min but were not different between conditions. Changes in peak
landing forces from baseline to half-time (r = -0.57, n = 16, P = 0.022) and full-time (r =
-0.58, n = 16, P = 0.019) were related to high-speed running. Hamstring force was unaffected
by time (P = 0.448) but was reduced in the linear LIST (P = 0.044). Protocols posing
different external and internal demands elicited similar levels of fatigue across simulations.
Hamstring function was not an effective indicator of fatigue but our results highlight the
greater demands placed on this muscle group when higher-speed running is performed.
INTRODUCTION
Soccer is characterised by prolonged low-intensity movement, interspersed by periods of
high-intensity running, including both high and low-speed movements of varying energetic
demand (25). In the context of team sports, fatigue can be identified by a reduction in
performance (28), reflected by changes in distance covered, particularly at higher speeds,
across progressive stages of a match (35). Recent advancements in player tracking
technologies, such as global positioning systems (GPS), have facilitated the monitoring of
fatigue during matches, which typically manifests during the end of the first half and during
the second half of a match (1, 21, 29, 34).
Fatigue occurs in soccer matches owing to a combination of central and peripheral factors (7,
14, 21, 35). There are numerous ways to measure the effects of fatigue during or after
matches, such as, invasive laboratory and non-invasive field-based tests (14, 27). Indeed,
changes in physical function of the lower-limbs have been identified after soccer matches
(19). However, due to the impracticality of laboratory-based assessments, it is common to
simulate match-specific performance and adopt tests that can be reliably applied to more
ecologically valid environments with greater ease. For example, assessments of muscle
function, using dynamometry (10, 26) or portable force plate analysis (24), have identified
reductions in strength and changes in landing kinetics after simulated treadmill-based soccer
Whilst treadmill-based simulation protocols are commonly used for experimental control (10,
24, 26), they lack ecological validity. Consequently, field-based protocols such as the
Loughborough Intermittent Shuttle Test (LIST) (23) or the Soccer-Specific Aerobic Field Test
(SAFT90) (16), have been used to simulate soccer match play and evaluate the effects of
match-specific fatigue. For example, Small et al. (31) demonstrated reduced hip flexion and
knee extension angles, as well as decreased stride length during a sprint at the end of each
half of the SAFT90. This was interpreted by Small and colleagues to place players at greater
risk of hamstring strain. To further enhance ecological validity, adopting the use of a
simulation protocol, such as the SAFT90, that includes non-linear running patterns (changes
of direction; COD) and high-intensity accelerating and decelerating movements is necessary.
Non-linear running is frequently performed during soccer matches, with professional players
completing 727 ± 203 swerves and turns within a single match (3). To successfully complete
these actions in soccer, repetitive demanding muscle contractions are necessary (2), including
those of an eccentric nature. The cumulative effect of performing these actions ultimately
leads to fatigue, the adoption of less efficient movement patterns (31) and the potential for
increased injury risk (10). Reports have suggested that Non-linear running induces greater
heart rate, perceptual and metabolic responses than straight-line (linear) running (6) but this
has been questioned in recent studies, where equal reductions in counter-movement jump and
drop jump height were identified (11). However, the effect of non-linear activity has not been
directly examined in a sports-specific scenario. Furthermore, there is limited understanding of
the relationship between the demands of a soccer match and the degree of functional
The aims of this study were to: i) investigate the effects of linear and non-linear soccer
simulations on acute lower-limb muscle fatigue and physiological responses and ii) evaluate
the relationship between match-running demands and changes in lower-limb muscle function
across different simulated match conditions. It was hypothesised that a protocol including
more changes of direction would be more physiologically demanding and induce greater
functional impairments than traditional simulations, characterised by greater periods of linear
motion.
METHODS
Experimental Approach to the Problem
A repeated measures, counter-balanced crossover design was used, with participants
completing either a linear (23) or non-linear adapted LIST protocol on two separate
occasions, separated by one week. Field-based measurements of lower-limb muscle function
were performed before, during (every 15-min) and immediately after each test. The
participants were monitored with Global Positioning System (GPS) devices (FieldWiz,
Advanced Sport Instrument Sarl, Switzerland) throughout each protocol, while physiological
responses were measured via heart rate (HR) telemetry (Zephyr HxM BT, Medtronic,
Annapolis, USA), rating of perceived exertion (RPE; 6-20) (4) and analysis of capillary blood
lactate concentration (B[La]) (Biosen C Line, EKF diagnostic GmbH, Barleben, Germany).
Including familiarisation, participants visited the testing facility on three occasions at the
same time on each day. The participants were instructed to eat according to their normal diet
and avoid caffeine and alcohol consumption in the 24-h prior to testing, as well as strenuous
Subjects
8 male university team sports players consented to take part in this study (Table 1). To be
included in this study, the participants were screened for their readiness to perform physical
exercise (PAR-Q) and were required to achieve a minimum level of nine on the multi stage
fitness test (MSFT). Institutional ethical approval was given for this study, which was
conducted in accordance with the 1964 Helsinki declaration.
*****Insert Table 1 here*****
Procedures
Initial pilot testing was conducted to develop the non-linear LIST, in an attempt to
incorporate the 727 COD instances reported by Bloomfield et al. (3), without changing the
duration of the test or intended total distance covered. The resulting design replaced the 55%
and 95% O2max running sequences with a non-linear course (Figures 2 and 3). This meant that
there were 120-144 COD per 15-min cycle and between 720 and 864 COD across the entire
non-linear LIST, which ranged based on fitness levels. The traditional linear LIST has a total
of 300-360 COD activities across the entire protocol. This design also ensured an equal total
distance between courses, as well as an equal number of left and right-sided COD across the
protocol. The intensity of the COD course during the non-linear LIST was calculated from
the participants’ maximal time-trial performance across one cycle of the non-linear course,
which was previously determined during the familiarisation session. The maximal non-linear
time trial was multiplied by 1.5 and used as the final intensity, which was determined via
One week before testing, participants visited the testing facility for the first time. Each
participant performed a standardised warm-up, followed by a maximal non-linear time trial.
Their time was recorded for subsequent calculation of the COD intensity on the non-linear
LIST. The maximal non-linear time-trial was based on the fastest time of two trials. The
participants’ were then tested for lower-limb muscle function, using a countermovement
(CMJ) and isometric hamstring force (ISO), measured via a force plate (PASCO force plates,
1000 Hz, PASPORT PS-2141, PASCO, Roseville, CA, USA). After a 20-min period of rest,
the MSFT was performed outdoors on a grass surface. The participants highest score (level)
was used to determine their running intensity during the linear LIST, as described by
Nichloas et al. (23). After 60-min of rest, the participants performed three runs of a single
15-min cycle of the LIST protocol, based on their individualised intensities from the MSFT,
followed by three runs of the adjusted LIST, based on their fastest agility time trial
performance. Participants were reminded of the audio signals (instructions) used in the LIST
and given time to listen to the audio file.
Testing was performed outdoors on a firm grass surface, in dry, calm conditions. The weather
during the trial was recorded on a mobile weather station (Accuweather for Android,
Accuweather Inc, USA). The mean temperature across all trials was 17.2°c and the mean
humidity was 62%. The LIST protocols were all developed in audio software (Audacity
Windows, Audacity 2.1.2, Boston, USA) and played through speakers connected to a laptop
(Windows 10, Asus X55C). The participants wore the same shorts and t-shirt for both tests
and their own studded football boots, which were only removed to perform the lower-limb
muscle tests. They were permitted to drink water ab-libitum during the LIST and always
encouragement throughout. The two lower-limb muscle field tests (CMJ and ISO), as well as
physiological and perceptual measurements, were recorded immediately before each LIST
condition, every 15-min during the test and immediately after.
Countermovement jump test
Countermovement jump (CMJ) tests were standardised, by the participants placing their
hands on their hips and standing with their feet shoulder-width apart on the force plate.
Participants were asked to descend into a quarter-squat and then jump as high as possible,
without bending their legs in the air and without moving their hands. The jump was repeated
twice with a 30-s rest between each jump. The highest jump height (cm) and subsequent peak
force (N) was recorded on landing and had inter-day CVs of 2.2% and 3.2% respectively.
Isometric hamstring test
Isometric hamstring force of both legs was tested using the same force plate, following the
protocol of McCall et al. (19). The test was performed on the right leg, with the participants
lying supine on the floor. The hips and knees of the working leg were flexed to 90°, using a
goniometer (Lafayette Instrument Company, USA), and rested on top of an elevated force
plate. The force plate was fitted to an adjustable wooden plinth. The position of the
participant was recorded for consistency between both conditions of the LIST. The
contralateral leg was rested flat on the floor next to the plinth, with the knee remaining fully
extended throughout the testing period. The participant pushed their heel into the force
The participants performed the tests barefooted. The contraction was repeated twice with 30-s
rest between attempts. The highest peak force (N) was recorded. This test has a inter-day
reliability of 6% CV, which is similar to that reported by McCall et al. (19).
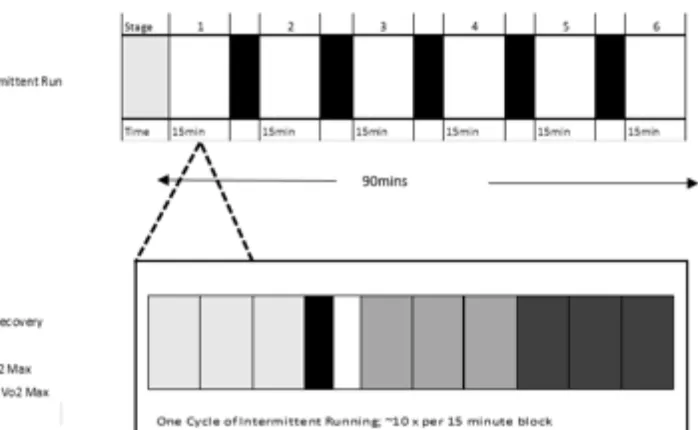
Linear LIST
The linear LIST comprised 6 intervals and was performed for a total of 90-min, interspersed
by 4-min recovery periods every 15-min cycle (Figure 1). During each 4 -min recovery
period, the participants walked for 30-s from the field to the laboratory, where they
performed a CMJ and isometric hamstring test. Whilst in the laboratory, the participants
provided an RPE score and capillary blood was drawn from a finger for B[La], which was
placed in an Eppendorf solution for later analysis. Heart rate was measured continuously
throughout the trial reported as mean and peak per 15-min cycle of the LIST protocols.
****Insert Figure 1 here****
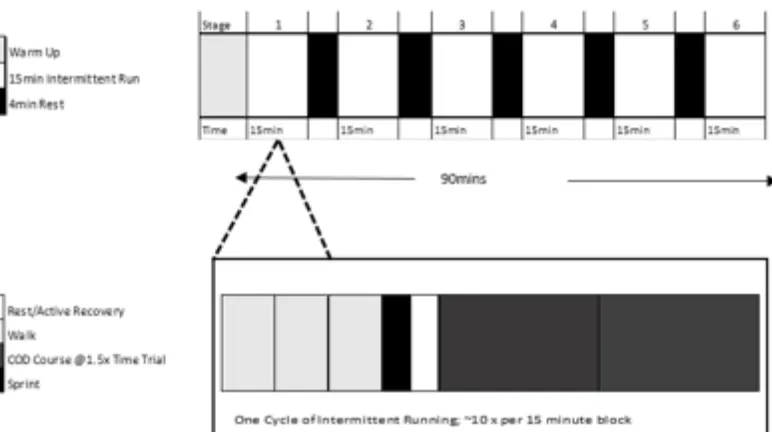
Adjusted non-linear LIST
The adapted non-linear LIST protocol (Figure 2) was based on the original version (i.e. linear
LIST) but the 55% and 95% O2max sequences were replaced with two multidirectional runs at
1.5 non-linear time trial (performed on the familiarization day) (Figure 3) for the whole
****Insert Figure 2 and 3 here****
Movement analysis
Global Positioning System (GPS) devices were fitted between the scapulae of the participants
within a tightly fitting vest. The devices sampled at 10 Hz and an intra-unit reliability of
between 1.0 %, 3.1 %, 4.7 % and 5.9 % CV for walking, jogging, sprinting and linear change
of direction activities, respectively, which are all included in the LIST. The GPS devices were
later attached to a laptop and data was extracted and imported into a customised excel
spreadsheet, where analysis was conducted. Peak speed (km/h), mean speed (km/h), total
distance (m), high-speed running distance (m) (> speed associated with final stage of the
MSFT), low speed running distance (< speed associated with final stage of the MSFT), mean
metabolic power (W/kg), number of accelerations and decelerations above 3 m/s2 and the
peak accelerations and decelerations were calculated.
Statistical Analyses
A-priori sample size estimations were conducted using G*Power (Version 3.0.10) (8). Based
on the typical effect sizes (Cohen’s d > 0.3) reported for changes in variables, such as jump
height across a soccer match, with a statistical power of 0.80 and alpha level of 0.05, a
sample size of 8 was estimated. A two-way repeated measures analysis of variance (ANOVA)
was used to evaluate the main effects of time (Baseline, 15-min, 30-min, 45-min, 60-min,
variables. If tests of Sphericity were violated, the Greenhouse-Giesser correction was used. In
the event a statistical difference was identified, a post-hoc Bonferroni test was used to
identify differences. Effect sizes (Cohen’s d) were also performed on pairwise comparisons
and defined as; trivial = 0.2; small = 0.21–0.6; moderate = 0.61–1.2; large = 1.21–1.99; very
large > 2.0 (5). Where pairwise differences were apparent at baseline, the baseline values
were added as a covariate (i.e. ANCOVA). Changes in peak landing forces were also
evaluated with ANCOVA, using CMJ height as the covariate. Bivariate correlations
(Pearson’s r) were used to assess the relationships between physiological response and
changes in force and movement (GPS) variables. The strength of the relationships was
considered as: < 0.3 = weak, 0.3-0.5 = moderate; > 0.5 = strong (5). An alpha level of P ≤
0.05 was set for all analyses. Statistical analysis was conducted through IBM SPSS (Software
V22.0, IBM, New York, USA).
RESULTS
Movement analysis
As presented in Figure 4, there were effects of condition (F(1,7) = 13.819, P = 0.007) and time
for high-speed running (F(5,35) = 4.531, P = 0.03) but no interaction (P = 0.438). High-speed
running (HSR) was different from baseline at 75-min (P = 0.014) and 90-min (P < 0.001).
There were no effects of condition (F (1,7) = 0.027, P = 0.874) or time (F (5,35) = 1.000, P =
0.230) for total distance covered. There were condition (F(1,7) = 13.141, P = 0.008) and time
effects on the number of accelerations (F(5,35) = 14.517, P < 0.001) as well as an interaction
(F (5,35) = 8.874, P < 0.001). Post-hoc tests showed that the number of accelerations were
d = -0.06, 95% CI = -1.01 to 0.95) 30-min (136 ± 55 vs. 75 ± 34; P = 0.010, d = -1.33, 95%
CI = -1.82 to 0.34), 45-min (118 ± 63 vs. 72 ± 31; P = 0.015, d = -0.92, 95% CI = -1.51 to
0.55) and 75-min (104 ± 49 vs. 69 ± 32; P = 0.048, d = -0.85, 95% CI = -1.47 to 0.58).
Similarly, there was a condition (F(1,7) = 10.410, P = 0.015) and time effect for the number of
decelerations (F(5,35) = 4.690, P = 0.002) but no interaction effect (F(5,35) = 1.209, P = 0.326).
There was an effect of condition only on average metabolic power (F (1,7) = 15.110, P =
0.008), which was higher in the linear LIST (11.5 W/kg vs. 10.2 W/kg).
****Insert Figure 4 here****
Physiological and perceptual responses
As presented in Figure 5, there were effects of condition (F(1,7) = 32.218, P = 0.001) and time
for average heart rate (F (6,42) = 306.390, P = 0.001) and interactions (F (6,42) = 3.313, P =
0.039). Post-hoc tests showed that average HR was higher in the adapted LIST compared to
the LIST at 15-min (165 ± 8 b/min vs. 161 ± 6 b/min; P = 0.021, d = 0.57, 95% CI = -0.71 to
1.29) and 60 min (163 ± 5 b/min vs. 157 ± 7 b/min; P = 0.029, d = 0.99, 95% CI = -0.51 to
1.56). Similarly, there were effects of condition (F(1,7) = 20.470, P = 0.003) and time for peak
heart rate (F (6,42) = 455.307, P = 0.001) as well as an interaction effect (F (6,42) = 0.694, P =
0.046). Post-hoc tests showed that peak HR was higher in the adapted LIST compared to the
LIST at 15 min (180 ± 6 b/min vs. 175 ± 7 b/min; P = 0.039, d = 0.77, 95% CI = -0.62 to
1.41), 60 min (178 ± 5 b/min vs. 171 ± 7 b/min; P = 0.03, d = 1.15, 95% CI = -0.43 to 1.24),
75 min (179 ± 7 b/min vs. 171 ± 7 b/min; P = 0.017, d = 1.14, 95% CI = -0.44 to 1.67) and 90
There were effects of time for RPE (F (6,42) = 56.971, P = 0.001) and interactions with
condition (F(6,42) = 3.129, P = 0.013), with post-hoc tests revealing higher RPE scores in the
adapted LIST compared to the LIST at 15 min (15 ± 2.6 vs. 12 ± 2.9; P = 0.018, d = 0.29,
95% CI = -0.84 to 1.13) and 30 min (15 ± 2.6 vs. 14 ± 2.4; P = 0.028, d = 0.4, 95% CI =
-0.79 to 1.19). There were only effects of time for blood lactate (F(6,42) = 7.580, P = 0.028).
****Insert Figure 5 here****
Lower-limb muscle function
There were baseline differences in isometric hamstring force (P = 0.033). ANCOVA with
control for baseline values revealed effects of condition for peak isometric hamstring force (F
(6,42) = 2.342, P = 0.048) but no effects of time (P = 0.448) (Figure 6). However, there were no
effects of condition (F(1,7) = 5.678, P = 0.059) but time effects for peak landing force (F (6,42)
= 2.957, P = 0.017) but no interactions (P = 0.169). Peak landing force was different at
90-min compared to baseline (P = 0.003). Only time affected peak jump height (F(6,42) = 10.616,
P = 0.001) with no condition interactions (F (6,42) = 0.709, P = 0.644). Pairwise differences
were found between 0-min and 45-min (P = 0.025), 60-min (P = 0.011), 75-min (P = 0.002)
and 90-min (P < 0.001).
(Insert Figure 6 here)
Relationships between movement variables and changes in force production
There were significant relationships between HSR m/min and the change in peak landing
(r = -0.58, n = 16, P = 0.019) (Figures 7A and 7B). There were no other significant
relationships (P > 0.05).
****Insert Figure 7 here****
DISCUSSION
We tested the hypothesis that non-linear simulated soccer performance would be more
physiologically demanding and induce greater functional lower-limb muscle impairments
compared to a linear simulated course. Accordingly, the non-linear course matched the total
distance covered but elicited greater heart rate and perceptual demands, despite the linear
course eliciting the greater HSR, accelerations, decelerations and metabolic power. Thus, the
overall interpretation is that non-linear sports-specific running alters the internal:external load
ratio, such that less external intensity is achieved, sometimes for a greater internal load. In
contrast to our hypothesis, there were no effects of condition for peak jump height or peak
landing forces, yet these did change between baseline and the end of the match. Conversely,
there were no effects of time on hamstring isometric force but there was an overall effect of
condition. Collectively, these findings suggest that peak jump height and landing forces can
be attenuated by match simulations but that isometric hamstring function is not an indicator
of fatigue. However, the lower hamstring force in the linear condition indicates that the type
of locomotion will influence the locality of muscle fatigue. That is; accumulation of
performed during lower-velocity movements will induce equal lower-limb muscle fatigue but
not alter hamstring function.
There were time effects for HSR by 75-min and 90-min of the match, thus indicating a
match-like fatigue profile (35). Jump height and landing forces were concurrently reduced
over the course of a match in both conditions, indicating the susceptibility of the lower-limbs
to soccer-specific fatigue; however, this can be induced via different locomotor/physiological
demands. These tests measure the capacity to generate propulsive forces (CMJ) and absorb
landing forces (dropping from landing), which are both necessary components of
high-intensity movement for a soccer player. The acute reduction in jump height is consistent with
findings in simulated soccer (24) and after general fatiguing protocols (20, 30). These
changes can be related to both peripheral and central mechanisms, as inferred by the
induction of low-frequency fatigue and loss of voluntary activation after soccer matches (27).
The change in peak landing force is less well-researched but offers an indication that ‘softer’
landing strategies are adopted once fatigue has ensued. These changes could be related to
structural alterations in the muscle-tendon complex or muscle activation patterns, resulting in
leg-stiffness reductions. Our results somewhat contrast the findings of others (24), where
increases in landing forces were identified after a treadmill-based soccer simulation.
However, Oliver and colleagues investigated this in drop-jump landings and it is possible that
jump landing fatigue manifests differently whilst landing from self-regulated heights. Given
the statistical control for jump height in this study, this result might signify an interesting
phenomenon, whereby the fatigued athlete reduces their jump height and adopts a different
exhaustive isometric contractions have been shown to decrease tendon stiffness in the
plantarflexors (12), which are partly responsible for force absorption during jump landing.
Furthermore, reductions in vertical stiffness after repeated jumping have been attributed to
reduced pre-activation of the triceps surae and knee extensor muscles, which are responsible
for controlling the stiffness and the storage or elastic energy on landing (13, 15). Strategic
changes in jump landing performance might also be adopted under soccer-specific fatigue.
For example, male participants have been shown to land with increased hip external and knee
internal rotation, as well as knee valgus, to help distribute the absorbed landing forces over
different vectors and, thus, muscle fibres (33). Given the likelihood of muscle damage during
and after the LIST protocol (18), such a strategy would provide a logical way of dealing with
the imposed mechanical demands. Irrespective of the reasons for a reduced peak landing
force after a simulated soccer match, the changes infer an alteration in jump landing kinetics,
which might have potential implications for other parameters of soccer performance, such as
reductions in running economy (9).
The traditional linear running LIST induced greater reductions in hamstring function, despite
this not reducing as a function of time. The higher velocities achieved in the linear protocol
are one potential explanation of this, although there was no direct correlation between these
variables. During sprinting actions, substantial demand is placed on the hamstring muscle
group to eccentrically control the rate of hip flexion and knee extension during the swing
phase (22). At high velocity this demand is increased and, as such, a simulation with faster
linear movements could feasibly reduce hamstring force. Whilst this partly explains the
differences between conditions, it does not indicate why the hamstring force measurements
consistent with the reports of others (10, 17, 18, 31, 32). This could be related to the form of
hamstring force test (19), which was shown to change in response to competitive matches. It
is possible that the stress of soccer matches induced greater hamstring fatigue, given that the
LIST does not involve any ball skills or sprints past ~ 15 m distance. Nevertheless, this
finding has implications for practitioners in soccer and suggests that lower velocity sessions
of equal volume, yet greater physiological load appear to place less demand on the hamstring
muscle group.
The relationships found between HSR and peak landing force suggest that movements
performed in higher speed categories make a partial contribution to the change in landing
mechanics of players after soccer performance. Perhaps a more noteworthy finding is the
non-significant relationships between any other match running variable and lower-limb
muscle tests. This facilitates our understanding of the current data, since it removes the
possibility that the relationship of HSR with peak force decrement is the product of
covariation. For example, without a thorough analysis, the mandatory decelerations that
follow each high-speed activity in the LIST might be expected to explain the changes in peak
landing force. As HSR is registered on the GPS device when high-speed thresholds are
surpassed, other GPS variables that register lower-speeds, yet are energetically demanding
activities, such as metabolic power and accelerations can also be discounted. This finding
highlights the importance of HSR as a marker of match-related lower-limb muscle fatigue
and should be incorporated into the monitoring of soccer and the planning of training
sessions.
These findings have implications for soccer practitioners in regard to the selection of training
drills and monitoring of key metrics during training and matches. Soccer simulations with
more frequent changes of direction may be used to induce higher physiological demands
while a fixed-distance linear running alternative will permit greater external load (HSR and
accelerations, decelerations) for a lower internal demand. Whilst the internal and external
demands may vary, the lower-limb muscle responses across stages of the match are mostly
similar, with peak jump height and landing forces reduced by the end of the match. This can
allow coaches to tailor soccer training towards an internal/external demand focus while still
eliciting all the lower-limb muscle responses of a typical game. When all simulated
performances were considered, the relationship of HSR was identified as the only correlate of
changes in peak landing forces. This also indicates HSR as an important marker of
match-related lower-limb muscle fatigue and should be incorporated into the monitoring of soccer
and the planning of training sessions. It should be recognised that the current findings relate,
specifically, to the moderately trained, young, male subjects used in this study and should not
REFERENCES
1. Bangsbo J, Nørregaard L, and Thorsoe F. Activity profile of competition soccer. Can J Sport
Sci, 16(2):110-116, 1991.
2. Besier TF, Lloyd DG, and Ackland TR. Muscle activation strategies at the knee during
running and cutting maneuvers. Med Sci Sport Exerc. 35(1):119-127, 2003.
3. Bloomfield J, Polman R, and O’Donoghue P. Physical demands of different positions in FA
Premier League soccer. J Sports Sci Med. 6(1):63-70, 2007.
4. Borg GA. Psychophysical bases of perceived exertion. Med Sci sports Exerc. 14(5):377-381,
1982.
5. Cohen J. Statistical Power Analysis for the Behavioral Sciences (2nd ed.). Hillsdale (NJ):
Erlbaum, 1988.
6. Dellal A, Keller D, Carling C, Chaouachi A, Wong del P, and Chamari K: Physiological
effects of directional changes in intermittent exercise in soccer players. J Strength Cond Res
7. Edwards AM, and Noakes TD. Dehydration: Cause of fatigue or sign of pacing in elite
soccer? Sports Med. 39(1):1-13, 2009.
8. Faul F, Erdfelder E, Lang AG, and Buchner A. G* Power 3: A flexible statistical power
analysis program for the social, behavioral, and biomedical sciences. Behav Res
Methods. 39(2):175-191, 2007.
9. Fletcher JR, Esau SP, and MacIntosh BR. Changes in tendon stiffness and running economy
in highly trained distance runners. Eur J App Phys. 110(5):1037-1046, 2010.
10. Greig, M, and Siegler, JC. Soccer-Specific Fatigue and Eccentric Hamstrings Muscle
Strength. J Athl Train. 44(2):180-184, 2009.
11. Hader K, Mendez-Villanueva A, Palazzi D, Ahmaidi S, and Buchheit M. Metabolic Power
Requirement of Change of Direction Speed in Young Soccer Players: Not All Is What It
Seems. PloS one. 11(3): e0149839, 2016.
12. Kay AD, and Blazevich AJ. Isometric contractions reduce plantar flexor moment, Achilles
tendon stiffness and neuromuscular activity but remove the subsequent effects of stretch. J
Appl Physiol. 107:1181–9, 2009.
13. Komi PV, and Gollhofer A. Stretch reflexes can have an important role in force enhancement
during SSC exercise. J App Biomech 13(4):451-460, 1997.
14. Krustrup P, Mohr M, Steensberg A, Bencke J, Kjær M, and Bangsbo J. Muscle and blood
metabolites during a soccer game: implications for sprint performance. Med Sci Sport Exerc.
38(6):1165-1174, 2006.
15. Kuitunen S, Komi PV, and Kyröläinen H. Knee and ankle joint stiffness in sprint
running. Med Sci Sports Exerc, 34(1):166-173, 2002.
16. Lovell R, Knapper B, and Small K. Physiological responses to SAFT90: a new
17. Marshall PW, Lovell R, Jeppesen GK, Andersen K, and Siegler JC. Hamstring muscle fatigue
and central motor output during a simulated soccer match. PLoS One. 9(7): e102753, 2014.
18. Magalhaes J, Rebelo A, Oliviera E, Silva JR, Marques F, and Ascnesao A. Impact of
Loughborough Intermittent Shuttle Test versus soccer match on physiological, biochemical
and neuromuscular parameters. Eur J Appl Physiol, 108(1), 39-48, 2010.
19. Mccall A, Nedelec M, Carling C, Gall FL, Berthoin S, and Dupont G. Reliability and
sensitivity of a simple isometric posterior lower limb muscle test in professional football
players. J Sport Sci. 33(12):1298-1304, 2015.
20. McNeal JR, Sands WA, and Stone MH. Effects of fatigue on kinetic and kinematic variables
during a 60-second repeated jumps test. Int J Sports Phys Perf. 5(2):218-229, 2010.
21. Mohr M, Krustrup P, and Bangsbo J. Fatigue in soccer: a brief review. J Sport Sci. 23(6):
593-599, 2005.
22. Morin JB, Gimenez P, Edouard P, Arnal P, Jiménez-Reyes P, Samozino P, Brughelli M, and
Mendiguchia J. Sprint acceleration mechanics: The major role of hamstrings in horizontal
force production. Front Phys. 6, 2015.
23. Nicholas CW, Nuttall FE, and Williams C. The Loughborough Intermittent Shuttle Test: a
field test that simulates the activity pattern of soccer. J Sport Sci. 18(2):97-104, 2000.
24. Oliver J, Armstrong N, and Williams C. Changes in jump performance and muscle activity
following soccer-specific exercise. J Sport Sci. 26(2):141-148, 2008.
25. Osgnach C, Poser S, Bernardini R, Rinaldo R, and Di Prampero PE. Energy cost and
metabolic power in elite soccer: a new match analysis approach. Med Sci Sports Exerc. 42(1):
170-178, 2010.
26. Rahnama N, Reilly T, Lees A, and Graham-Smith P. Muscle fatigue induced by exercise
27. Rampinini E, Bosio A, Ferraresi I, Petruolo A, Morelli A, and Sassi A. Match-Related Fatigue
in Soccer Players. Med Sci Sport Exerc, 43(11):2161-2170, 2011.
28. Reilly T. Physiological aspects of soccer. Biol Sport. 11(1):3-20, 1994.
29. Reilly T, and Thomas V. A motion analysis of work-rate in different positional roles in
professional football match-play. J Hum Movement Stud. 2(2):87-97, 1976.
30. Rodacki AL, Fowler NE, and Bennett SJ. Multi-segment coordination: fatigue effects. Med
Sci Sports Exerc. 33(7):1157-1167, 2001.
31. Small K, McNaughton LR, Greig M, Lohkamp M, and Lovell R. Soccer fatigue, sprinting and
hamstring injury risk. Int J Sports Med. 30(08):573-578, 2009.
32. Small K, McNaughton L, Greig M, and Lovell R. The effects of multidirectional
soccer-specific fatigue on markers of hamstring injury risk. J Sci Med Sport. 13(1):120-125, 2010.
33. Shultz SJ, Schmitz RJ, Nguyen AD, and Levine BJ. Joint laxity is related to lower extremity
energetics during a drop jump landing. M Sci Sports Exerc, 42(4):771, 2010.
34. Van Gool D, Van Gerven D, and Boutmans J. The physiological load imposed on soccer
players during real match-play. Science and football. 1:51-59, 1988.
35. Waldron M, and Highton J. Fatigue and pacing in high-intensity intermittent team sport: an
update. Sport Med. 44(12):1645-1658, 2014.
Acknowledgements
Figures
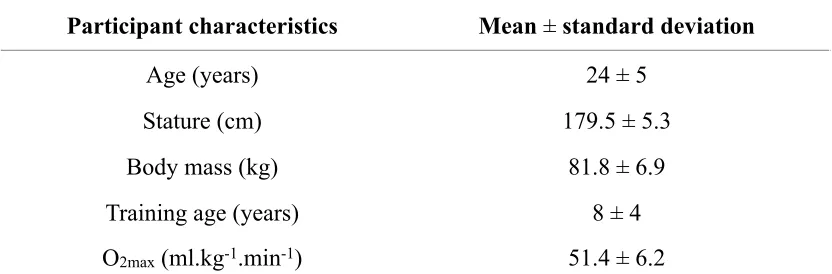
Table 1. Participant characteristics (n = 8)
Participant characteristics Mean ± standard deviation
Age (years) 24 ± 5
Stature (cm) 179.5 ± 5.3
Body mass (kg) 81.8 ± 6.9
Training age (years) 8 ± 4
!
Figure 1. The Loughborough Intermittent Shuttle Test (LIST), based on Nicholas et al.
(2000). Adjustments were made to the recovery period (4 min) and the 15 min blocks were
!
Figure 2. The adjusted, non-linear Loughborough Intermittent Shuttle Test (LIST), based on
Nicholas et al. (23). A change of non-linear (denoted by change of direction; COD) segment
was developed to replace the 55% and 95% O2max sequences. The same adjustments were
made to the recovery period (4-min) and the 15-min blocks were repeated for a 90-min total
!
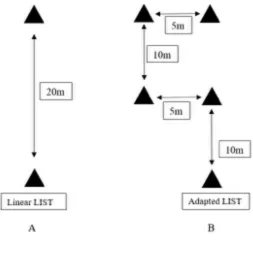
Figure 3. The Loughborough Intermittent Shuttle Test (LIST) 20 m linear configuration (A)
!
Figure 4. A) Total distance B) High-speed running distance C) Number of accelerations D)
LIST across progressive match simulation periods (n = 8). * = sig. different (P < 0.05) to
!
Figure 5. A) Mean heart rate B) Peak heart rate C) RPE D) Blood lactate during the
simulation periods (n = 8). * = sig. different (P < 0.05) to corresponding time point (P <
!
Figure 6. A) Peak unilateral isometric (iso) hamstring force B) Peak landing force C) Peak
jump height during the Loughborough Intermittent Test (LIST) vs. the adapted LIST across
!
Figure 7. A) The relationship between the change in baseline – half-time peak landing force
and HSR (r = -0.57, P = 0.022); B) The relationship between the change in baseline –