MIXTURE PREPARATION PROCESS IN SI ENGINES
WITH PARTICULAR REFERENCE TO AN
AIR-ASSISTED FUEL VAPORISER
b y
Simon David Jackson
Submitted for the Degree of Doctor of Philosophy
University College London
Department of Mechanical Engineering
ProQuest Number: 10106880
All rights reserved
INFORMATION TO ALL USERS
The quality of this reproduction is dependent upon the quality of the copy submitted.
In the unlikely event that the author did not send a complete manuscript and there are missing pages, these will be noted. Also, if material had to be removed,
a note will indicate the deletion.
uest.
ProQuest 10106880
Published by ProQuest LLC(2016). Copyright of the Dissertation is held by the Author.
All rights reserved.
This work is protected against unauthorized copying under Title 17, United States Code. Microform Edition © ProQuest LLC.
ProQuest LLC
789 East Eisenhower Parkway P.O. Box 1346
ABSTRACT
This thesis describes the problems encountered during cold-start operation of a SI
engine and details an alternative fuelling system designed to reduce unbumed
hydrocarbon emissions throughout this period. The system is able to produce
vaporised fuel during start-up conditions by incorporating an electrical heating
element which may be switched off once the catalyst has reached its light-off
temperature. Air assistance has been incorporated into the design to ensure good
atomisation of the liquid fuel when operating with the heating element disabled.
Characterisation o f the liquid fuel spray and measurement o f the efficiency o f the
heating element was performed. The device was tested to characterise its performance
and applied to an engine to provide comparison o f UHC emissions during a cold-start
with the standard fuel system. Further tests were performed to analyse the vapour
flow o f fuel within the intake port of a running engine of the device in both air
atomisation and fuel vaporisation modes and compared with that obtained from the
standard pintle injector. Two major factors influence the mixture preparation, namely
backflow and port temperature. These effects were isolated and removed for the final
test programme by the use of a pulsating flow rig.
A means of procuring a pressurised air supply for the device instead of relying on an
atmospheric bleed was also investigated. The method was to provide a tapping into
the combustion chamber via a restriction so to control the bleed rate.
The tests identified reduction of engine out UHC emissions during the cold-start
period of operation. Results fi'om intake port FRFID tests indicated the vapour flow
of fuel within the port, clarified the mixture preparation process and identified the
major contributors to fuel vapour formation and movement. The cylinder pressure
ACKNOWLEDGEMENTS
The author would like to thank both Paul Williams and Chris Nightingale for their
unfailing and enthusiastic support and guidance.
The UCL technical staff for their continued efforts in deciphering all submitted
technical drawings, especially Phil Jeavons, John Inns and Richard Winn.
Tom Ma of the Ford Motor Company for the numerous suggestions and ideas that
kept the work progressing, and to Tim Sweet, also o f the Ford Motor Company, for
the supply of many pieces o f necessary hardware.
Thanks are also extended to the EPSRC and the Ford Motor Company for funding
the research.
Finally I would like to thank my parents for their support and my sister and brother in
I U S tO TO WKTE 'WRVTING fr.'SSlGMMtHrS , BUT HOV4
I E K W ( TTAEN\ ,___ ^
1 Q .EM TZED TUAT TWE V4\TM k H TT LE PR A C TIC E, "T l* M X W IC S OF (hTFRBE'.KS
PURPOSE OF W R \T tS 6 iS To \HFUTE WEAK WEAS. OBSCURE P O C R R E A S o m N G , I AKD iHwe\r ciAR\ri.
WR\HKO cm BE AK (HT\W\DAT\HG AhO IMPERElRABLE fO&' NAN-r TO 5EL WY BOOK
RE FORT
IAH5 VWoLOEKAL IM?lRAT\ÆS>
\K OICK MO JAN&. ■ A S Î ’JPY |lH PS1CHIE iRAtiSRE'uATiOHAL
' G E N D E R M O D E S "
^ACADEMIA.
WERE I
r-TABLE OF CONTENTS
Abstract...ii
Acknowledgements... iii
Table of contents... v
List of figures... ix
List of tables... xv
Nomenclature...xvi
CHAPTER 1, A LITERATURE SURVEY... 1
1.1 INTRODUCTION...2
1.2 FOUR-STROKE SI ENGINE ANALYSIS...3
1.3 EMISSIONS, EMISSION REGULATIONS AND EXHAUST GAS TREATMENT... 6
1.3.1 Introduction... 6
1.3.2 HC: Pollutant...6
1.3.3 HC: Formation...6
1.3.4 Oxides of nitrogen (NOJ: Pollutant... 7
1.3.5 NO formation... 8
1.3.6 NO2 formation... 9
1.3.7 Carbon monoxide/dioxide: Emissions...9
1.3.8 CO2 /COformation...9
1.3.9 Emissions regulations... 10
1.3.10 Cold-start emissions... 12
1.3.11 Exhaust gas treatment... 13
1.3.12 Closing comments on emissions...21
1.4 MIXTURE PREPARATION/ FUEL SPRAYS... 22
1.4.1 Carburettors... 22
1.4.2 Multi-point fiiel injection...23
1.4.3 Single-point fuel injection...24
1.4.4 Drop size... 25
1.4.5 Problems associated with the Sauter mean diameter... 26
1.4.6 An alternative to the Sauter mean diameter... 26
1.4.7 Droplet size distributions...27
1.4.8 Fuel transportation properties...28
1.4.8a Droplet impaction: Carburettors & single-point fuel injection...28
1.4.8b Fuel film behaviour...31
1.4.8c Vaporised mixtures...32
1.4.8d Vaporised mixtures applied to fully warm engines... 32
1.4.9 Fuel injector sprays... 34
1.4.9a Port injection... 34
1.4.9b Air-assisted atomisers...37
1.4.9c Vaporised mixtures applied during cold-starting and warm u p ... 41
1.4.10 Closing comments on mixture preparation... 45
1.5 HEAT TRANSFER THEORY...47
1.5.1 Introduction... 47
1.5.2 Dimensional analysis applied to heat transfer by forced convection...48
1.5.3 Heat transfer with change of phase...50
1.5.4 Closing comments on heat transfer theory... 53
1.6.1 Introduction...55
1.6.3 Laser diffraction particle sizing...57
1.6.4 Problems of evaporation...57
1.6.5 Vapour concentration measurement...59
1.7 RESEARCH PROGRAMME...67
1.8 REFERENCES...70
CHAPTER 2, CHARACTERISATION OF FUEL/AIR MIXTURE PREPARATION...78
2.1 AIR-ASSISTED FUEL VAPORISER (AAFV): DESIGN... 79
2.2 THEORY... 81
2.2.1 Compressible flow equations...81
2.2.2 Heat transfer...83
2.2.3 Calculation of Cpf...83
2.2.4 Flow restriction...84
2.3 DISCUSSION 1...85
2.3.1 Operating criteria...85
2.3.2 Time delay to leading edge formation... 86
2.3.3 Liquid fuel/air-atomisation operation; Spray duration... 87
2.3.4 Fuel droplet size...88
2.3.5 Modulation of air flow...89
2.4 CONCLUSIONS FROM INITIAL TESTING... 90
2.5 DISCUSSION n ...91
2.5.1 Vaporised fuel operation... 91
2.5.2 Geometric influences on vaporisation... 91
2.5.3 Heat transfer...92
2.5.4 Nozzle mass flow rates...93
2.5.5 Spray duration...96
2.5.6 Drop size evaluation...97
2.5.7 Vapour detection...97
2.5.8 Spray cone angles...98
2.6 CONCLUSIONS FROM VAPOUR TESTING... 99
2.7 CONCLUDING STATEMENT... 99
2.8 REFERENCES... 101
APPENDIX A 2 ... 102
A2.1 SIMULATED ENGINE CONDITIONS...102
A2.1.1 Idle... 102
A2.1.2 Road load... 102
A2.1.3 Full load... 102
A2.2 GLOW PLUG TEMPERATURE DATA...103
A2.2.1 Glow plug temperature measurements points... 103
A2.3 LASER DIAGNOSTIC PARTICLE SIZING... 106
A2.3 .1 Background and limitations...106
A2.3.2 Theory... 107
A2.3.3 Malvern 2600c... 109
A2.4 AAFV FUEL SPRAY CONE ANGLES...111
A2.4.1 Fuel spray cone angle testing...I l l A2.5 RATIO OF SPECIFIC HEATS FOR GASOLINE/AIR MIXTURES... 112
CHAPTER 3, COLD-START TESTING...114
3.1 INTRODUCTION... 114
3.2 TEST DETAILS... 117
3.2.1 Installation... 117
3.2.2 Testbed... 117
3.2.3 Operating system... 118
3.5 CONCLUSIONS... 127
3.6 REFERENCES... 128
APPENDIX A 3... 130
A3.1 DATA LOGGING... 130
CHAPTER 4, AAFV DEVELOPMENT PROGRAMME... 135
4.1 INTRODUCTION... 136
4.2 CHANGES TO THE ORIGINAL UNIT...136
4.3 INSTALLATION IMPROVEMENTS...137
4.4 CONCLUSIONS... 139
APPENDIX A 4 ... 141
A4.1 GLOW PLUG CONTROLLER FUNCTION...141
A4.2 FUNCTION DIAGRAMS... 142
A4.2.1 Normal operation... 142
A4.2.2 Premature start... 142
A4.2.3 Start after safety cut-off...143
A4.2.4 Unsuccessful start... 143
CHAPTER 5, INTAKE & EXHAUST PORT UNBURNED HYDROCARBON CONCENTRATION SAMPLING...145
5.1 INTRODUCTION... 145
5.2 TEST PROGRAMME MEASUREMENT APPARATUS... 150
5.2.1 Cambustion high frequency response flame ionisation detector, HFRFID...150
5.2.2 Design of cylinder head sample sites...153
5.3 EXTERNAL AIR-ASSISTANCE FOR THE AAFV... 154
5.3.1 Air pump... 155
5.3.2 Cylinder Pressure Tapping, CPT...155
5.4 FIGURE GUIDE... 158
5.4.1 Key to figures... 158
5.4.2 HFRFID sampling sites:... 158
5.5 DISCUSSION... 159
5.5.1 HFRFID tests: 1500 rev/min, road load, 35.9 kPa intake pressure... 159
5.5.1a Intake port sampling, vapour, atmospheric bleed... 159
5.5.1b Intake port sampling, vapour, cylinder pressure tapping 1 & 2 ... 161
5.5.1c Intake port sampling, air-atomisation (i.e. no heat applied), cylinder pressure tapping 1 & 2... 163
5.5. Id Intake port sampling, backflow, standard, air-atomisation & vapour, atmospheric bleed... 166
5.5.2 HFRFID exhaust port sampling...169
5.5.2a Exhaust port sampling, 1500 rev/min, road load, 35.9 kPa intake pressure, standard, air-atomisation & vapour, atmospheric bleed... 170
5.5.2b Exhaust port sampling, air-atomisation, cylinder pressure tapping 1 & 2...172
5.5.3 HFRFID intake port sampling: 800 rev/min, idle, 52.3 kPa intake pressure...173
5.5.3a Intake port sampling, vapour, atmospheric bleed... 173
5.5.3b Intake port sampling, vapour, cylinder pressure tapping 1 & 2 ... 175
5.5.4c Intake port sampling, air-atomisation, cylinder pressure tapping 1 & 2 ...177
5.5.5d Intake port sampling, backflow, standard, air-atomisation & vapour, atmospheric bleed... 179
5.5.6 HFRFID intake port sampling: 1650 rev/min, full load, 0 kPa intake pressure 182 5.5.6a Intake port sampling, standard, air-atomisation & vapour, cylinder pressure tapping 2 ... 182
5.6 CONCLUSIONS... 185
APPENDIX A S... 189
A5.1 GENERAL... 189
A5.2 ENGINE SPECIFICATION:...189
A5.2.I Valve timing... 189
A5.3 TEST DATA... 190
A5.3.I Engine variables... 190
A5.3.2 Idle settings... 190
A5.3.3 Road load setting... 190
A5 .3 .4 Full load settings... 190
CHAPTER 6, INLET PORT UHC TRACES, ENGINE VS. PULSATING FLOW RIG... 192
6.1 INTRODUCTION... 192
6.2 TEST RESULTS AND DISCUSSION...194
6.2.1 800 rev/min idle (53.2 kPa manifold depression), sample sites B & D ...194
6.2.2 1500 rev/min road load (35.9 kPa manifold depression), sample sites B & D ...198
6.2.3 1650 rev/min full load (0 kPa manifold depression), sample sites B & D ... 203
6.3 CONCLUSIONS...206
6.4 REFERENCES...207
CHAPTER 7, MOTORED-START & INJECTOR INTERRUPT TESTS...209
7.1 INTRODUCTION...209
7.2 TEST PROGRAMME...212
7.3 DISCUSSION...213
7.3.1 Motored-start tests, (idling conditions, 52.3 kPa manifold depression), standard fuel system, open & closed valve injection strategy... 213
7.3.2 Motored-start tests, (idling conditions, 52.3 kPa manifold depression), AAFV, air- atomisation, open & closed valve injection strategy... 215
7.3.3 Motored-start tests, (idling conditions, 52.3 kPa manifold depression), AAFV, fuel vaporisation, open & closed valve injection strategy... 217
7.4 INJECTOR INTERRUPT TESTS... 219
7.4.1 Curve fitting program as applied to injector interrupt test measurements... 219
7.4.2 Injector interrupt tests, (idling conditions, 52.3 kPa manifold depression),standard fuel system, open & closed valve injection strategy...221
7.5 CONCLUSIONS...224
7.6 REFERENCES...225
APPENDIX A 7... 226
A7.1 INJECTOR INTERRUPT DECAY AND CUMULATIVE UHC TRACES... 226
CHAPTER 8, CONCLUSIONS AND SUGGESTIONS FOR FUTURE WORK... 228
8.1 SUMMARY OF CONCLUSIONS FROM PRECEDING CHAPTERS...228
8.1.1 Steady flow rig tests... 228
8.1.2 Cold-start engine tests... 228
8.1.3 Intake port HFRFID sampling: engine tests... 229
8.1.4 Intake port HFRFID sampling; PFR tests... 229
8.1.5 Motored-start and injector interrupt tests... 230
8.2 FURTHER DEVELOPMENT POSSIBILITIES FOR THE AAFV...231
8.2.1 Recommendations for further research...232
8.3 CLAIMS OF ORIGINALITY... 233
APPENDIX A 8...234
LIST OF FIGURES
Figure 1.1, The Otto cycle...3
Figure 1.2, Variation of exhaust NO concentration with air/fuel ratio...8
Figure 1.3, Variation of HC, CO and No% with air/fuel ratio... 9
Figure 1.4, FTP driving schedule... 12
Figure 1.5, HC emission and catalyst temperature vs. time during Urban Drive Cycle...13
Figure 1.6, Schematic of EGI system... 15
Figure 1.7, Flammability of cold exhaust/air mixture...17
Figure 1.8, Catalyst heating options... 18
Figure 1.9, Reduction of emissions due to catalyst heating... 18
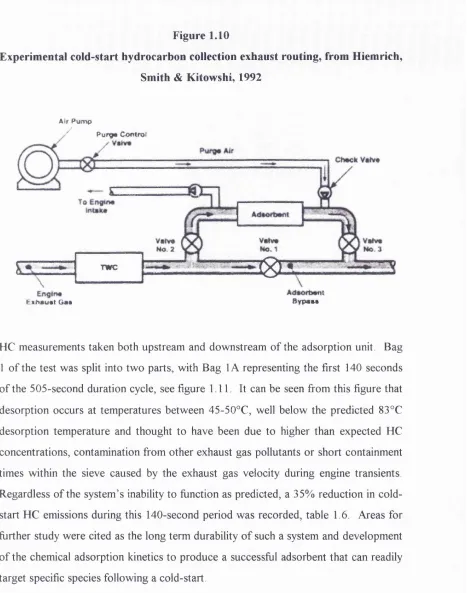
Figure 1.10, E?q}erimental cold-start hydrocarbon collection exhaust routing...19
Figure 1.11, FTP cold-start hydrocarbon collection... 20
Figure 1.12, Schematic of an elementary carburettor... 22
Figure 1.13, Cross section of pintle type fuel injector... 23
Figure 1.14, Electronic multi-point port fuel injection system... 24
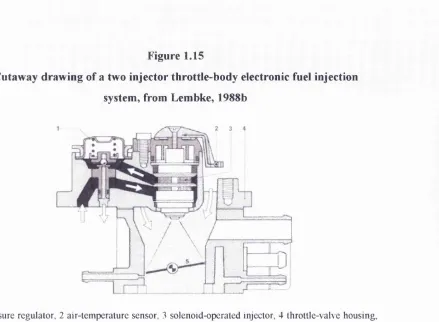
Figure 1.15, Cutaway drawing of a two injector throttle-body... 25
Figure 1.16a, Regions of engine load and speed range where extensive pools or puddles, liquid films or rivulets were observed on the manifold plenum floor...29
Figure 1.16b, Regions of engine load and speed range where extensive pools or puddles, liquid films or rivulets were observed in the manifold nmner... 29
Figure 1.17a, Percentage of indolene fuel evaporated at equilibrium at one pressure of atmosphere... 30
Figure 1.17b, Effect of pressure on amount of indolene fuel evaporated...30
Figure 1.18a, Predicted behaviour of the fuel film for an uncompensated step change in engine operating conditions...31
Figure 1.18b, Observed variation in air/fuel ratio for uncompensated throttle opening...31
Figure 1.19, Gasoline injection valves...35
Figure 1.20, Structure of a two-stream injector... 36
Figure 1.21, Start performance (-30° C) of a four-valve engine using standard pintle and two-stream injector... 37
Figure 1.22, Lucas air-assisted fuel injector with air bleed upstream of the fuel metering orifice... 38
Figure 1.23, Nippondenso air-assisted fuel injector with air bleed downstream of the fuel metering orifice... 38
Figure 1.24, Sectioned view of air-assisted atomiser... 39
Figure 1.25, Fuel spray mean droplet diameter... 40
Figure 1.26, Variation of droplet size with air pressure... 40
Figure 1.27, Influence of injection timing and spray quality on part load engine performance... 41
Figure 1.28, NEL fuel vaporiser...42
Figure 1.29, Comparison of HC emissions from a 16-valve engine during cold-starting using liquid and vaporised fuel...42
Figure 1.30, Heater power required to vaporise fuel at various pulse widths and injection frequencies... 43
Figure 1.31, PTC honeycomb EFE heater... 44
Figure 1.32, PTC manffold heater... 44
Figure 1.33, Modified exhaust cam... 45
Figure 1.34, Modified and standard camshaft diagrams... 45
Figure 1.35, The four regimes of pool boiling in water at atmospheric pressure...48
Figure 1.39, Typical PDA optical set-up... 56
Figure 1.51, Dimensionless energy distribution of diffracted light...58
Figure 1.41, Infra-red transmission range of various hydrocarbon molecules...59
Figure 1.42, Partition of space into concentric annuli for axisymmetric geometries... 60
Figure 1.43, Radial variation of total IR transmission at 3 .39/an in the axial plane of a 1.48 MPa n-heptane spray...61
Figure 1.44, Radial variation of the fuel vapour concentration in an n-heptane spray... 61
Figure 1.45, Effects of injector timing on the cycle to cycle repeatability of fuel vapour concentrations...62
Figure 1.46, Influence of engine temperature on in-cylinder fuel vapour concentration... 63
Figure 1.47, Vapour mole fraction measured as a function of test section position, light loading case...64
Figure 1.48, Vapour mole fraction measured as a function of test section position, heavy loading case...64
Figure 2.1, Sectioned view of the UCL air-assisted fuel vaporiser...79
Figure 2.2, Light obscuration vs. time delay after injector trigger, 0.8, 1.5 & 2.3 mm nozzles, 1500 rev/min, passive air bleed... 86
Figure 2.3, Light obscuration vs. time delay after injector trigger, 0.8,1.5 & 2.3 mm nozzles, 2000 rev/min, 35 kPa air bleed pressure... 86
Figure 2.4, Light obscuration vs. time delay after injector trigger, 0,8, 1.5 & 2.3 mm nozzles, 2000 rev/min, 70 kPa air bleed pressure... 87
Figure 2.5, Fuel spray drop size (Smd) vs. time delay after injector trigger, 0.8, 1.5 & 2.3 mm no2zles, 1500 rev/min, passive air bleed... 88
Figure 2.6, Fuel spray drop size (Smd) vs. time delay after injector trigger, 0.8, 1.5 & 2.3 mm nozzles, 2000 rev/min, full load, 35 kPa air bleed pressure...88
Figure 2.7, Fuel spray drop size (Smd) vs. time delay after injector trigger, 0.8, 1.5 & 2.3 mm nozzles, 2000 rev/min, 70 kPa air bleed pressure...89
Figure 2.8, Light obscuration vs. time delay after injector trigger, 1.2 & 1.5 mm nozzles, 2000 rev/min, full load, 70 kPa air bleed pressure... 97
Figure 2.9, Fuel spray drop size (Smd) vs. time delay after injector trigger, 1.2 & 1.5 mm nozzles, 2000 rev/min, full load, 70 kPa air bleed pressure... 97
Figure 2.10, Image of fuel spray into quiescent air, 1.5 mm nozzle, 12 kPa air-assistance . .. 98
Figure 2.11, Image of fuel spray into quiescent air, 1.5 mm nozzle, 70 kPa air-assistance... 98
Figure A2.1, Variation of ymixtu« with respect to air/fuel ratio across lines of constant mixture temperature... 112
Figure 3.1, Cold-start gravimetric air/fuel ratio, T C start temperature... 121
Figure 3.2, Cold-start gravimetric air/fuel ratio, 0° C start temperature... 121
Figure 3.3, Cold-start hydrocarbon emissions, optimum results from standard injector and AAFV tests, 7° C start temperature...121
Figure 3.4, Cold-start hydrocarbon emissions, optimum results from standard injector and AAFV tests, 0° C start temperature...121
Figure 3.5, Cold-start carbon monoxide emissions, 0° C start temperature... 122
Figure 3.6, Cold-start hydrocarbon emissions, 7° C start temperature... 122
Figure 3.7, Cold-start hydrocarbon emissions, 0° C start temperature... 122
Figure 3.8, Typical rise of engine speed and manifold depression with respect to time 123 Figure 3.9, Engine speed with respect to time, standard injectors, T C start temperature... 124
Figure 3.10, Engine speed with respect to time, AAFV, T C start temperature...124
Figure 3.11, Typical electrical power requirements for a 6-cylinder installation of the AAFVs... 125
Figure A3,4, Horiba carbon monoxide calibration, 4% spanned to 1.5 V... 134
Figure A3.5, Jaguar air flow meter calibration...134
Figure 4.1, Explode view of the redesigned AAFV...138
Figure 4.2, Computer generated model of the redesigned AAFV installation on the Zetec engine...139
Figure 4.3, Zetec engine equipped with the redesigned AAFV installation... 139
Figure 4.4, Computer generated model of the redesigned AAFV installation on the 140 Sigma engine... 140
Figure 4.5, Sigma engine equipped with the redesigned AAFV installation... 140
Figure 5.1, Comparison of a conventional FID and the Cambustion HFRFID...151
Figure 5.2, Sectioned view of the Cambustion HFRFID... 152
Figure 5.3, View of the intake port showing the HFRFID, probe sites B & C ...153
Figure 5.4, Overall view of the engine test bed...154
Figure 5.5a, CPT schematic... 156
Figure 5.5b, View of the cylinder pressure tapping pipe work cylinder headand the HFRFID probe sites B, C & D ... 157
Figure 5.6, Closed valve injection, fiiel vaporisation, 1500 rev/min road load, X = 1, (sample sites C & D ) ... 159
Figure 5.7, Open valve injection, fuel vaporisation, 1500 rev/min road load, X, = 1, (sample sites C & D ) ... 159
Figure 5.8, Closed valve injection, fuel vaporisation, 1500 rev/min road load. A, = 1, (sample sites B & C)... 160
Figure 5.9, Open valve injection, fuel vaporisation, 1500 rev/min road load,, X, = 1, (sample sites B & C)... 160
Figure 5.10, Closed valve injection, CPTl, fuel vaporisation, 1500 rev/min road load, X, = 1, (sample sites B & C)... 162
Figure 5.11, Closed valve injection, CPT2, fuel vaporisation, 1500 rev/min road load, X, = 1, (sample sites B & C)... 162
Figure 5.12, Open valve injection, CPTl, fuel vaporisation, 1500 rev/min road load, X, = 1, (sample sites B & C)... 162
Figure 5.13, Open valve injection, CPT2, fuel vaporisation, 1500 rev/min road load, X, = 1, (sample sites B & C)... 162
Figure 5.14, CPTl bleed pressure, fuel vaporisation, 1500 road load, X, = 1 ... 163
Figure 5.15, CPT2 bleed pressure, fuel vaporisation, 1500 road load, X, = 1 ... 163
Figure 5.16, Closed valve injection, CPTl, air-atomisation, 1500 rev/min road load, X. = 1, (sample sites B & C)... 164
Figure 5.17, Closed valve injection, CPT2, air-atomisation, 1500 rev/min road load, X. = 1, (sample sites B & C)... 164
Figure 5.18, Open valve injection, CPTl, air-atomisation, 1500 rev/min road load, 1, (sample sites B & C)... 164
Figure 5.19, Open valve injection, CPT2, air-atomisation, 1500 rev/min road load, X, = 1, (sample sites B & C)... 164
Figure 5.20, CPTl bleed pressure, air-atomisation, 1500 road load, X, = 1... 165
Figure 5.21, CPT2 bleed pressure, air-atomisation, 1500 road load, X, = 1... 165
Figure 5.22, Closed valve injection, standard injector, 1500 rev/min road load, X. = 1, (sample site D)... 166
Figure 5.23, Open valve injection, standard injector, 1500 rev/min road load, X, = 1, (sample site D)... 166
Figure 5.24, Closed valve injection, air-atomisation, 1500 rev/min road load, X, = 1, (sample site D)... 167
Figure 5.26, Closed valve injection, fuel vaporisation, 1500 rev/min road load, A, = 1,
(sample site D)... 167 Figure 5.27, Open valve injection, fuel vaporisation, 1500 rev/min road load. A, = 1,
(sample site D)... 167 Figure 5.28, Typical exhaust HFRFID trace...169 Figure 5.29, Closed valve injection, standard injector, 1500 rev/min road load. A, = 1,
(sample site A)... 171 Figure 5.30, Open valve injection, standard injector, 1500 rev/min road load. A, = 1,
(sample site A)... 171 Figure 5.31, Closed valve injection, air-atomisation, 1500 rev/min road load. A, = 1,
(sample site A)... 171 Figure 5.32, Open valve injection, air-atomisation, 1500 rev/min road load. A, = 1,
(sample site A)... 171 Figure 5.33, Closed valve injection, fuel vaporisation, 1500 rev/min road load, X= 1,
(sample site A)... 171 Figure 5.34, Open valve injection, fuel vaporisation, 1500 rev/min road load. A, = 1,
(sample site A)... 171 Figure 5.35, Closed valve injection, CPTl, air-atomisation, 1500 rev/min road load. A, = 1, (sample site A)... 172 Figure 5.36, Open valve injection, CPTl, air-atomisation, 1500 rev/min road load. A, = 1, (sample site A)... 172 Figure 5.37, Closed valve injection, fuel vaporisation, 800 rev/min idle. A, = 1,
(sample sites C & D ) ... 174 Figure 5.38, Open valve injection, fuel vaporisation, 800 rev/min idle. A, = 1,
(sample sites C & D ) ... 174 Figure 5.39, Closed valve injection, fuel vaporisation, 800 rev/min idle. A, = 1,
(sample sites B & C)... 174 Figure 5.40, Open valve injection, fuel vaporisation, 800 rev/min idle. A, = 1,
(sample sites B & C)... 174 Figure 5.41, Closed valve injection, CPTl, fuel vaporisation, 800 rev/min idle. A, = 1,
(sample sites B & C)... 176 Figure 5.42, Closed valve injection, CPT2, fuel vaporisation, 800 rev/min idle. A, = 1,
(sample sites B & C)... 176 Figure 5.43, Open valve injection, CPTl, fuel vaporisation, 800 rev/min idle, A. = 1,
(sample sites B & C)... 176 Figure 5.44, Open valve injection, CPT2, fuel vaporisation, 800 rev/min idle. A, = 1,
(sample sites B & C)... 176 Figure 5.45, CPTl bleed pressure, fuel vaporisation, 800 rev/min idle. A, = 1...177 Figure 5.46, CPT2 bleed pressure, fuel vaporisation, 800 rev/min idle. A, = 1...177 Figure 5.47, Closed valve injection, CPTl, air-atomisation, 800 rev/min idle. A, = 1,
(sample sites B & C)... 178 Figure 5.48, Closed valve injection, CPT2, air-atomisation, 800 rev/min idle. A, = 1,
(sample sites B & C)... 178 Figure 5.49, Open valve injection, CPT2, air-atomisation, 800 rev/min idle. A, = 1,
(sample sites B & C)... 178 Figure 5.50, Open valve injection, CPT2, air-atomisation, 800 rev/min idle. A, = 1,
(sample sites B & C)... 178 Figure 5.51, CPTl bleed pressure, air-atomisation, 800 rev/min idle, A. = 1 ...179 Figure 5.52, CPT2 bleed pressure, air-atomisation, 800 rev/min idle, X = 1 ... 179 Figure 5.53, Closed valve injection, standard injector, 800 rev/min idle, A.= 1,
Figure 5.55, Closed valve injection, air-atomisation, 800 rev/min idle, X, = 1,
(sample site D)... 180
Figure 5.56, Open valve injection, air-atomisation, 800 rev/min idle, X, = 1, (sample site D)... 180
Figure 5.57, Closed valve injection, fuel vaporisation, 800 rev/min idle, 1 = 1 , (sample site D)... 180
Figure 5.58, Open valve injection, fuel vaporisation, 800 rev/min idle, X. = 1, (sample site D)... 180
Figure 5.59, Closed valve injection, standard injector, 1650 rev/min full load, 13.5:1 AFR, (sample sites B & C)... 182
Figure 5.60, Open valve injection, standard injector, 1650 rev/min full load, 13.5:1 AFR, (sample sites B & C)... 182
Figure 5.61, Closed valve injection, CPT2, air-atomisation, 1650 rev/min full load, 13.5:1 AFR (sample sites B & C)...183
Figure 5.62, Open valve injection, CPT2, air-atomisation, 1650 rev/min full load, 13.5:1 AFR (sample sites B & C)...183
Figure 5.63, Closed valve injection, CPT2, fuel vaporisation, 1650 rev/min full load, 13.5:1 AFR (sample sites B & C)...183
Figure 5.64, Open valve injection, CPT2, fuel vaporisation, 1650 rev/min full load, 13.5:1 AFR (sample sites B & C)...183
Figure 5.65, CPT2 bleed pressure, air-atomisation, 1650 rev/min full load, 13.5:1 AFR... 184
Figure 6.1, Engine test. Open valve injection, standard injector, 800 rev/min idle 194 Figure 6.2, Engine test. Closed valve injection, standard injector, 800 rev/min idle 194 Figure 6.3, Engine test. Open valve injection, air-atomisation, 800 rev/min idle...195
Figure 6.4, Engine test. Closed valve injection, air-atomisation, 800 rev/min idle 195 Figure 6.5, Engine test. Open valve injection, vaporised fuel, 800 rev/min idle...195
Figure 6.6, Engine test. Closed valve injection, vaporised fuel, 800 rev/min idle...195
Figure 6.7, PFR test. Closed valve injection, standard injector, 800 rev/min idle...196
Figure 6.8, PFR test. Closed valve injection, standard injector, 800 rev/min idle...196
Figure 6.9, PFR test. Open valve injection, air-atomisation, 800 rev/min idle... 197
Figure 6.10, PFR test. Closed valve injection, air-atomisation, 800 rev/min idle... 197
Figure 6.11, PFR test. Open valve injection, vaporised fiiel, 800 rev/min idle...197
Figure 6.12, PFR test. Closed valve injection, vaporised fuel, 800 rev/min idle... 197
Figure 6.13, Engine test. Open valve injection, standard injector, 1500 rev/min road load... 200
Figure 6.14, Engine test. Closed valve injection, standard injector, 1500 rev/min road load... 200
Figure 6.15, Engine test. Open valve injection, air-atomisation, 1500 rev/min road load... 200
Figure 6.16, Engine test. Closed valve injection, air-atomisation, 1500 rev/min road load 200 Figure 6.17, Engine test. Open valve injection, vaporised fiiel, 1500 rev/min road load.... 200
Figure 6.18, Engine test. Closed valve injection, vaporised fuel, 1500 rev/min oad load.... 200
Figure 6.19, PFR test. Open valve injection, standard injector, 1500 rev/min road load 201 Figure 6.20, PFR test. Closed valve injection, standard injector, 1500 rev/min road load ..201
Figure 6.21, PFR test. Open valve injection, air-atomisation, 1500 rev/min road load 202 Figure 6.22, PFR test. Closed valve injection, air-atomisation, 1500 rev/min road load 202 Figure 6.23, PFR test. Open valve injection, vaporised fuel, 1500 rev/min road load 202 Figure 6.24, PFR test. Closed valve injection, vaporised fuel, 1500 rev/min road load 202 Figure 6.25, Engine test. Open valve injection, standard injector, 1650 rev/min full load... 203
Figure 6.26, Engine test. Closed valve injection, standard injector, 1650 rev/min full load 203 Figure 6.27, Engine test. Open valve injection, air-atomisation, 1650 rev/min full load.... 204
Figure 6.30, Engine test. Closed valve injection, vaporised ftiel, 1650 rev/min full load. .. 204
Figure 6.31, PFR test. Open valve injection, standard injector, 1650 rev/min full load...205
Figure 6.32, PFR test. Closed valve injection, standard injector, 1650 rev/min full load. .. 205
Figure 6.33, PFR test. Open valve injection, air-atomisation, 1650 rev/min full load...205
Figure 6.34, PFR test. Closed valve injection, air-atomisation, 1650 rev/min full load...205
Figure 6.35, PFR test. Open valve injection, vaporised fuel, 1650 rev/min full load...205
Figure 6.36, PFR test. Closed valve injection, vaporised fuel, 1650 rev/min full load...205
Figure 7.1, Motored start unbumed exhaust hydrocarbon concentration vs. time after injector enabled, standard injector, 800 rev/min, open valve injection, 10.5:1 air/fiiel ratio... 214
Figure 7.2, Motored start unbumed exhaust hydrocarbon concentration vs. time after injector enabled, standard injector, 800 rev/min, closed valve injection, 10.5:1 air/fael ratio... 214
Figure 7.3, Motored start unbumed exhaust hydrocarbon concentration vs. time after injector enabled, standard injector, 800 rev/min, open valve injection, 11.5:1 air/fuel ratio... 214
Figure 7.4, Motored start unbumed exhaust hydrocarbon concentration vs. time after injector enabled, standard injector, 800 rev/min, closed valve injection, 11.5:1 air/fuel ratio 214 Figure 7.5, Motored start unbumed exhaust hydrocarbon concentration vs. time after injector enabled, standard injector, 800 rev/min, open valve injection, 12.5:1 air/fuel ratio 214 Figure 7.6, Motored start unbumed exhaust hydrocarbon concentration vs. time after injector enabled, standard injector, 800 rev/min, closed valve injection, 12.5:1 air/fuel ratio 214 Figure 7.7, Motored start unbumed exhaust hydrocarbon concentration vs. time after injector enabled, air-atomisation, 800 rev/min, open valve injection, 10.5:1 air/fuel ratio... 216
Figure 7.8, Motored start unbumed exhaust hydrocarbon concentration vs. time after injector enabled, air-atomisation, 800 rev/min, closed valve injection, 10.5:1 air/fuel ratio 216 Figure 7.9, Motored start unbumed exhaust hydrocarbon concentration vs. time after injector enabled, air-atomisation, 800 rev/min, open valve injection, 11.5:1 air/fuel ratio... 216
Figure 7.10, Motored start unbumed exhaust hydrocarbon concentration vs. time after injector enabled, air-atomisation, 800 rev/min, closed valve injection, 11.5:1 air/fuel ratio 216 Figure 7.11, Motored start unbumed exhaust hydrocarbon concentration vs. time after injector enabled, air-atomisation, 800 rev/min, open valve injection, 12.5:1 air/fuel ratio... 216
Figure 7.12, Motored start unbumed exhaust hydrocarbon concentration vs. time after injector enabled, air-atomisation, 800 rev/min, closed valve injection, 12.5:1 air/fuel ratio 216 Figure 7.13, Motored start unbumed exhaust hydrocarbon concentration vs. time after injector enabled, fuel vaporisation, 800 rev/min, open valve injection, 13.5:1 air/fuel ratio 218 Figure 7.14, Motored start unbumed exhaust hydrocarbon concentration vs. time after injector enabled, fuel vaporisation, 800 rev/min, closed valve injection, 13.5:1 air/fuel ratio 218 Figure 7.15, Motored start unbumed exhaust hydrocarbon concentration vs. time after injector enabled, fuel vaporisation, 800 rev/min, open valve injection, stoichiometric air/fuel ratio... 218
Figure 7.16, Motored start unbumed exhaust hydrocarbon concentration vs. time after injector enabled, fuel vaporisation, 800 rev/min, closed valve injection, stoichiometric air/fuel ratio... 218
Figure 7.17, Typical UHC decay after injector intermpt, raw data & curve fit, standard injector, closed valve injection, stoichiometric fuelling... 220
Figure 7.18, Typical UHC decay after injector intermpt, raw data & curve fit, air-atomisation, closed valve injection, 800 rev/min, stoichiometric fuelling... 220
Figure 7.19, Typical UHC decay after injector intermpt, raw data & curve fit, vaporised fuel, closed valve injection, 800 rev/min, stoichiometric fuelling... 220
Figure 7.20, UHC decay after injector intermpt, exponential decay curve fit, standard injector, closed valve injection, 800 rev/min, stoichiometric fuelling... 222
Figure 7.24, Calculated cumulative UHC, air-atomisation, closed valve injection, 800 rev/min,
stoichiometric fuelling... 222
Figure 7.25, Calculated cumulative UHC, vaporised fuel, closed valve injection, 800 rev/min, stoichiometric fuelling... 222
Figure A7.1, UHC decay after injector interrupt, exponential decay curve fit, standard injector, open valve injection, 800 rev/min, stoichiometric fuelling...226
Figure A7.2, UHC decay after injector interrupt, ejqwnential decay curve fit, air-atomisation, open valve injection, 360 mm Hg manifold pressure (absolute), 800 rev/min, stoichiometric fuelling... 226
Figure A7.3, UHC decay after injector interrupt, ejqx>nential decay curve fit, vaporised fuel, open valve injection, 800 rev/min, stoichiometric fuelling... 226
Figure A7.4, Calculated cumulative UHC, standard injector, closed valve injection, 800 rev/min, stoichiometric fuelling...226
Figure A7.5, Calculated cumulative UHC, air-atomisation, open valve injection, 800 rev/min, stoichiometric fuelling... 226
Figure A7.6, Calculated cumulative UHC, vaporised fuel, open valve injection, 800 rev/min, stoichiometric fuelling... 226
Figure A8.1, Circuit diagram for glow plug modulation... 235
Figure A8.2, Glow plug driver circuit...236
LIST OF TABLES Table 1.1, Atmospheric pollutant levels and their sources... 8
Table 1.2, California exhaust emissions standards...10
Table 1.3, FTP driving schedule summary...11
Table 1.4, Cold-start emissions with preheated catalyst and air injection... 14
Table 1.5, Comparative results for the emissions during Bag 1, Cycle 1 of the FTP Drive Cycle...16
Table 1.6, FTP cold-start hydrocarbon collection... 20
Table 1.7, Liquid spray droplet distribution...52
Table 2.1, AAFV exit nozzle air mass flow rates for idle and 1500 rev/min road load... 90
Table 2.2, Energy balance results for 1.2 mm & 1.5 mm nozzles at idle and 1500 rev/min road load... 92
Table 2.3, 1.2 mm nozzle diameter mass flow rates, measured & calculated at idle and 1500 rev/min road load... 94
Table 2.4, 1.2 mm nozzle diameter nozzle mixture mass flow rates at idle and 1500 rev/min road load, measured & calculated (using a calculated value of y for the mixture)... 96
Table A2.1, Glow plug temperature vs. applied power, 30 mm glow plug heated in quiescent a ir...103
Table A2.2, Glow plug temperature vs. applied power, 20 mm glow plug heated in quiescent a ir...104
Table A2.3, Glow plug e?q>ansion vs. applied power, 30 mm glow plug heated in quiescent a ir...105
NOMENCLATURE
General abbreviations
AAFV air-assisted fuel vaporiser
ABDC after bottom dead centre
ADC analogue-to-digital converter
AFR air/fuel ratio
ATDC after top dead centre
BBDC before bottom dead centre
BDC bottom dead centre
BMEP brake mean effective pressure
BTDC before bottom dead centre
CA crank angle
CCD charge coupled device
CD carbon monoxide
CÜ2 carbon dioxide
COV coefficient of variation
e u control unit
Dev Aid development aid
EC Eurq>ean Community
ECEP2 Emissions Consortium Project Engine 2
ECU electronic control unit
EFE early fuel evaporation
EGI exhaust gas ignition
EGR exhaust gas recirculation
EHC electrically heated catalyst
EMS engine management system
EVC exhaust valve closure
EVO exhaust valve opening
FID flame ionisation detector
FTP Federal Test Procedure
HC hydrocarbon
IC internal combustion
IMEP indicated mean effective pressure
IR iffa-red absorption
IVC intake valve closure
IVO intake valve opening
LEV low emission vehicle
LD laser diffraction
LIF laser induced fluorescent
M Mach number
MBT minimum advance for best torque
NDIR noo-dispersive infra-red
NMHC non-methane hydrocarbons
NO nitric oxide
NO2 nitrogen dioxide
pC pico coulomb
PC personal computer
PDA phase-doppler anemometry
Pr Prandtl number
PTC positive temperature coefficient
Re reynolds number
SAE Society of Automotive Engineers
SI spark ignition
Smd Sauter mean diameter
TDC top dead centre
tml terminal
ULEV ultra low emission vehicle
UHC unbumed hydrocarbon
Symbols
A area
c . coefficient of discharge
Cp specific heat capacity at constant pressure
Cv specific heat capacity at constant volume
E energy of system
y ratio of specific heats, Cp/Cv
h specific, molar enthalpy
H enthalpy
id internal diameter
the latent heat of evaporation
m mass flow rate
Q net heat per unit mass
R gas constant
u specific, molar internal energy
U internal energy
9Î universal, molar gas constant
W work
V velocity
CO molecular weight
X upper limit of glow plug expansion
Subscripts
1 upstream
2 downstream
a air
f fuel
m mixture
CHAPTER 1
CHAPTER 1
A LITERATURE SURVEY
1.1 INTRODUCTION
The internal combustion engine has now been subjected to over a century of
continuous development and its accessibility to the general public has changed
substantially. The dramatic increase in vehicle ownership has focused attention on the
environmental impact of automobile use and necessitated legislation to curb toxic
emissions. Legislation was first introduced in America with the 1966 Clean Air Act in
an effort to combat growing pollution problems. Legislative control was later
adopted by European countries which, in conjunction with spiralling petrol prices
throughout the 1970s, forced the engine designer to strive for ‘clean’, fiiel efficient
power plants.
With increasingly stringent engine emission control, research work now extends to all
processes involved in IC engine operation. Mixture preparation, combustion and
exhaust gas treatment are all required to interact harmoniously if proposed emission
levels for the end of the century and beyond are to be met.
In an attempt to reduce the problems associated with both cold-start emissions and
mixture preparation an air assisted fuel vaporiser, AAFV, has been designed to
replace the existing port mounted fuel injector. The device is able to produce
vaporised fuel during start-up conditions by incorporating an electrical heating
element which may be switched off once the catalyst has reached its light-off
temperature. Air assistance has been incorporated into the design to ensure good
atomisation o f the liquid fuel when operating with the heating element disabled.
The following literature survey was undertaken to gain knowledge of alternative
systems aimed at addressing the areas o f cold-start emissions and mixture preparation
1.2 FOUR-STROKE SI ENGINE ANALYSIS
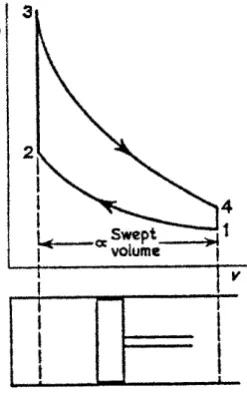
The most common form of automotive power plant is based on the four-stroke Otto
cycle. Figure 1.1 indicates the idealised four non-flow processes which form one
complete cycle.
Figure 1.1
The Otto cycle, from Rogers & Mayhew, 1980
1-2 Air is compressed isentropically through a volume ratio,
known as the compression ratio, r^. 2-3 Heat is added at constant volume
until the air is at state 3.
3-4 The air is expanded isentropically to the original volume.
4-1 Heat is rejected at constant volume until the cycle is completed.
Swept volume
Assuming an ideal cycle and constant ratio o f specific heats (y) for air, the efficiency
{rj) of the Otto cycle may be expressed in terms of its compression ratio as:
7 7= 1
-1
.r-i equation 1.1
To maximise the thermal efficiency o f a spark ignition engine, it is desirable for
combustion to occur when the piston is at top dead centre, TDC, coinciding with the
minimum volume within the combustion chamber. Restrictions exist due to the finite
during the compression stroke is too large while late combustion reduces the peak
cylinder pressure, decreasing the work transfer from the gas to the piston during the
expansion stroke. Engine efficiency is therefore dependent upon the optimum ignition
timing that achieves minimum advance for best torque, MBT, which is specific for
each engine operating condition of speed, mixture composition and load. Stone,
1992a.
At the instant of spark initiation, an arc is produced across the electrodes of the
sparking plug creating some active chemical species which, in turn, initiate the process
of combustion. Three phases of combustion exist, firstly the development phase, in
which the spherical flame kernel, formed around the sparking plug, evolves into a
highly wrinkled sheet due to air turbulence within the cylinder. Secondly, the
developed, ‘turbulent’ flame undergoes a rapid-burning phase during which most of
the mixture is burnt as the flame propagates across the combustion chamber. Finally,
the flame front is extinguished by the boundary layer at the cylinder walls, leaving a
thin layer of unburned gas which acts as an insulator to the combustion chamber and
protects the mechanical components from the peak gas temperatures which may reach
2800 K. Burn rates during the rapid-burning phase accelerate with in-cylinder
turbulence and the turbulence increases with engine speed. Combustion is usually
complete within 30-90° of crank angle rotation dependent upon operating conditions.
Turbulence is usually increased by generating in-cylinder gas motion, either swirling
or tumbling or a component o f each. Tumble refers to swirl that occurs about an axis
normal to that of the cylinder and is generally associated with four-valve engine
designs. Due to the increased flow area associated with this design, the kinetic energy
of the intake charge is insufficient to create significant in-cylinder turbulence at low
operating speeds. In addition, low inlet velocities encourage poor mixture
preparation since insufficient shear forces are present to atomise the fuel. Increased
wall wetting in the port can arise, due to the inlet tract division slowing fiiel
increased transient compensatory fiiel if lean excursions are to be avoided during this
operating period.
The four-valve engine is now favoured due to its superior volumetric efficiency at
high speed, however, designers of modern four-valve Otto cycle engines have to
address the problems of low inlet velocities at low speeds and increased fuel wetting
1.3 EMISSIONS, EMISSION REGULATIONS AND EXHAUST GAS
TREATMENT
1.3.1 Introduction
Combustion of hydrocarbon fuels produces three main types o f pollutants, unbumed
hydrocarbons (HC), oxides of nitrogen (NOx) and carbon monoxide (CO), in addition
to the basic products of combustion, namely carbon dioxide (CO2) and water. The
pollutant by-products form the majority of the emissions which fall under legislative
control. In order to tackle the problem, an understanding of the types of pollutants
formed and their formation processes is required.
1.3.2 HC: Pollutant
Hydrocarbon emissions, some o f which are known to be carcinogenic, are the
consequence of incomplete combustion. Photochemical smog may be produced if the
hydrocarbons mix with oxides of nitrogen under certain atmospheric conditions.
Typical levels of unbumed hydrocarbons present in the exhaust gas of a SI engine are
between 1 and 2.5 percent of the fuel flow into the engine, Heywood, 1988a.
1.3.3 HC: Formation
Four mechanisms exist for the production o f unburned hydrocarbons in SI engines:
(1) Flame quenching, at the walls o f the combustion chamber. As the flame front
propagates through the mixture, a thin layer o f hydrocarbons is left unbumed at the
comparatively cool cylinder wall due to the heat sink effect quenching the flame and
the relatively low rates of mass transfer that occur within the boundary layer.
(2) Crevice volumes acting as traps. Small crevice regions in the combustion
their seats, around the head gasket, and the largest region being between piston,
piston rings and cylinder wall. During compression, the pressure within the
combustion chamber forces unbumed mixture into these small crevices and the high
ratio of surface area to volume of these regions, cools the mixture. Throughout
combustion, this mixture remains largely unbumed and is released into the exhaust
gases as the cylinder pressure drops when the exhaust valves open.
(3) Fuel vapour absorption/desorption into the engine oil during compression and
expansion respectively, A thin layer o f engine lubricant is deposited on the cylinder
walls as the piston reciprocates. This oil film absorbs fuel vapour from the mixture
during the compression stroke. Throughout combustion and the ensuing expansion
stroke, the concentration of fuel vapour in the burning gases drops essentially to zero
and the cylinder pressure falls towards atmospheric leading to the desorption o f the
fuel vapour into the combustion products. Fuel vapour which desorbs late in the
cycle, when the bulk gas is relatively cool, does not oxidise and so contributes to
emissions o f unburned hydrocarbons.
(4) Incomplete combustion. Poor combustion quality can be caused by extinction of
the flame due to bulk quenching. Under certain conditions, the temperature o f the
unburned mixture can decrease to a low level during the expansion stroke. If this
temperature drop is sufihcient, the bum rate will decrease and the flame fi’ont may be
extinguished. Bulk quenching is more likely to occur when the residual gas fraction is
high due to either low speed, light load operating conditions or if the mixture is too
lean during throttle opening transients.
1.3.4 Oxides o f nitrogen (NOx): Pollutant
The predominant oxide of nitrogen, NOx, emission is nitric oxide, NO. NOx
pollutants are associated with respiratory illness such as asthma and can lead to acid
rain and chemical erosion most notably to ancient buildings and artwork. Goldsmith,
Table 1.1
Atmospheric pollutant levels and their sources
measured in a West German city, from Goldsmith, 1989
MfAhr.g Hifjienoi-3S P .a n t s
-.o itfK â ît/C .-'S 33 0 ?& 0 :C 4.'- fe C ;9 ) i ? 4 .0 49i
' ■’ C s !
O ' d e s ‘> 1 6 : 1 6 3 - i - s c {0431 7 10 361 3 7 |0 " i NOxt
C a fD o n
M onnxide 66 0 i6 40» ’ 3 6 n 131 0 4 tO 03» 2 1 0 ,1 741 ICO.
N 8 The fig u r e s g iv e n m b ra c k e ts are th e w e ig h t o f e n n s s io n s in m iih o n to n n e s p e r y e s r It i$ in te r e s tin g to n o te th a t N O x h a s in c r e a s e d fr o m 2 m illio n to n n e s m I960 to 3 m illio n to n n e s in 1982
1.3.5 NO formation
NO is formed as a consequence o f combustion in the IC engine as opposed to being
formed during combustion itself. The majority o f NO is produced in the post-flame
gases, with only a small percentage formed in the flame front itself due to the short
residence time o f the gas within the flame reaction zone at the high pressures
associated with IC engines Variation of
air/fuel ratio greatly affects NO formation
due to the changes o f in-cylinder
temperature and oxygen concentration, see
figure 1.2. The basic mechanisms of NO
formation are the dissociation o f nitrogen
and oxygen molecules to form atoms which
recombine to form NO. Higher combustion
temperatures lead to higher concentrations
o f NO. One method o f reducing NO
emissions is to recirculate exhaust gas
through the combustion chamber to act as a
thermal sink and thereby reduce the peak
temperature o f combustion
Figure 1.2
Variation of exhaust NO
concentration with air/fuel ratio. SI
engine, 1600 rev/min, MBT timing,
from Hey wood, 1988a
2(XX>
Fuel air equivalen ce ratio 0 4 O S n 75
\
1.3.6 NO: formation
NO2 is formed in the post-flame combustion process but, in general for SI engines,
chemical equilibrium, using the extended Zeldovich reactions, suggests that the ratio
o f NO2/NO is negligible for typical flame temperatures, Heywood, 1988a.
1.3.7 Carbon monoxide/dioxide: Emissions
Carbon monoxide, CO, is absorbed into the blood in preference to oxygen thereby
causing suffocation at high concentration levels. Lower concentrations tend to cause
drowsiness and headaches. Carbon dioxide, CO2, is formed in far greater quantities
than CO It is not toxic but it is one o f the ‘greenhouse’ gases which potentially can
lead to global warming.
1.3.8 CO o/CO formation
CO emissions from an IC engine
are primarily determined by the
air/fuel ratio. For rich of
stoichiometric mixtures, insufficient
air exists to achieve complete
combustion o f the fuel. This leads
to high CO concentrations in the
exhaust gases. Very little CO is
formed when mixtures are burnt
lean o f stoichiometric as excess
oxygen is present to convert CO to
CO2, see figure 1.3.
Figure 1.3
Variation of HC, CO and NO,
concentration in the exhaust of a
conventional SI engine with air/fuel ratio,
from Stone, 1992a
0 h
NO. MC
NO,
1.3.9 Emissions regulations
Limits for engine emissions are determined by legislative bodies. The most significant
recent challenge for the SI engine was stipulated by the Californian Air Research
Board (GARB) for introduction in 1997 which defined the Ultra Low Emissions
Vehicle (ULEV). The ULEV is described as one which produces a maximum of 0.20
g/mile of NOx, 1.70 g/mile CO and 0.40 g/mile of non-methane hydrocarbons
(NMHC), see table 1.2, which compares with the 1990 Clean Air Amendments Act,
which specified 0.41 g/mile for
NMHC, 1.00 g/mile NOx and
3.40 g/mile for CO. Wright,
1990, suggested that
increasingly strict legislation
was responsible for a 96% fall in
tail-pipe emissions since 1970 in
the US, excluding CO2, and a
doubling of fuel efficiency.
Table 1.2
California exhaust emissions standards,
from Heimrich, Albu & Osborn, 1991
Vehicle Exhaust Emissions, g/mi
I
-Category | nmog ! CO i NO* ' Adopted for 1993 ! 0.250 i 3.4 ■ 0.40 TLEV i 0.125 ; 3-4 i 0.40 LEV ! 0.075 ^ ^ 4 _ p .# ULEV 1 0.040 ^ 1 . 7 ~ 0^20
TLEV, LEV, ULEV standards adopted September 1990
Legislation in the form o f the EEC Council Directive 91/441/EEC, which came into
force at the end of 1992 as an amendment to Directive 87/76/EEC, required tail-pipe
emissions to be below 2.72 g/km CO and 0.97 g/km for HC and NOx combined. Tail
pipe emissions are those measured at the point of exhaust pipe exit to atmosphere as
opposed to ‘engine-out’ emissions which are measured in the exhaust manifold.
Consequently, these figures take into account the benefits of ancillary components
such as catalysts. The 1999 EC Directive, ECD3, closes the gap between Europe and
the United States by including an emissions test from -7°C, with sampling recorded
from cranking. 160,000 km catalyst durability also forms part o f the European test.
It is interesting to note at this point that in Europe a great deal o f pressure was
brought to bear on the member states of the EEC prior to the ‘Luxembourg
converters. Whilst there is little question of their capability in reducing emissions,
they were at the time subject to a number o f operational problems of misuse or mis-
fuelling and they require accurate stoichiometric engine fuelling to achieve satisfactory
conversion levels and avoid contamination. Instead the ‘lean bum’ engine was
proposed, offering a more elegant and cost-effective solution. It had potential for
excellent fuel economy, lifetime durability for emission control and decreased CO2
formation, the main contributor to global warming. However, agreement was
eventually reached between the Council of Ministers to press towards standards in hne
with those already adopted in the States which has inevitably led to the adoption of
catalytic converters.
Testing o f vehicle emission performance is achieved using a certified drive cycle and
chassis dynamometer. In the United States this operating cycle is known as the
Federal Test Cycle, FTP. The FTP uses a 1372-second duration urban driving cycle
divided into two segments, a 505-second cold transient followed by an 867-second
cold stabilised portion. The vehicle is then subjected to a ten-minute soak to achieve
normal operating temperatures. A hot transient test of 505 seconds duration
completes the test. In order to study the effects on emissions due to the different
temperature regimes encountered throughout the test cycle, it is split into three ‘Bags’
for exhaust gas analysis. Bag 1 is
split further into Bags lA and IB,
representing the first 140 seconds
and the remaining 140-505 seconds
of the cold transient segment
respectively. The FTP driving
schedule with hot and cold transient
test segments is shown in figure 1.4.
The drive cycle duration, driving
distances and average speeds are
shown in table 1.3.
Table 1.3
FTP driving schedule summary, from
Heimrich, Albu & Osborn, 1991
Segment Duration, 1 seconds ;
Distance, miles
; Average : Speed,
miles/hr Transient
Phase 505 1 3.60 ; 25.7 Stabilized
Phase 867 1 3.90 1 16.2
Whilst the difficulties faced by the engine designer due to increasingly stringent
legislation become more severe, the benefits of enforced emissions legislation are
clear, though they pose tremendous technical challenges
Figure 1.4
FTP driving schedule showing test segments ,
from Heimrich, Albu & Osborn, 1991
c o in
■X:
2
.1
HOT T MAStSik S '
10-MIN
SOAK
1.3.10 Cold-start emissions
The first 140 seconds of the FTP cycle after the cold-start contributes some 70-80%
of the total tail pipe CO and HC emissions collected throughout the entire test. Hurley
et al. Section 1.3 .3 outlined the predominant causes of HC emissions in a fully warm
SI engine which are generally accentuated during cold-start and warm-up conditions,
whilst other factors unique to this period of engine operation add to the levels of HC
emissions.
Fuel enrichment is required in order to achieve steady combustion in a cold engine.
Combustion will only occur if a combustible mixture of fuel vapour and air are present
at the sparking plug at the time of spark initiation. When the engine is warm the
majority of fuel vaporisation occurs due to the spray impinging upon the back of the
inlet valves and hot intake port surfaces, however, under cold-start conditions the
metal surfaces are at ambient temperatures requiring that secondary processes such as
flash evaporation of the fuel’s light fractions and evaporation from wetted port
surfaces must be enough to produce sufficient fuel vapour. Consequently significant
warm-up with the effect that throughout this period high levels of unburned hydrocarbons
are emitted.
To compound the problem of cold-start
emissions still further, the exhaust
catalyst is ineffective until its iight-ofT
temperature has been reached. The term
light-off is most often used to describe
the temperature at which the catalyst
reaches 50% HC conversion efficiency,
typically 300-500°C, and as figure 1.5
shows, this normally occurs up to two
minutes after stable engine operation has
been achieved. Hurley et al, 1991.
Figure 1.5
Total HC emission and catalyst
temperature vs. time for Urban Drive
Cycle, from Hurley et al, 1991
6 ! ^ \ \ I
^ s o i — I 1---)--- 1 500 5
p I J N | g
3oj— --- --- ;3O0 ft
8 I I / V .---t o t a l K a
3--- 1 ” *’ I
= 0 1 2 3 4 5 6 7 6 9
y I mm ( m l n o t»% 5
1.3.11 Exhaust gas treatment
Electrically-heated catalysts (EHC) have been the subject of in-depth investigation to
reduce the period of low catalytic conversion, Hurley et al, 1991 and Heimrich, Albu
and Osborn, 1991. Heimrich, Albu and Osborn, investigated two different
configurations of electrically-heated catalysts, each being fitted to then current
production vehicles and subjected to the FTP emissions tests. Electrically-heated
catalysts are pre-heated prior to engine cranking to achieve temperatures sufficient for
catalytic activity from cranking, consequently reducing cold-start and warm-up
emissions. The catalyst may also be subjected to additional heating once the engine
has started in order to maintain a pre-set operating temperature. The duration of post
heating depends upon the location and size of the EHC.
Due to the cold-start enrichment, emissions of HC and CO are high with relatively
low concentrations of O2 present. O2 is required for satisfactory oxidation levels of
is to operate at its full potential though a detrimental effect on NOx emissions will be
incurred if either the volume flow rate o f air is too great, or it is supplied for an
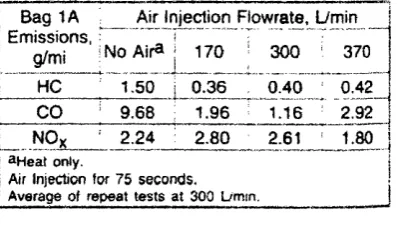
excessive period of time. Table 1.4 shows the results of altering the air flow rates
supplied to the EHC performed by Heimrich, Albu and Osborn, 1991, for the cold-
start portion of the FTP emissions tests. The researchers stated that the unexpectedly
low value of NOx at the highest air flow rates was presumed to be an anomaly, and
reported high scatter for the data collected. Catalyst cooling due to excess air was
thought to be the reason for the increase in CO levels at the highest air flow rates.
Emission levels of the vehicle measured during the FTP test cycle for both standard
and the EHC systems averaged reductions o f non-methane hydrocarbons (NMHC) of
up to 75% and 85% for CO are extremely impressive and approach the ULEV
emission levels, though the increase in NOx appears to be unavoidable. Concerns
include electrical power requirements as high as 3-8 kW, durability and the delay in
reaching operating temperature. Hurley et al, 1991, Anon, 1994a and Anon, 1994b.
Table 1.4
Cold-start emissions with preheated catalyst and air injection,
3.8 litre V-6, from Heimrich, Albu and Osborn, 1991
; Bag 1A A[r Injection Flowrate, L/min 'Em issions," ""1... ""'T.
? g/fpj IN oA iraj 170 ' 300 ’ 370
; HC 1.50 I 0.36 * 0.40 0.42
CO = 9.68 : 1.96 : 1.16 2.92 L NOx ' 2.24 2.80 2.61 ; 1.80
i &Heat only.
j Air Injection for 75 seconds. ! Average of repeat tests at 300 L/min,
Hurley et al, 1991, investigated the problem of durability but only looked as far as
4000 miles. The reduction in emission levels of both new and aged EHCs were
substantial when compared with the ‘baseline’ catalyst system, however, whilst the
aged catalyst still produced lower emission levels after aging than the baseline system
it suffered an increase of 115% of NMHC emissions and CO output rose by 250%.
160,000 km durability emissions tests. Hurley et al suggests that repositioning of the
EHC further downstream of the exhaust manifold and downstream of the three-way
catalyst may provide a level of protection from both exhaust contamination and high
exhaust temperatures, thereby increasing durability. This repositioning incurs
electrical power penalties due to the loss of exhaust gas heating which requires the
electrical power be maintained for a period of time after the engine has fired. The
current requirement averaged approximately 650W for a duration of 20 seconds when
pre-heating the catalyst and throughout the post-heating period.
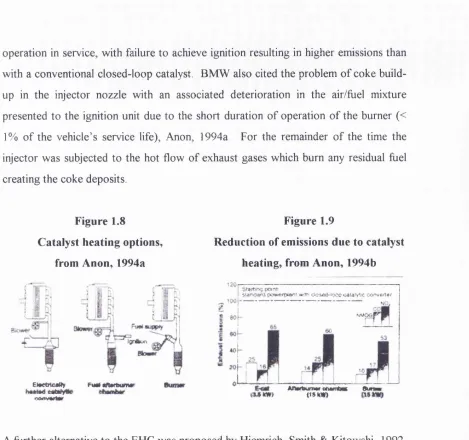
Ma, Collings and Hands, 1992, describe an alternative method for the rapid heating of
the exhaust catalyst known as Exhaust Gas Ignition (EGI). Operational catalyst
temperatures were reached by utilising an afterburner situated just upstream of the
catalyst, see figure 1.6. The engine was calibrated to run extremely rich to provide a
sufficiently flammable hydrogen concentration in the exhaust gas when mixed with an
auxiliary air supply pumped into the exhaust.
Figure 1.6
Schematic of EGI system, from Ma, Collings & Hands, 1992
addirlonal air
e x c e ss
f u e l
exhaust + air
Table 1.5
Comparative results for the emissions during Bag 1, Cycle 1 o f the FTP Drive
Cycle, from M a, Collings & Hands, 1992
grams/mile HC CO NO,
No EGI 4.1 31.3 2.4
With EGI 1.0 4.8 1.3
Reduction 76% 85% 54%
The rich fuelling excursion was required to achieve a flammable exhaust air/fuel ratio
such that ignition within the afterburner was achieved. Details of fuel mapping for the
cold-start and warm-up conditions were not disclosed, although light off time for the
catalyst was reduced from 100 seconds to 20 seconds indicating a rich excursion time
of approximately the same duration. Results recorded for Bag 1, Cycle 1 of the FTP
Drive Cycle show substantial reductions, see table 1.5, however, these gains are not
achieved without penalty. Heavy carbon deposits, increased roughness, poor fuel
economy and performance were cited by the authors as some of the adverse effects.
The arrangement also required a substantial volume of air pumped into the exhaust to
achieve reliable afterburner ignition, with the required flow rate equalling that o f the
engine air flow rate. Figure 1.7 shows the difficulties in achieving a flammable
exhaust mixture. Whilst this study was prompted by the expected durability failings of
EHCs no durability tests of the EGI system were discussed, in addition, there may be
problems of oil dilution and coke deposits due to the rich mixture required throughout
the initial period of operation which will adversely affect the engine’s longevity. The
afterburner required an idling period of 20 seconds to achieve catalyst light-off
temperatures. Anon, 1994a.
Both BMW and Mercedes Benz took the concept o f an exhaust burner further by the
use of a separate fiiel supply introduced to the exhaust system just upstream o f the
Figure 1.7
Flammability of cold exhaust/air mixture, from Ma, Collings & Hands, 1992
%;% flammable CO ool\
CO
C O
u H C
112 %
Oxygcjj % vo! a: afterburner - 1.25
12,00
02
H 2.25 !
I
- ;.5o
F.xri - A i r
E.v.
intallation required no modification of the engine’s operating strategy. Figure 1.9
shows the reduction of emissions, comparing a variety of catalytic converter heating
methods. The principal benefit of this system was the reduction in the energy
conversion efficiency when compared to an EHC. Whilst it may appear wasteful to
put neat fuel into the exhaust, burning it directly in the exhaust to provide heat allows
a higher heating efficiency than burning it in the combustion chamber, SI engines
operate at approximately 25% thermal efficiency which is then used drive the
alternator to provide electrical power, with an associated efficiency of some 75%,
before being used to power the heating elements within the EHC, One of the