1933
Effect Of The PPG Sampling Frequency Of An
IIR Filter On Heart Rate Variability Parameters
Jae Mok Ahn, Jeom Keun Kim
Abstract— Hear rate variability (HRV) is a noninvasive measure used to assess autonomic nervous system (ANS) activity and to predict cardiovascular diseases. Obtaining HRV parameters in the time and frequency domains from fast Fourier transform (FFT) analysis and a nonlinear analysis depends on obtaining an accurate normal-to-normal (NN) interval between two consecutive heartbeats in a time series. The accuracy of NN intervals is greatly affected by the sampling frequency of the infinite impulse response (IIR) filter, i.e., the number of photoplethysmogram (PPG) signals that are sampled per second. At present, changes in sampling frequency for PPG signals prior to obtaining NN intervals have not been studied to investigate how much they influence HRV parameters. Therefore, in this study, we evaluated the effect of sampling frequency on HRV parameters in the frequency, time, and nonlinear domains. Three sampling frequencies (1000 Hz, 500 Hz, and 250 Hz) were applied to obtain the HRV dataset using a PPG finger sensor. There were no significant differences between the two HRV datasets for sampling frequencies of 1000 Hz and 500 Hz, while there were slight differences between 1000 Hz and 250 Hz except for the pNN50 value. The correlation coefficient r was the highest (r=0.9647, p<0.0001) between the two tachograms obtained at 1000 Hz and 500 Hz, and it was a moderate value (r=0.3301, p<0.0001) between the tachograms obtained at 1000 Hz and 250 Hz. The results suggest that a sampling frequency lower than 500 Hz might lead to inaccurate HRV parameters for the HRV analysis, and consequently, a PPG sampling frequency of at least 500 Hz should be applied to a digital filter in assessing all HRV parameters.
Index Terms— Autonomic nervous system, heart rate variability, fast Fourier transform, photoplethysmogram, tachogram, infinite impulse response.
—————————— ◆ —————————
INTRODUCTION
Heart rate variability (HRV) has been widely used as a good indicator for the assessment of autonomic nervous system (ANS) imbalances based on low fluctuations in time between two successive heartbeats, which lead to psychological and cardiovascular diseases [1, 2, 3, 4]. The fluctuation is tightly regulated by the ANS, which consists of parasympathetic and sympathetic nerve branches. Activation of the sympathetic nerve branch increases heart rate, while activation of the parasympathetic nerve branch decreases heart rate, as the two branches are directly connected to the heart through a nerve pathway. The integration of sympathetic and parasympathetic activities with afferent signals from the baroreceptors generates changes in the normal-to-normal (NN) interval in the time series between two consecutive heartbeats. The heart rate tachogram reflects these changes, plotting a sequence of time intervals between heartbeats. The fluctuation in the tachogram is due to the synergistic action of the two branches of the ANS, which act in balance through neural, mechanical, humoral, and other physiological mechanisms [5, 6]. Consequently, this fluctuation means that the body is reacting optimally to changing external or internal stimuli [7]. By applying spectral, geometrical, and statistical analysis technologies to the tachogram, all HRV parameters are analyzed to evaluate ANS functions with the assumption that the NN interval tachogram was accurately obtained. To
obtain an accurate tachogram by measuring
photoplethysmogram (PPG)-based analog signals, requirements from the perspective of signal processing include
________________________
• Jae Mok, Ahn (corresponding author) is currently working as a professor in College of Software, Hallym University, South Korea. E-mail: [email protected]
• Jeom Keun, Kim is currently working as a professor in College of Software, Hallym University, South Korea. E-mail: jkim@hallym.
an advanced digital filter, a discrete-time signal that is constructed by uniformly sampling an analog PPG signal, and a sampling frequency, that is, the number of uniform time intervals in one second, which is normally specified in Hz. Many studies related to the design of digital filters and high resolution of discrete-time signals have attempted to improve the quality of HRV analysis [8, 9, 10, 11, 12]. However, studies related to the optimal electrocardiogram (ECG) sampling frequency have been attempted, while the acceptable PPG sampling frequency range required to ensure sufficient precision of NN intervals is still not understood [13, 14]. In this study, the purpose was to investigate to what extent changes in sampling frequency could affect all HRV parameters, and which parameters could be affected most, when NN intervals were measured with PPG technology. For this purpose, the PPG signals measured at a high 1 kHz sampling frequency as an original reference were downsampled to simulate measurement at 1 kHz, 500 Hz, and 250 Hz with an infinite impulse response (IIR) filter. The influence of the three different sampling frequencies of the PPG signal on frequency, time, and geometrical HRV parameters was studied. The results showed that a minimum sampling frequency greater than 500 Hz would be required for obtaining all HRV parameters with reasonable accuracy, and that a smaller sampling frequency than 500 Hz might result in slightly weaker high frequency components in the spectral analysis.
2
SYSTEM
IMPLEMENTATIONS
2.1 Butterworth IIR Filter
1934 specifications: a 0-dB ripple in the passband, an 80-dB
stopband attenuation, and passband and stopband frequencies of 0.8 Hz and 20 Hz, respectively. The Butterworth BPF enabled reduction of baseline drift and power-line interference in the PPG signals. For the design of a recursive IIR filter, a linear time invariant system based on a difference equation was used, as shown in equation (1),
y[n] = − ∑𝑁 𝑎[𝑘]𝑦[𝑛 − 𝑘]
𝑘=1 + ∑𝑀𝑘=0𝑏[𝑘]𝑥[𝑛 − 𝑘]. (1)
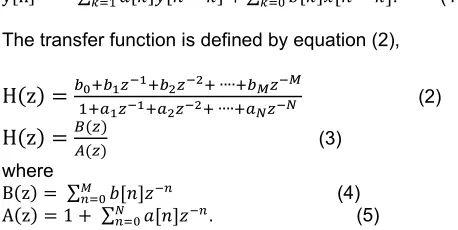
The transfer function is defined by equation (2),
H(z) =
𝑏0+𝑏1𝑧−1+𝑏2𝑧−2+ ∙∙∙∙+𝑏𝑀𝑧−𝑀 1+𝑎1𝑧−1+𝑎2𝑧−2+ ∙∙∙∙+𝑎𝑁𝑧−𝑁 (2)
H(z) =
𝐵(𝑧)𝐴(𝑧) (3)
where
B(z) = ∑𝑀 𝑏[𝑛]𝑧−𝑛
𝑛=0 (4)
A(z) = 1 + ∑𝑁 𝑎[𝑛]𝑧−𝑛
𝑛=0 . (5)
The bilinear transformation that transforms the s-domain to the z-domain is defined by equation (6),
s =
2 𝑇1−𝑧−1
1+𝑧−1 , where T = sampling period. (6)
All coefficients of the Butterworth BPF for the three different sampling frequencies (1000 Hz, 500 Hz, and 250 Hz) are provided in Table 1. They were calculated using MATLAB (2014b; MathWorks Inc., Natick, MA, USA), and the details of the methodology were provided in our previous study [15].
Table 1. IIR BPF coefficients for the Butterworth BPF for each sampling frequency (fs).
Coefficients fs = 1000 Hz fs = 500 Hz fs = 250 Hz B[z] b0 0.00334894 0.00308602 0.01145082 b1 0.00000000 0.00000000 0.00000000 b2 -0.00669788 -0.00617203 -0.02290164 b3 0.00000000 0.00000000 0.00000000 b4 0.00334894 0.00308602 0.01145082 A[z] a0 1.00000000 1.00000000 1.00000000 a1 -3.82854718 -3.83439915 -3.66597653 a2 5.50034780 5.51815832 5.05449352 a3 -3.51495413 -3.53292690 -3.10959869 a4 0.84315388 0.84916874 0.72110356
2.2 HRV Analysis
To obtain the frequency domain HRV parameters, the fast Fourier transform (FFT) was used to determine three spectral frequency bands that reflect ANS activity in the HRV dataset: very low frequency (VLF), low frequency (LF), and high frequency (HF). The VLF band is less clearly defined than the LF and HF bands, but the VLF power has been reportedly related to thermoregulation, the renin-angiotensin system, and other hormonal factors [16]. The low frequency spectrum is the LF power that represents a fair approximation of sympathetic activity. The high frequency spectrum is the HF power that reflects vagal or parasympathetic activity. The frequency domain HRV parameters of Ln HF, Ln LF and Ln VLF were calculated in real time by using the following equations:
Ln HF=𝑙𝑛 ∫ |𝑋(𝑓)𝑏 2|𝑑𝑓
𝑎 (7)
Ln LF=𝑙𝑛 ∫ |𝑋(𝑓)𝑑 2|𝑑𝑓
𝑐 (8)
Ln VLF=𝑙𝑛 ∫ |𝑋(𝑓)𝑓 2|𝑑𝑓
𝑒 (9)
HF norm = HF/(LF+HF)*100 (10) LF norm = LF/(LF+HF)*100 (11)
where the HF band is the activity between a=0.15 and b=0.4 Hz, the LF band is the activity between c=0.04 and d=0.15 Hz, and the VLF band is the activity between e=0.0033 and f=0.04 Hz. The power spectrum, X(f) was calculated as the squared magnitude of the FFT results. Details were reported in our previous study [17]. To compare all HRV parameters between three sampled HRV datasets, linear and nonlinear time domain parameters were calculated as well. These parameters were obtained mainly from the SDNN, the standard deviation of all the NN intervals in the 5 min HRV recording. Simple time domain parameters included the mean NN interval, the mean heart rate, and the difference between the longest and shortest NN intervals. Explanations of the RMSSD, HRV index, SDSD, TINN, CVAA, and pNN50 are shown in Table 2. The mathematical equations for the SDNN, RMSSD, SDSD, and pNN50 are as follows:
SDNN=√∑ (𝑁𝑁𝑛−𝑁𝑁) 2 𝑁−1
𝑛=1
𝑁−1 (12)
RMSSD=√ 1
𝑁−1∑ [𝑁𝑁𝑛− 𝑁𝑁𝑛−1]
2 𝑁−1
1 (13)
SDSD=√∑(𝑁𝑁𝑑𝑖𝑓𝑓−𝑁𝑁𝑑𝑖𝑓𝑓) 2
𝑁−1 (14)
NN50 count = (|𝑁𝑁𝑛− 𝑁𝑁𝑛−1| > 50𝑚𝑠) (15)
pNN50 = NN50 count/beat count *100 (16) where NNdiff=NNn-NNn-1.
Table 2. Explanation of HRV parameters
TP ms2 Area under the entire power spectrum curve, VLF+LF+HF
Ln VLF ms2 Natural logarithmic value of very low frequency power, bands of 0.0033-0.04 Hz
Ln LF ms2 Natural logarithmic value of low frequency power, bands of 0.04-0.15 Hz
Ln HF ms2 Natural logarithmic value of high frequency power, bands of 0.15-0.40 Hz
LF norm nu Normalized low frequency power HF norm nu Normalized high frequency power Ln LF/Ln HF Ratio of the low to high frequency power CVAA % Coefficient of variation of the AA intervals TINN ms Baseline width of the minimum square difference
triangular interpolation of the highest peak on the NN interval histogram
ApEn Approximate entropy
SD1 ms One standard deviation of the length of the transverse line on the Poincare plot
SD2 ms Two standard deviation of the length of the longitudinal line on the Poincare plot
SDNN ms The standard deviation of all NN intervals RMSSD ms The square root of the mean of the sum of the
squares of differences between adjacent NN intervals
SDSD ms The standard deviation of the differences between adjacent NN intervals
HRV index ms The integral of the density distribution divided by the maximum of the density distribution
1935 taken from a stationary signal [18]. The remaining parameters
were calculated with the following equations.
SD1 = √𝑣𝑎𝑟(𝑥1) , x1 =𝑁𝑁(𝑛+1)−𝑁𝑁(𝑛)
√2 (17)
SD2 = √𝑣𝑎𝑟(𝑥2) , x2 =𝑁𝑁(𝑛+1)+𝑁𝑁(𝑛)
√2 (18)
Ln sArea = ln( 𝜋 × 𝑆𝐷1 × 𝑆𝐷2) (19)
ApEn(m, r) = 𝜋𝑚(𝑟) − 𝜋𝑚+1(𝑟) (20)
𝜋𝑚(𝑟) = 1
𝑁−𝑚+1∑ lo g[𝐶𝑖
𝑚(𝑟)] 𝑁−𝑚+1
𝑖=1 (21)
𝐶𝑖𝑚= 𝐵𝑖(𝑟)
(𝑁−𝑚+1) (22)
𝐵𝑖(𝑟) = 𝑑[𝑥(𝑖), 𝑥(𝑗)] ≤ 𝑟 (23)
d[x(i), x(j)] = max
𝑘=1,2,…,𝑚(|𝑢(𝑖 + 𝑘 − 1) − 𝑢(𝑗 + 𝑘 − 1)|) (24)
CVAA% = SDNN/mean NN intervals *100 (25)
3 MEASUREMENTS
Three 5-minute HRV recordings of a photoplethysmogram (PPG) were simultaneously obtained using a commercial pulse analyzer with a finger-type sensor, TAS9VIEW (CANOPY9 RSA, IEMBIO Co. Ltd., Chuncheon-si, South Korea). Three devices were separately programmed into a microcontroller (MSP430F6638, Texas Instrument, Texas, USA) with a 12-bit analog-to-digital converter for implementation of an IIR filter; one was programmed to have a sampling frequency of 1000 Hz, the second was programmed to have a sampling frequency of 500 Hz, and the third was programmed to have a sampling frequency of 250 Hz. While the NN intervals were being measured, the participant was not allowed to move or talk. It was not important in this study to check the participant’s health status because the purpose of the study was to investigate the HRV parameters that affect sampling frequency.
4 RESULTS
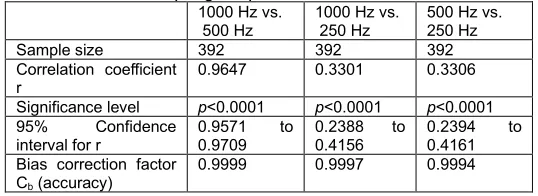
The correlations between three tachograms (n=392) that were obtained separately with sampling frequencies of 1000 Hz, 500 Hz, and 250 Hz are displayed in Table 3. The correlation coefficient r was the highest (r=0.9647, p<0.0001) in the comparison between the tachograms sampled at 1000 Hz and 500 Hz. For the tachograms sampled at 1000 Hz and 250 Hz, r showed a moderate value of r=0.3301 with a significance level of p<0.0001, and the same is true of the comparison between tachograms sampled at 500 Hz and 250 Hz. The bias correction factor (Cb) represents how far the best-fit line deviates from the 45o line through the origin and can be interpreted as a measure of accuracy. Cb decreased with decreasing sampling frequency, which means lowering the sampling frequency lowered the accuracy of the tachogram. All HRV parameters in the frequency and time domains, including the nonlinear domain, that were calculated from the three HRV datasets with different sampling frequencies (1000 Hz, 500 Hz, and 250 Hz) for the entire 5 min recording are displayed in Table 4. HRV parameters in the time domain had the same values of mean HR (78 bpm), mean RR (765 ms), max. bpm (86 bpm), and min. bpm (70 bpm) for the three HRV datasets. There were no significant differences between 1000 Hz and 500 Hz for the SDNN, RMSSD, or pNN50, which are widely used as parameters for evaluating ANS activity, while there were significant differences between 1000 Hz and 250 Hz for the pNN50. The NN50 count was only one in HRV datasets sampled at 1000 Hz and 500 Hz, but it was four in the HRV dataset sampled at 250 Hz, showing a fourfold
increase for the 250 Hz dataset over the others. Moreover, there were no significant differences between the three HRV datasets for nonlinear parameters, such as SD1, SD2, SD2/SD1, Ln sArea, SDSD, TINN, and ApEn. For frequency domain HRV parameters, the numerical value of the HF bands had a slight decrease with decreasing sampling frequency, for example, 77.81 for 1000 Hz, 75.49 for 500 Hz, and 72.56 for 250 Hz, and the remaining parameters showed no significant differences between the three HRV datasets.
Table 3. Statistics for comparing three tachograms obtained at three different sampling frequencies
1000 Hz vs. 500 Hz
1000 Hz vs. 250 Hz
500 Hz vs. 250 Hz
Sample size 392 392 392
Correlation coefficient r
0.9647 0.3301 0.3306 Significance level p<0.0001 p<0.0001 p<0.0001 95% Confidence
interval for r
0.9571 to 0.9709
0.2388 to 0.4156
0.2394 to 0.4161 Bias correction factor
Cb (accuracy)
0.9999 0.9997 0.9994
Table 4. All HRV parameters calculated from three HRV datasets with three different sampling frequencies: 1000 Hz, 500 Hz, and 250 Hz.
1000 Hz 500 Hz 250 Hz Unit
Beat count 392 392 392
Mean HR 78 78 78 bpm
Mean NN 765 765 765 ms
Max. bpm 86 86 86 bpm
Min. bpm 70 70 70 bpm
Max.-min. bpm 16 16 16 bpm
SDNN 22.90 22.77 23.10 ms
RMSSD 20.27 20.12 21.16 ms
HRV index 6.88 5.94 6.22 ms
pNN50 0.26 0.26 1.02 %
NN50 count 1 1 4
CVAA 2.99 2.97 3.02 %
Mode HR 79 76 77 bpm
Mode NN 756 780 770 ms
Mode count 57 66 63
SD1 14.35 14.25 14.98 ms
SD2 28.92 28.80 28.91 ms
SD2/SD1 2.02 2.02 1.93
Ln sArea 7.17 7.16 7.22 ms2
SDSD 20.24 20.10 21.14 ms
TINN 132 131 132 ms
ApEn 1.1305 1.1524 1.1323
TP 177.23 177.09 172.92 ms2
VLF 81.63 83.58 83.78 ms2
LF 17.79 18.03 16.58 ms2
HF 77.81 75.49 72.56 ms2
Ln LF/Ln HF 0.66 0.67 0.66
LF norm 18.60 19.28 18.60 %
HF norm 81.40 80.72 81.40 %
pVLF 46.06 47.20 48.45 %
pLF 10.04 10.18 9.59 %
pHF 43.91 42.62 41.96 %
Ln TP 5.18 5.18 5.15 ms2
Ln VLF 4.40 4.43 4.43 ms2
Ln LF 2.88 2.89 2.81 ms2
Ln HF 4.35 4.32 4.28 ms2
1936 and 500 Hz, and at 1000 Hz and 250 Hz, respectively.
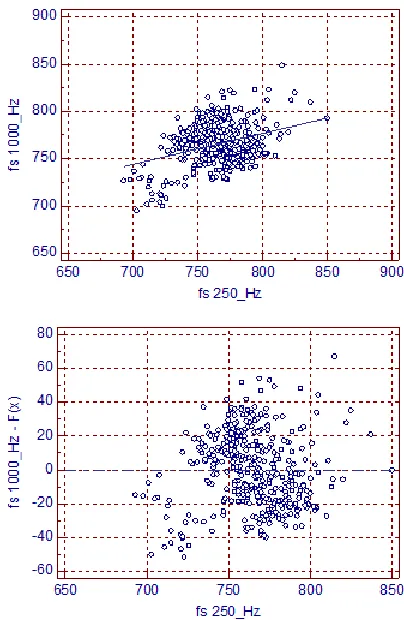
Regression equations for the relationships between the 1000-Hz and 500-1000-Hz data and between the 1000-1000-Hz and 250-1000-Hz data were y = 0.9701x + 22.6983 and y = 0.3269x + 515.3840, respectively. The slope of the line of best fit for the relationship between the 1000-Hz and 500-Hz data was 0.9701, very close to 1; in contrast, the slope of the line of best fit for the relationship between the 1000-Hz and 250-Hz was 0.3269.
Fig. 1. A box-and-whisker plot comparing three tachograms according to different sampling frequencies.
Fig. 2. Scatter diagrams of the relationship between two HRV datasets obtained at sampling frequencies of 1000 Hz and 500 Hz.
Fig. 3. Scatter diagrams of the relationship between two HRV datasets obtained at sampling frequencies of 1000 Hz and 250 Hz.
5
CONCLUSION
We investigated the effect of changes in the sampling frequency of an IIR Butterworth BPF on HRV parameters in the frequency, time, and nonlinear domains. In this study, it was assumed that one of many factors that determines the performance of the HRV analyzer used in clinical applications is the sampling frequency, the frequency with which a PPG analog signal is sampled and captured by a microcontroller. The results demonstrated that there were no significant differences among all HRV parameters obtained from two HRV datasets at sampling frequencies of 1000 Hz and 500 Hz and that a sampling frequency lower than 500 Hz might lead to inaccurate HRV parameters for the HRV analysis. However, the advantages of low sampling frequency include characteristics of signals that are not vulnerable to noise, low calculation time, and low power consumption, when various digital filters and advanced signal processing were embedded into the microcontroller. A sampling frequency higher than 500 Hz is recommended for evaluating all HRV parameters for the HRV analysis, resulting in obtaining complete discrete time signals for an analog PPG waveform. In the future, various sampling frequencies will be investigated to select an optimal sampling frequency that is robust to motion artifacts, which is appropriate for the environmental conditions in which a PPG measurement is made.
A
CKNOWLEDGMENT1937
R
EFERENCES[1] P.T. Ahamed Seyd, V.I. Thajudin Ahamed, J. Jeevamma, J.K. Paul, “Time and frequency domain analysis of heart rate variability and their correlations in diabetes mellitus,” World Academy of Science, Engineering and Technology, vol. 15, pp. 624-627, 2008.
[2] S. Evans, L.C. Seidman, J.C.I. Tsao, K.C. Lung, L.K. Zeltzer, B.D. Naliboff, “Heart rate variability as a biomarker for autonomic nervous system response differences between children with chronic pain and healthy control children,” Journal of Pain Research, vol. 6, pp. 449-457, 2013.
[3] A. Malliani, “Cardiovascular neural regulation explored in the frequency domain,” Circulation, vol. 84, pp. 482-492, 1991. [4] H.W. Breuer, A. Skyschally, R. Schulz, C. Martin, M. Wehr,
G. Heusch, “Heart rate variability and circulating catecholamine concentrations during steady state exercise in healthy volunteers," British Hear Journal, vol. 70, no. 2, pp. 144-149, 1993.
[5] Task Force of the European Society of Cardiology and the North American Society of Pacing and Electrophysiology, “Heart Rate Variability standards of measurement, physiological interpretation, and clinical use,” Circulation, vol. 93, pp. 1043-1065, 1996.
[6] G.C. Casolo, P. Stroder, C. Signorini, F. Calzolari, M. Zucchini, E. Balli, A. Sulla, S. Lazzerini, “Heart rate variability during the acute phase of myocardial infarction,” Circulation, vol. 85, pp. 2073-2079, 1992.
[7] Y. Yamamoto, R.L. Hughson, J.C. Peterson, "Autonomic control of heart rate during exercise studied by heart rate variability spectral analysis," Journal Applied Physiology, vol. 71, no. 3, pp. 1136-1142, 1991.
[8] A. Acharya, R.M. Lambe, S. Zodge, J. Chaudhari, “Implementation of digital filters for ECG analysis,” International Journal of Computer Science and Information Technologies, vol. 5, no. 1, pp. 181-183, 2014. [9] F. Zakaria, M. Khalil, “Heart rate variability (HRV) analysis
using DSP for the detection of myocardial infarction,” 2nd
International Conference on Advances in Computational Tools for Engineering Applications (ACTEA), pp. 15-19, 2012.
[10]H. Posada-Quintero, D. Delisle-Rodriguez, M. Cuadra-Sanz, R.F. de la Vara-Prieto, “Evaluation of pulse rate variability obtained by the pulse onsets of the photoplethysmographic signal,” Physiological Measurement, vol. 34, no. 2, p. 179, 2013.
[11]E. Gil, M. Orini, R. Bailon, J.M. Vergara, L. Mainardi, P. Laguna, “Photoplethysmography pulse rate variability as a surrogate measurement of heart rate variability during nonstationary conditions,” Physiological Measurement, vol. 31, no. 9, p. 1271, 2010.
[12]S. Lu, H. Zhao, K. Ju, K. Shin, M. Lee, K.H. Shelley, K.H. Chon, “Can photoplethysmography variability serve as an alternative approach to obtain heart rate variability information?” Journal of Clinical Monitoring and Computing, vol. 22, no. 1, pp. 23-29, 2008.
[13]T. Ziemssen, J. Gasch, H. Ruediger, “Influence of ECG sampling frequency on spectral analysis of RR intervals and baroreflex sensitivity using the EUROBAVAR data set,” Journal of Clinical Monitoring and Computing, vol. 22, no. 2, pp. 159-168, 2008.
[14]S. Mahdiani, V. Jeyhani, M. Peltokangas, A. Vehkaoja, “Is 50 Hz high enough ECG sampling frequency for accurate
HRV analysis?” Annual International Conference of the IEEE Engineering in Medicine and Biology Society, vol. 2015, pp. 5948-5951, 2015.
[15]J.K. Kim, J.M. Ahn, “Design of an optimal digital IIR filter for heart rate variability by photoplethysmogram,” International Journal of Engineering Research and Technology, vol. 11, no. 12, pp. 2009-2021, 2018.
[16]S. Cerutti, A.M. Bianchi, L.T. Mainardi, “Spectral Analysis of the Heart Rate Variability Signal,” In: Malik, M. and Camm, A.J., Heart Rate Variability. Armonk NY: Futura Publishing Company, Inc., pp. 63-74, 1995.
[17]J.K. Kim, J.M. Ahn, “Effects of a Spectral Window on Frequency Domain HRV Parameters,” Advances in Computer Communication and Computational Sciences, 924, pp. 697-710, 2019.