1374 IJSTR©2020
www.ijstr.org
Post-Evaluative Insights Among Filipino
Engineering Students On Alignment, Spirality,
Strand, And Awards (ASSA) In K To 12
Implementation
Jun S. Camara
Abstract : Curriculum evaluation in the perspectives of student-clienteles is a significant and healthy approach to curriculum improvement. This paper aimed to post-evaluate insights of Filipino college students on the implementation of K to 12 in the Philippines, especially on the following study variables: Whether K to 12 has prepared students for college or not, whether K to 12 subjects are aligned with college course or not, whether Spiral Progression helped for college science and math mastery or not, and their belief of becoming an engineer despite all K to 12 issues they experienced. Involving 361 student-respondents in one highly performing university in the Philippines, and using a validated survey-questionnaire as data-gathering instrument, the researcher found that the proportion of K-to-12-Prepared college students equal with the K-to-12-Not-Prepared college students, and that majority of the respondents believe that the K to 12 subjects they took in senior high school are aligned with their college courses. However, majority believed that Spiral Progression did not help them to master the content of Science and Math in senior high school which they could have used in learning Science and Math in college better. Despite all issues of K to 12, majority of the respondents are found to be ‗Very Highly Confident‘ of becoming an engineer someday. Further, findings revealed that STEM-graduate students favor K to 12 preparation, alignment, and spiral progression while other strands do not; that 1st year students favor the idea that K to 12 has prepared them for college and that K to 12 subjects are aligned, compared to 2nd year and irregular students; and, that students receiving no awards in senior high school negatively answer from those with awards in
their belief to become an engineer someday. Findings show strong concern to Spiral Progression that should be dealt with through future educational policy.
Index Terms: Post K to 1 Evaluation, Philippines, Spirality, Alignment, Strand, Awards Engineering
—————————— ——————————
1.
INTRODUCTION
Have Spiral Progression and Curricular Offering enhanced student learning through the K to 12 Basic Education Curriculum implemented in the Philippines? Pursuant to Section 16 of Republic Act No. 10533 [1], entitled ―An Act Enhancing the Philippine Basic Education System by Strengthening Its Curriculum and Increasing the Number of Years for Basic Education, Appropriating Funds Therefor and for Other Purposes,‖ otherwise known as the ―Enhanced Basic Education Act of 2013,‖ approved on May 15, 2013, and which took effect on June 8, 2013, the Department of Education (DepEd), the Commission on Higher Education (CHED), and the Technical Education and Skills Development Authority (TESDA), issued the rules and regulations to implement the provisions of the Act. The Act was first implemented nationwide in the School Year 2013-2014. Since then, various problems have surfaced regarding its implementation, along all the successes that it has exemplified. Bala, Jr. [2] observed the following problems in the implementation of the K to 12 Curriculum: insufficient instructional materials, no teachers‘ manuals, congested classrooms, confusion among parents on the new grading system and classroom assessment, need to train teachers on pedagogy, educational research, measurement and evaluation, classroom management, and need to strengthen partnerships with private sectors and local industries.
While several studies are available on the issues and implementation of K to 12, especially, in its effects to quality instruction, only a handful of studies is available regarding the approach, awards, curriculum, and strand. Further, very few are studies on the post-evaluative insights of K to 12 graduates that may be used to reflect how K to 12 effected their tertiary education. Resurreccion et al [3] observed that review of related literature yields theoretical and philosophical underpinnings of spiral progression but few empirical studies are made in the area of science. Study on this topic in the Philippines is in scarcity, if not existent, because this approach was just fully implemented in 2012. They further said that it will take years to evaluate if the curriculum is effective and attuned to the needs of the learners and the society. One cannot really say that the spiral progression approach in teaching science is really effective in the Philippines. Evaluation of this approach is a must to determine, if like in other countries, in which this approach was abolished from their educational system after a certain period of time. Merza at al., [4] found that the teacher, curriculum, students‘ learning ability and school factors affect the spiral approach.
1.1 Objectives of the Study
The present study aimed to post-evaluate insights of Filipino college students on the implementation of K to 12 in the Philippines especially on the alignment of subjects, the perception on Spiral Progression, the effect of the awards system, and the effect of the strand choice in senior high school. Further, this study aimed to correlate all these four (4) variables to provide insights for educational practice.
1.2 Impact of the Study to Research Community
To date, no paper which attempts to post-evaluate and correlate four school variables, namely, subject alignment, spiral progression, awards system, and strand choice is ————————————————
1375 IJSTR©2020
published and is available on-line. Further, few studies are conducted in the area of post-descriptive evaluation among Filipino K-to-12-graduate college students, and is even more scarce on empirical studies. The impact of the study rests on the assumption that there is a need to re-visit the K-to-12 Filipino graduates, now second year college students.
2. METHODOLOGY
2.1 Respondents of the Study
The respondents of the study included three-hundred sixty-one (361) students from sixty-one highly performing state university in Region I, Philippines. Initially, there were three-hundred eighty-one (381) respondents, but twenty of the questionnaires were omitted from the list because they are not graduates in the K to 12 Basic Education Curriculum. These respondents are presently enrolled in various courses under the College of Engineering. They are a combination of first year and second year college students.
2.2 Instrumentation
The instrument which was used as a data-gathering tool was a 13-item survey-questionnaire. The questionnaire was pilot-tested among college students in one university and the Cronbach alpha was 0.78 – the questionnaire is valid. The instrument was divided into two major parts. Part I contained questions relative to their senior high school, and Part II contained questions relative to their insights on K to 12 as one of its graduates. Further, the survey-questionnaire opened with a section asking for their participation with a consent form section, and a reiteration of the confidentiality of their identity following laws related to privacy in the Philippines.
2.3 Data-gathering Procedure
The researcher sought permission from the President of the University through the Campus Executive Director. The researcher received the approval letter to administer the questionnaires. To hasten the administration of the instrument, he tasked eight (8) trained researchers from PARESSU, Inc in his capacity as the incumbent president.. The trained researchers administered the survey-questionnaires simultaneously during the 1st semester of School Year 2019-2020. The trained researchers gathered all the survey-questionnaires administered.
2.4 Statistical Treatment
The data in the 361 survey-questionnaires were all encoded and analyzed in SPSS 21. Frequency, Percentage, and Nonparametric Test of Correlations were used to analyze statistically the data. The Print Output of Analysis of the 361 questionnaires was kept by the secretariat of PARESSU, Inc with the Archive Code K12_01019.
3 RESULTS AND DISCUSSION
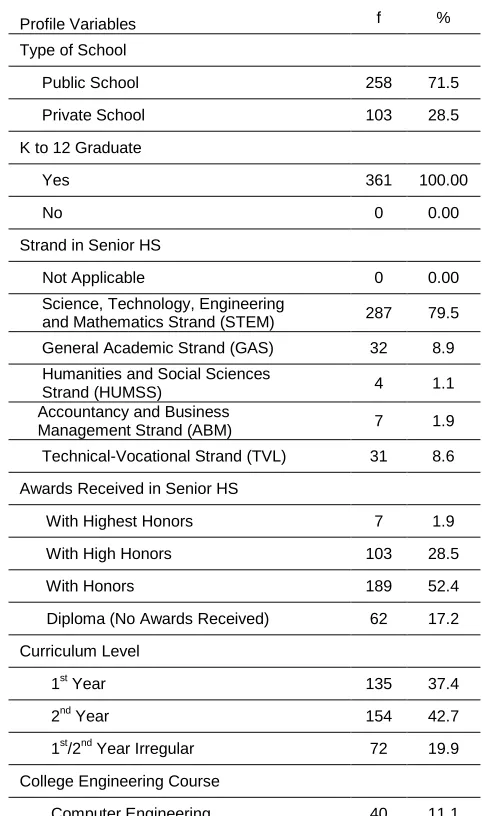
PROFILE VARIABLES OF THE RESPONDENTS (N=361) Table 1 displays that, in terms of Type of School, almost one-third of the respondents graduated from public senior high schools (71.5%). Interestingly, K to 12 graduates from private schools have chosen state universities for their college education which implies the growing attraction to public universities nationwide. As emphasized, all of the respondents are K to 12 graduates. In terms of Strand in senior high
school, majority of the respondents are graduates of the STEM Strand as expected (79.5%). Almost one-tenth are graduates of the General Academic Strand (8.9%), a little higher compared to those graduating from Technical-vocation strands (8.6%). Interestingly, a few graduates from the Accountancy and Business Management (1.9%) and Humanities and Social Sciences (1.1%) Strands are taking up engineering courses. Further, Table 1 reveals that, in terms of awards received in senior high school, half of the respondents received ‗With Honors‘ (52.4%). Almost one-third received ‗With High Honors‘ (28.5%). A handful received ‗With Highest Honors‘ (1.9%). Almost one-fifth of the respondents did not receive any award in senior high school (17.2%). Furthermore, in terms of curriculum level, majority of the respondents are in their second year students (42.7%). Close to this number are first year students (37.4%). One-fifth of the respondents are irregular students (19.9%). Finally, in terms of course, majority of the students are taking up Civil Engineering (62.0%), followed by Electrical Engineering (20.2%), then Computer Engineering (11.1%), and Mechanical Engineering (6.6%).
Table 1. Frequency and Percentages on the Profile Variables of the Respondents (n=361)
Profile Variables f %
Type of School
Public School 258 71.5
Private School 103 28.5
K to 12 Graduate
Yes 361 100.00
No 0 0.00
Strand in Senior HS
Not Applicable 0 0.00
Science, Technology, Engineering
and Mathematics Strand (STEM) 287 79.5 General Academic Strand (GAS) 32 8.9 Humanities and Social Sciences
Strand (HUMSS) 4 1.1
Accountancy and Business
Management Strand (ABM) 7 1.9 Technical-Vocational Strand (TVL) 31 8.6
Awards Received in Senior HS
With Highest Honors 7 1.9
With High Honors 103 28.5
With Honors 189 52.4
Diploma (No Awards Received) 62 17.2
Curriculum Level
1st Year 135 37.4
2nd Year 154 42.7
1st/2nd Year Irregular 72 19.9
College Engineering Course
Computer Engineering 40 11.1
Civil Engineering 224 62.0
1376 IJSTR©2020
www.ijstr.org Table 2, reveals that, the number of respondents who thought that K to 12 has prepared them for college (50.1%) and those who thought not (49.9%) differs only by one respondent who answered yes. This implies that the respondents are not yet fully decided whether or not K to 12 has prepared them for college or not.
Further, when asked whether or not their college course subjects are aligned with the K to 12 subjects, the respondents answered yes by a majority (72.0%) which is understandable because majority of them are STEM graduates. However, when asked whether or not spiral progression helped them master the content of science and math, majority of the respondents answered ‗no‘ (54.8%), however, a huge portion answered ‗yes‘ (45.2%). When asked whether they are thinking of dropping or shifting to another course, majority answered ‗no‘ (83.1%), while a considerably big portion answered ‗yes‘ (16.9%). Almost the same proportion who are thinking of dropping out or shifting to another course are ‗Very Highly Confident‘ that they will become an engineer someday (82.0%). Interestingly, 2.5% of this population is not confident at all of becoming an engineer someday.
Table 2. Frequency and Percentages on the Study Variables of the Respondents (n=361)
COMPARATIVE FREQUENCIES OF PROFILE VARIABLES OF THE RESPONDENTS ACROSS STUDY VARIABLES (N=361)
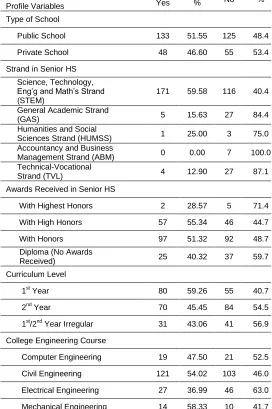
Table 3 compares the frequencies and percentages of the respondents per profile variable when asked whether or not K to 12 has prepared them to tertiary education. Table 3, shows that, majority of the respondents who graduated from public schools answered ‗yes‘ (51.55%, while majority of those who graduated from private school answered ‗no‘ (53.4%). When grouped according to strand, majority of the respondents graduating from the STEM Strand answered ‗yes‘ which is understandable because the STEM Strand is really designed for courses like Engineering (59.587%). It is interesting to note, however, that still a huge portion of STEM-graduated students answered ‗no‘ (40.40%). In any other strand like GAS (84.40%), HUMSS (75.00%), ABM (100.00%) and TVL (87.1%), majority of the respondents for each strand answered ‗no‘. Further, when grouped according to awards, surprisingly, there are those who despite graduating as With Highest Honors still believed that they were not prepared for college by K to 12 (71.40%), while a small portion believed that K to 12 prepared them (28.57%). More students graduating as With High Honors believed that K to 12 has prepared them for college (55.34%) compared to those who graduated With High Honors who believed were not prepared by K to 12 (44.70%). The proportion of respondents who graduated With Honors are almost equally divided whether they were prepared (51.32%) or not (48.70%) by K to 12 for college. Surprisingly still, those who graduated without any awards still have huge proportion who believed they were prepared for college by K to 12 (40.32%) as compared to the majority who understandably believe the otherwise (59.70%). When grouped according to year level, the first year and second year have total opposite answers. Majority of the first year students believe that they were prepared by K to 12 (59.266%) while majority of the second year believe that they were not prepared by K to 12 (54.57%). Those who are irregular students had the same belief with the second year (56.90%) – that they were not prepared for college by K to 12. Finally, when grouped according to course, majority of those enrolled in Civil Engineering (54.02%) and Mechanical Engineering (58.33%) believe that they were prepared by K to 12 for college, but for Computer Engineering (52.50%) and Electrical Engineering (63.00%) believe the otherwise. While for mechanical and computer engineering, the proportion of respondents who believed they were prepared by K to 12 and those who believed they were not prepared is close, among civil and electrical engineering students the difference is huge with a difference of more or less 5%. For civil engineering they favor ‗yes‘, but for electrical engineering, they favor ‗no‘.
Profile Variables Yes % No %
Type of School
Public School 133 51.55 125 48.4
Private School 48 46.60 55 53.4
Strand in Senior HS
Science, Technology, Eng‘g and Math‘s Strand (STEM)
171 59.58 116 40.4
General Academic Strand
(GAS) 5 15.63 27 84.4
Humanities and Social
Sciences Strand (HUMSS) 1 25.00 3 75.0 Accountancy and Business
Management Strand (ABM) 0 0.00 7 100.0 Technical-Vocational
Strand (TVL) 4 12.90 27 87.1
Awards Received in Senior HS
With Highest Honors 2 28.57 5 71.4
With High Honors 57 55.34 46 44.7
With Honors 97 51.32 92 48.7
Diploma (No Awards
Received) 25 40.32 37 59.7
Curriculum Level
1st Year 80 59.26 55 40.7
2nd Year 70 45.45 84 54.5
1st/2nd Year Irregular 31 43.06 41 56.9
College Engineering Course
Computer Engineering 19 47.50 21 52.5
Civil Engineering 121 54.02 103 46.0
Electrical Engineering 27 36.99 46 63.0
Table 3. Frequencies and Percentages Comparison of Profile and Study Variables In Terms of ‘Prepared by K to 12’ (n=361)
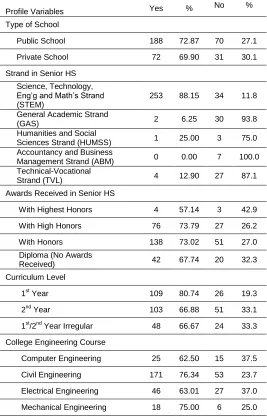
Table 4 compares the frequencies and percentages of the respondents per profile variable when asked whether or not K to 12 subjects are aligned with their course. Table 4 reveals that, majority of the respondents graduating from either pubic (72.87%) or private (69.90%) said that the K to 12 subjects are aligned with their course. When grouped according to strand, only those who graduated from the STEM Strand said that K to 12 subjects are aligned in their course (88.15%) which is understandable as earlier noted. For other strand, the difference of proportion is comparably huge. When grouped according to awards, majority of those graduating as With Highest Honors (57.14%), With High Honors (73.79%), With Honors (73.02%), and without awards received (67.74%), believed that K to 12 subjects are aligned to their college course. When grouped according to year level, majority of the respondents per category (80.74%, 1st year; 66.88%, 2nd year; 66.67%, irregular) believe that the K to 12 subjects are aligned with their course. When grouped according to course, majority of those enrolled in Civil Eng‘g (62.50%), Computer Eng‘g (76.34%), Electrical Eng‘g (63.01%), and Mechanical Eng‘g (75.00%) believed that the K to 12 subjects are aligned in their course.
.
Table 4. Frequencies and Percentages Comparison of Profile and Study Variables In Terms of ‘K to 12 subjects are Aligned’
(n=361)
Profile Variables Yes % No %
Type of School
Public School 188 72.87 70 27.1
Private School 72 69.90 31 30.1
Strand in Senior HS
Science, Technology, Eng‘g and Math‘s Strand (STEM)
253 88.15 34 11.8
General Academic Strand
(GAS) 2 6.25 30 93.8
Humanities and Social
Sciences Strand (HUMSS) 1 25.00 3 75.0 Accountancy and Business
Management Strand (ABM) 0 0.00 7 100.0 Technical-Vocational
Strand (TVL) 4 12.90 27 87.1
Awards Received in Senior HS
With Highest Honors 4 57.14 3 42.9
With High Honors 76 73.79 27 26.2
With Honors 138 73.02 51 27.0
Diploma (No Awards
Received) 42 67.74 20 32.3
Curriculum Level
1st Year 109 80.74 26 19.3
2nd Year 103 66.88 51 33.1
1st/2nd Year Irregular 48 66.67 24 33.3
College Engineering Course
Computer Engineering 25 62.50 15 37.5
Civil Engineering 171 76.34 53 23.7
Electrical Engineering 46 63.01 27 37.0
Mechanical Engineering 18 75.00 6 25.0
Study Variables f %
Has K to 12 prepared you to tertiary education?
Yes 181 50.1
No 180 49.9
Are the K to 12 subjects aligned with your college course?
Yes 260 72.0
No 101 28.0
Has Spiral Progression helped in your mastery of Science and Math content?
Yes 163 45.2
No 198 54.8
Are you thinking of dropping or shifting to another course?
Yes 61 16.9
No 300 83.1
How confident are you that you will become an Engineer someday?
Very Highly Confident 296 82.0
Very Confident 29 8.0
Confident 22 6.1
Moderately Confident 5 1.4
1378 IJSTR©2020
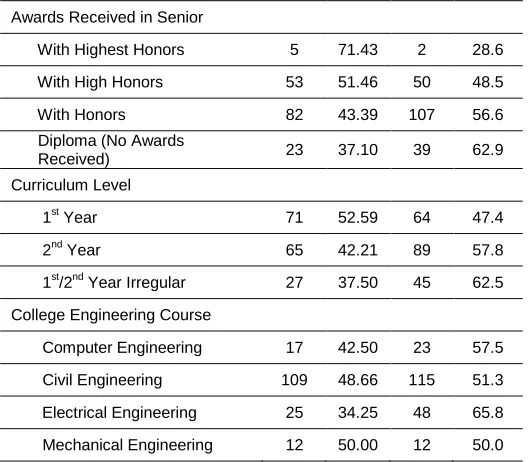
www.ijstr.org Table 5 compares the frequencies and percentages of the respondents per profile variable when asked whether or not Spiral Progression was helpful in their mastery of Science and Math content for college. Table 5 reveals that, when grouped according to school type, majority of the respondents graduating from public schools (51.55%) answered ‗yes‘ while those graduating from private schools (53.40%) answered ‗no‘ . Interesting to note, however, is that the difference in either public or private schools is small when whether Spiral Progression was helpful or not.When grouped according to Strand, only those graduating from STEM Strand (51.92%) answered Spiral Progression was helpful compared to the majority of students graduating from GAS (81.30%), HUMSS (100%), ABM (85.70%), and TVL (77.40%) who answered ‗no‘. Interestingly, however, is that while majority of the STEM-graduated students believed spiral progression was helpful, a huge proportion of those who say spiral progression was not helpful is stull huge (48.10%) which is in fact higher than, when combined, all non-STEM-graduated students who believed spiral progression was not helpful. When grouped according to awards received, majority of students who received With Highest Honors (71.43%) and With High Honors (51.46%) believed that spiral progression was helpful, while those graduating With Honors (56.60%) and those receiving no awards (62.90%) believed that spiral progression was not helpful. When grouped according to curriculum level, majority of the second year (57.80%) and irregular students (62.50%) said that spiral progression was not helpful, while first year students (52.59%) believe that spiral progression was helpful. When grouped according to course, majority of the respondents in all the strands, except for mechanical engineering whose proportions are exactly equal, believe that spiral progression was not helpful.
Table 5. Frequencies and Percentages Comparison of Profile and Study Variables In Terms of ‘Spiral Progression is Helpful’
(n=361)
Table 5 continued
Table 6 compares the frequencies and percentages of the respondents per profile variable when asked whether or not they believe that they will become an engineer someday. Table 7, reports that, using the weighted mean, all respondents in any category are ‗Very Highly Confident‘ of becoming an engineer someday. Further, the respondents are described through their weighted means for their level of confidence to become an engineer in ascending order. In terms of Type of School: public school > private school. In Terms of Strand in Senior HS: GAS, HUMSS > STEM >TVL > ABM. In Terms of Awards Received: With High Honors > With Honors > With Highest Honors > No Awards. In Terms of Curriculum level: 1st year > 2nd year > irregular. Lastly, in terms of College Course: Mechanical > Electrical > Civil > Computer Engineering, though computer engineering will be Engineering ‗graduate‘.
Table 6. Comparative Frequencies and Weighted Means In Terms of ‘Belief to become an engineer someday’ (n=361)
Table 6 continued
Awards Received in Senior
With Highest Honors 5 71.43 2 28.6
With High Honors 53 51.46 50 48.5
With Honors 82 43.39 107 56.6 Diploma (No Awards
Received) 23 37.10 39 62.9
Curriculum Level
1st Year 71 52.59 64 47.4
2nd Year 65 42.21 89 57.8
1st/2nd Year Irregular 27 37.50 45 62.5
College Engineering Course
Computer Engineering 17 42.50 23 57.5
Civil Engineering 109 48.66 115 51.3
Electrical Engineering 25 34.25 48 65.8
Mechanical Engineering 12 50.00 12 50.0
Profile Variables VHC HC C MC NC WM Type of School
Public School 213 21 17 2 5 4.69
Private School 83 8 5 3 4 4.58
Strand in Senior HS
STEM 236 20 20 5 6 4.66
GAS 28 2 1 1 4.75
HUMSS 3 1 4.75
ABM 3 3 2 4.29
TVL 26 3 2 4.65
Profile Variables Yes % No %
Type of School
Public School 133 51.55 125 48.4
Private School 48 46.60 55 53.4
Strand in Senior HS
Science, Tech, Eng‘g and
Math‘s Strand (STEM) 149 51.92 138 48.1 General Academic
Strand (GAS) 6 18.75 26 81.3
Humanities and Soc. Sci.
Strand (HUMSS) 0 0.00 4 100.0
Accountancy and Business Management Strand (ABM)
1 14.29 6 85.7
Technical-Vocational
CORRELATES OF PROFILE AND STUDY VARIABLES ON K TO 12 IMPLEMENTATION
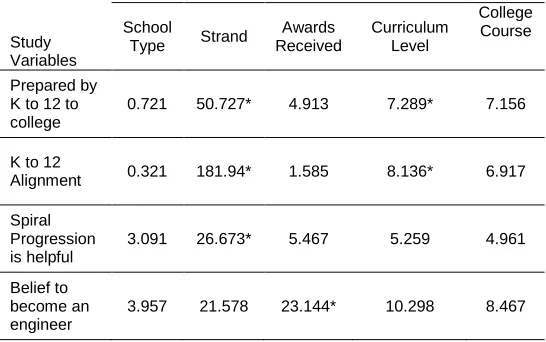
Table 7 compares the chi-square values between the study variables and selected profile variables. Table 7, reveals that, there is no significant difference on the answers of the respondents when grouped according to school type (public or private) which implies that their answers to the questions regarding the study variables are significantly similar, almost the same. The same finding is found in terms of college course – all of the respondents in any course answered the questions similarly, and no significant difference is statistically found between and among them. However, Table 7 reports that a significant difference was found in Curriculum level on the study variables Prepared by K to 12 and K to 12 Alignment. Recall in Table 3 that both the second year students and irregular students both answered through majority that K to 12 did not prepare them for college. Further, Recall in Table 2 that majority of the respondents answered ‗yes‘ when asked whether or not K to 12 subjects are aligned in their course, and in Table 3 more 1st year students answered that K to 12 subjects are aligned with their course compared to both second year students and irregular students. Furthermore, Table 7 reveals that a significant difference was found in Awards Received on the study variable Belief in Becoming an Engineer. Recall in Table 6 that majority of the respondents rated themselves as ‗Very Highly Confident‘ to become an engineer and someday, and that the weighted mean of those with no awards received is comparably lower (WM=4.37) than those graduating with honors received, though still interpreted as Very Highly Confident.Moreover, Table 7 reports that a significant difference was found in Strand on the study variables Prepared by K to 12, K to 12 Alignment, and Spiral Progression is helpful. Recall in Table 3 that only those respondents who are STEM graduates claimed that they are prepared by K to 12, while respondents graduating in non-STEM Strand actually believe the otherwise. Recall, further, in table 4 when only STEM-graduated respondents claimed that K to 12 subjects are aligned with their course, while other non-STEM-graduate students claimed the opposite. Finally, Recall in Table 5, that only STEM-graduated students claim that Spiral Progression was helpful
when all other respondents in non-STEM Strand claimed the opposite.
Table 7. Comparative chi-square (X2) values on selected
profile and study variables’ correlates
4 CONCLUSIONS AND RECOMMENDATIONS
This study found that majority of the respondents graduated from public schools, and are all K to 12 graduates, are graduates of Science, Technology, Engineering and Mathematics (STEM) Strand, received With Honors awards, 2nd year students, and are not presently taking up Civil Engineering. Further, findings revealed that there are equal number of respondents who believed that they are prepared by K to 12 for their tertiary education. Furthermore, findings revealed that the K to 12 subjects are aligned with their college course. Moreover, findings revealed that the respondents believed that spiral progression did not help them master the science and mathematics content which they needed in their college course. Despite all these, majority of the respondents said that they are not intending to drop from their course or to shift to another course. In fact, majority of them are very highly confident that they will become an engineer someday As to the correlates of the profile variables and study variables, findings revealed no significant difference between College course and School type with the study variables, viz¸ Prepared by K to 12, K to 12 Alignment, Spiral Progression is helpful, and Belief to become an engineer. This means that their perceptive-evaluation are similar regardless of the school they graduated from, public or private, or their engineering course at present. However, a significant difference was found between Strand, Awards, and Curriculum Level. In terms of Strand, while no significant difference is noted in their belief to become an engineer, their perceptive-evaluation of K to 12 (preparation, alignment, and spiral progression) differ, implying that only those who graduated from STEM strand have a positive view of K to 12‘s preparation, alignment, and spiral progression. In terms of Awards received, the respondents differ in their perceptive-evaluation of K to 12, implying that those who received no awards have a rather negative belief ofAwards Received
With Highest H. 6 1 4.57
With High H. 92 4 5 2 4.79
With H. 154 18 12 2 3 4.68
No Awards 44 7 5 2 4 4.37
Curriculum Level
1st Year 116 8 6 2 3 4.72
2nd Year 128 11 8 3 4 4.66
Irregular 52 10 8 2 4.53
College Eng‘g Course
Computer E. 30 3 5 1 1 4.50
Civil E. 182 17 15 3 7 4.63
Electrical E. 63 7 1 1 1 4.78
Mechanical E. 21 2 1 4.83
Note: All Weighted Means interpreted as ‗Very Highly Confident‘ Study
Variables
Selected Profile Variables
School
Type Strand
Awards Received
Curriculum Level
College Course
Prepared by K to 12 to college
0.721 50.727* 4.913 7.289* 7.156
K to 12
Alignment 0.321 181.94* 1.585 8.136* 6.917
Spiral Progression is helpful
3.091 26.673* 5.467 5.259 4.961
Belief to become an engineer
1380 IJSTR©2020
www.ijstr.org becoming an engineer someday. In terms of Curriculum level, the respondents differ in their perceptive-evaluation about K to 12‘s preparation and alignment, implying that the first year students differ with the answers of both the second year students and irregular students on whether or not K to 12 has prepared for college which they answer favorably, and whether or not K to 12 subjects are aligned with their course which they answer favorably as well. The researcher recommends empirical studies among 1st year and 2nd year to further reflect, and more objectively, to the effect of K to 12 to engineering college students.
5 ACKNOWLEDGEMENTS
The author wishes to thank the President of Pangasinan State University, Pangasinan Philippines, through Engr. R. Garrote (PSU Urdaneta City) for the approval to conduct the study. Likewise, the author is grateful for the help of the following trained researchers in floating the questionnaires: A. B. Acosta, J. I. R. Badua, M. R. Garcia, J. F. Melendez, J. R. Padilla, and J. P. Pasana..
REFERENCES
[1] ‗Implementing Rules and Regulations of the Enhanced Basic Education Act of 2013‘. Accessed at https://www.officialgazette.gov.ph/2013/09/04/irr-republic-act-no-10533/ on Nov. 24, 2019.
[2] Bala, Jr. C. 2017. Problems Encountered in K to 12
Curriculum. Accessed at
http://www.deped-ne.net/?page=news&action=details&opt=popup&REFECO DE=ARPRO2017070002 on Nov. 23, 2019
[3] Resurreccion, G. A., W. T. Taala & J. R. Adanza. 2016. Spiral Progression in Teaching Science in Selected Private and Public Schools in Cavite. International Conference on Research in Social Sciences, Accessed at https://uruae.org/siteadmin/upload/UH0516148.pdf on Nov. 28, 2019