IJSRR, 8(2) April. – June., 2019 Page 2251
Research article Available online www.ijsrr.org
ISSN: 2279–0543
International Journal of Scientific Research and Reviews
Comparative Analysis of Load Distribution in Cloud using Cloud
Analyst
Hejab Fatima
1and Sameena Naaz
2*1
Department of computer science engineering SEST, Jamia Hamdard Email: [email protected]
2
Department of computer science engineering SEST, Jamia Hamdard Email: [email protected]
ABSTRACT
Cloud computing has become one of the trending field in IT, making it easier for users to access whatever they need on the Internet. Cloud Computing has benefited the users in many ways. In cloud environment, load balancing is an issue. It distributes the load among various nodes for better utilization of resources and improve response time. It also helps to avoid a situation where, there are nodes which are over loaded and other nodes are under loaded.The main purpose of this paper is to check the performance comparison in the service broker policy with optimizing response time.To face the challenge of load of data between servers, different algorithms are used.This paper discusses few of them andsimulation is performed using cloud analyst tool.
KEYWORDS:
load balancing; cloud computing; cloud analyst*Corresponding author
SameenaNaaz
2
Department of Computer Science and Engineering, SEST, Jamia Hamdard, New Delhi
IJSRR, 8(2) April. – June., 2019 Page 2252
INTRODUCTION
Cloud computing has become very popular these days for accessing online computing resources in a pay per use manner. It helps users to access the resources and also stores data according to their requirements. A cloud has many different elements such as client, distributed servers, datacenters.The cloud supports the concept of virtualization that displays virtualized data centers. When multiple nodes are connected in the cloud and random request are coming together, there is a possibility that some node may become overloaded and some under loaded. This situation gives rise to load balancing when work load are not properly distributed. Efficient resource allocation is necessary,so that the performance increases and the energy consumption and the carbon emission rate are reduced.
According to NIST definition, "cloud computing is a model for enabling ubiquitous, convenient, on-demand network access to a shared pool of configurable computing resources (e.g., networks, servers, storage, applications and services) that can be rapidly provisioned and released with minimal management effort or service provider interaction."1
The architecture of cloud computing consists of two different models and essential characteristics.
Service
model:-IaaS: It offers infrastructure facilities for providing instances of Virtual Server and Storage. PaaS: This service offers tools to create host on the infrastructure.
SaaS: It offers software applications.2
Deployment model:-
Public cloud: It is used by third-party providers to utilize cloud services.
Private cloud: This model was adopted by organizations to provide cloud service to the internal users.
Hybrid cloud: It is a model which consists of bothpublic and private cloud deployed to provide service for entire organizations. Sensitive and critical applications based organization adopts this delivery model.3
IJSRR, 8(2) April. – June., 2019 Page 2253 Fig1:- load balancing architecture
PROBLEM STATEMENT
When a request arrive to the Datacenter Controller, it has to be allocated to one of the nodes, but the requests have to be distributed equally within the system to avoid load of the work and system’s performance degradation. From architecture of cloud we deduce that we need another componentcalled Load Balancer to balance the load of the system. The Load Balancer plays a major role in the cloud's total response time. In Cloud Computing the Load balancer selects the Data Center and virtual machines for upcoming request.
In the success ofcloud computing the load balancing and task scheduling plays an important role. Different factors affect cloud performance in terms of network data storage and resource sharing.5
LOAD BALANCING ALGORITHMS
Round robin algorithm:-
Jobs are allocated circularly. The assignment of processors takes place in a circular order.6when work is distributed equally in each node, the response if fast. The major drawback is that some nodes are overloaded in this algorithm, and others remain idle or underused.
IJSRR, 8(2) April. – June., 2019 Page 2254
Honeybee foraging behavior load balancing algorithm:-
It is based on the real honey beebehavior and the way they find their food sources. Once, they find their food sources, they come back to their bee hive to inform the other bees about the food source. This is done by performing group movement, which is also known as “waggle Dance”.7 They perform waggle dance to give information to the other bees about the exact place the food source is located. It also tells about the quality of the food and the quantity.
Throttled load balancing algorithm:-
This algorithm is best suited for virtual machines. First of all the list of virtual machines is created. On the arrival of request the scanning of indexing table is done and available virtual machine is assigned. After the job is completed the indexing table is updated. 8
Fig3:- Throttled
ESCE(Equally Spread Current Execution) algorithm:-
In this algorithm, list of virtual machines and jobs are maintained. Whenever a requests arrives the list is scanned first and then it is allotted to the best suited virtual machine. Equal amount of load is distributed to all the virtual machines.9
Ant colony algorithm:-
IJSRR, 8(2) April. – June., 2019 Page 2255
PROPOSED WORK
The cloud analyst simulator is used in this paper for experimental work.
Different algorithms of load balancing are compared in this and the parameters in which they were analyzed are total cost involved, overall data processing time and overall response time. The simulations are performed and results are compared using optimum response time in the service broker policy.
Cloud analyst:-
Cloud Analyst10 is Constructed over existing Cloud Simtoolk it, which extends the CloudSim functionalities, and also helps in modeling, simulation and other experimentation 11
Fig4:- Cloud Analyst
Few elements of cloud analyst are:-
GUI : It uses the Java GUI.
Region: There are 6 regions on which Data centers can be created.
User Base: It is the group of users which sends the requests to Data centers.
Datacenter: Process the requests of User Bases and includes the different Virtual Machines.
DC Controller: It is used to control the Datacenters and VMs.
Internet Characteristics: It has the characteristics of Bandwidth and Latency.
VM Load Balancer: It is used for balancing the load.
Service Broker: It clears the web traffic of the requests.12
EXPERIMENTAL SETUP
IJSRR, 8(2) April. – June., 2019 Page 2256 Fig5:- Datacenter by Region
Fig6:- Main Configuration
This figure shows the main configuration setup where the different parameters are set. It consists of User bases, simulation duration where we can set the duration of the simulation and service broker policy. There are three service broker policies in cloud analyst and they are optimize response time, closest data center and dynamically configured. In this we also have data center configuration where we set the different data centers at different regions. The cloud analyst also consists of advance where we can set the number of users a single user base can have. There is also executable instructions length per request and there we can set our load balancing algorithms.
The simulation duration is set to 20 minutes, 4 user bases and 3 data centers are taken with 5 VMs each. Request per user is 60 and data size on every request is 100. The no. of user in single user base and request grouping factor is 10.
SIMULATION RESULT:-
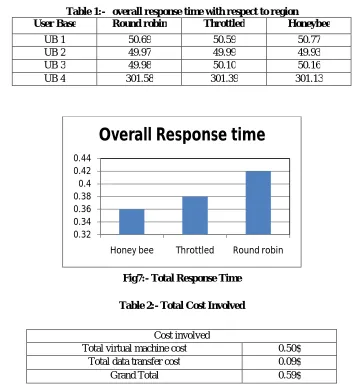
IJSRR, 8(2) April. – June., 2019 Page 2257 Table 1:- overall response time with respect to region
User Base Round robin Throttled Honeybee
UB 1 50.69 50.59 50.77
UB 2 49.97 49.99 49.93
UB 3 49.98 50.10 50.16
UB 4 301.58 301.39 301.13
Fig7:- Total Response Time
Table 2:- Total Cost Involved
The costs involved in all the three simulations are same.
Now, few more simulations are done with some parameters to get the result and they aretotal number of tasks, executable instruction length and average number of requests.13
Fig 8:-Average Response Time Vs Numberof Tasks 0.32 0.34 0.36 0.38 0.4 0.42 0.44
Honey bee Throttled Round robin
Overall Response time
130 131 132 133 134 135 136 137 138 139 140
100 200 400 600
A vg . R e sp o n se t im e ( m s)
Total Number of Tasks Cost involved
Total virtual machine cost 0.50$
Total data transfer cost 0.09$
IJSRR, 8(2) April. – June., 2019 Page 2258
This figurerepresents the average response time over total no. of tasks of Honeybee and the executable instruction length taken is 2000 byte. It is observed that with the increasing number of tasks the response time also increases.
Fig 9. Average Response Time vs Executable InstructionLength
This figure presents average response time of Honey Bee with executable instruction length per request. It is observed that with the increasing number of executable instructions the response time also increases.
Comparison with the other algorithms:-
The comparison of proposed Honeybee is done with the, Round Robin and Throttled algorithm.
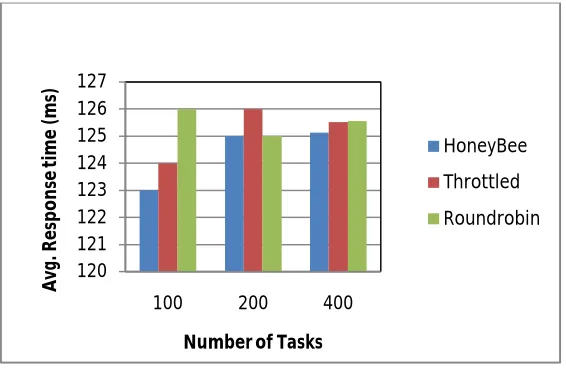
Fig 10: Average Response Time vs Numberof Tasks
This figure presents the average response time upon no. of tasks comparing Honeybee, throttled and roundrobin. Honeybee shows better performance in comparison to other algorithms.
0 50 100 150 200 250
2000 4000 6000 8000
A vg . r e sp o n se t im e (m s)
Executable Instruction Length
120 121 122 123 124 125 126 127
100 200 400
A vg . R e sp o n se t im e ( m s)
Number of Tasks
HoneyBee
Throttled
IJSRR, 8(2) April. – June., 2019 Page 2259 Fig 11. Average Response Time vs Executable InstructionLength
This figure presents the average response time of Honey bee, Round robin, and throttled algorithms versus executable instruction length. The number of executable instructions changes from 1000, 2000 and 3000. The average response time is almost similar in all cases.
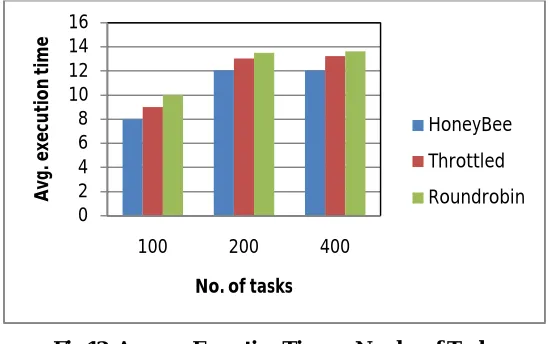
Fig 12. Average Execution Time vs Numberof Tasks
This figure shows the average execution time over no. of tasks and the comparison is done among Honeybee, round robin and throttled. The number of tasks is 100,200 and 400. It is seen that the average execution time for honey bee is better than the other algorithms
CONCLUSION
Cloud analyst is asimulator for balancing the load which design and analyze the cloud based issues. This paper shows how simulations are done in such environment with different parameters. The load balancing mainly focuses on response time and data transfer costs as it impacts the system performance14.Three algorithms round robin, throttled and honeybee are taken into consideration and comparison are done with simulation metrics like overall response time, average execution time, data centerservice time and overall cost. According to the result and analysis of the experiment, the
0 20 40 60 80 100 120 140 160 180
1000 2000 3000
A vg . R es p o n se t im e ( m s)
Executable Instruction Length for Each Task honeyBee Throttled Roundrobin 0 2 4 6 8 10 12 14 16
100 200 400
A vg . e xe cu ti o n t im e
No. of tasks
HoneyBee
Throttled
IJSRR, 8(2) April. – June., 2019 Page 2260
proposed Honeybee hasthe best performance in the cloud environment when it comes to overall response time however, there no difference in the cost involved.
REFERENCE
1. Mell P, Grance T. "NIST SP 800-145, The NIST Definition of Cloud Computing". NIST Spec Publ. 2011.
2. Alnazir M.K.A.M, Mustafa A.B.A.N, Ali H.A, Yousif A.A.O." Performance analysis of Cloud Computing for distributed data center using cloud-sim." International Conference on Communication, Control, Computing and Electronics Engineering, ICCCCEE 2017.
3. Shanmugam G.S, Iyengar N.C.S.N." Effort of load balancer to achieve green cloud computing: A review". Int. J. Multimed. ubiquitous Eng. 2016;11(3):317-332.
4. Katyal M, Mishra A. "A comparative study of load balancing algorithms in cloud computing environment". arXiv Prepr arXiv14036918. 2014.
5. Tiwari AK, Nair S. "Improve the Efficiency of Load Balancing in Cloud Environment using DAG and Honey Bee Algorithm". Int. J. Computer Sci. Inf. Technol. 2016;7(2):811-815. 6. Aslam S, Shah MA. "Load balancing algorithms in cloud computing: A survey of modern
techniques". National Software Engineering Conference (NSEC). IEEE; 2015; 30-35.
7. Kanakala VR, Reddy VK, Karthik K. "Performance analysis of load balancing techniques incloud computing environment".IEEE International Conference on Electrical, Computer and Communication Technologies (ICECCT). IEEE; 2015; 1-6.
8. Jaiswal AA, Jain S. "An approach towards the dynamic load management techniques in cloud computing environment". International Conference on Power, Automation and Communication (INPAC). IEEE; 2014; 112-122.
9. Sajjan RS, Yashwantrao BR. "Load balancing and its algorithms in cloud computing: A survey". Int J Comput Sci Eng. 2017;5(1):95-100.
10.Shoja H, Nahid H, Azizi R."A comparative survey on load balancing algorithms in cloud computing". International Conference on Computing Communication and Networking Technologies, ICCCNT ; 2014.
11.Wickremasinghe B, Buyya R. "CloudAnalyst: A CloudSim-based tool for modelling and analysis of large scale cloud computing environments". MEDC Proj Rep. 2009;22(6):433-659.
IJSRR, 8(2) April. – June., 2019 Page 2261
13.Hashem W, Nashaat H, Rizk R. "Honey bee based load balancing in cloud computing. KSII Trans Internet Inf. Syst. 2017