R E S E A R C H
Open Access
Latent variable mixture models to test for
differential item functioning: a
population-based analysis
Xiuyun Wu
1,2, Richard Sawatzky
3, Wilma Hopman
4, Nancy Mayo
5, Tolulope T. Sajobi
6, Juxin Liu
7, Jerilynn Prior
8,
Alexandra Papaioannou
9, Robert G. Josse
10, Tanveer Towheed
11, K. Shawn Davison
12and Lisa M. Lix
13*Abstract
Background:Comparisons of population health status using self-report measures such as the SF-36 rest on the assumption that the measured items have a common interpretation across sub-groups. However, self-report measures may be sensitive to differential item functioning (DIF), which occurs when sub-groups with the same underlying health status have a different probability of item response. This study tested for DIF on the SF-36 physical functioning (PF) and mental health (MH) sub-scales in population-based data using latent variable mixture models (LVMMs).
Methods:Data were from the Canadian Multicentre Osteoporosis Study (CaMos), a prospective national cohort study. LVMMs were applied to the ten PF and five MH SF-36 items. A standard two-parameter graded response model with one latent class was compared to multi-class LVMMs. Multivariable logistic regression models with pseudo-class random draws characterized the latent classes on demographic and health variables.
Results:The CaMos cohort consisted of 9423 respondents. A three-class LVMM fit the PF sub-scale, with class proportions of 0.59, 0.24, and 0.17. For the MH sub-scale, a two-class model fit the data, with class proportions of 0. 69 and 0.31. For PF items, the probabilities of reporting greater limitations were consistently higher in classes 2 and 3 than class 1. For MH items, respondents in class 2 reported more health problems than in class 1. Differences in item thresholds and factor loadings between one-class and multi-class models were observed for both sub-scales. Demographic and health variables were associated with class membership.
Conclusions:This study revealed DIF in population-based SF-36 data; the results suggest that PF and MH sub-scale scores may not be comparable across sub-groups defined by demographic and health status variables, although effects were frequently small to moderate in size. Evaluation of DIF should be a routine step when analysing population-based self-report data to ensure valid comparisons amongst sub-groups.
Keywords:Latent class analysis, Item response theory, Mental health, Patient-reported outcome measures, Physical functioning, Population health
* Correspondence:[email protected]
13Department of Community Health Sciences, University of Manitoba, S113-750 Bannatyne Ave, Winnipeg, MB R3E 0W3, Canada
Full list of author information is available at the end of the article
Background
Self-report health status measures, such as the SF-36, are frequently used to compare the health and well-being of different populations and to establish popula-tion norms for comparative investigapopula-tions [1]. To make accurate comparisons, the scores on these patient-reported outcome measures (PROMs) must be valid and reliable. While many PROMS have been subjected to recommended psychometric evaluations of their con-struct validity, test-retest reliability, and interpretability [2–4], they are less frequently evaluated for differential item functioning (DIF), a form of measurement non-equivalence. Specifically, measurement non-equivalence (or non-invariance) exists when a PROM does not meas-ure the same construct (e.g., quality of life) across differ-ent population sub-groups [5, 6]. DIF arises when individuals with the same underlying level of health re-spond differently to the items that comprise a health measure; these differences are often associated with re-spondent characteristics such as sex and age [7]. If there is no evidence of DIF, individuals with the same charac-teristics are expected to produce a similar pattern of re-sponses on the PROM items. However, when there is evidence of DIF, differences on the PROM items may be an artifact of the measurement process.
Measurement non-equivalence and DIF have been ex-amined for the SF-36 and SF-12 in population-based data [8–12]. DIF has been detected in both instruments [8, 10–12].
Item response theory (IRT) models, which were origin-ally developed for application to achievement tests in the field of education and psychology, are commonly used to test for DIF [13] amongst manifest (i.e., ob-served) groups, such as males and females. However, comparisons of item responses for manifest groups using conventional IRT models may lack sensitivity to detect the true source(s) of DIF [14–17]. Specifically, DIF may be associated with unobserved (i.e., latent) characteris-tics, as well as observed characteristics. Alternative ana-lytic techniques to conventional IRT models are needed to disentangle the effects of latent and observed charac-teristics [14–17].
Latent variable mixture models (LVMMs) have re-cently been proposed to detect DIF-related bias in self-report measures [10, 14–21]. LVMMs combine latent class techniques with IRT; these models do not assume that manifest variables fully account for differential pat-terns of item functioning [15, 16]. A LVMM for DIF seeks to identify heterogeneous latent groups (i.e., latent classes) in a population with distinct patterns of item re-sponses. The LVMM assumes that the IRT measurement model holds within each latent class, but allows for dif-ferent sets of item parameters among the latent classes. LVMMs are well suited to the analysis of
population-based data, which are likely to exhibit substantial hetero-geneity in patterns of item responses.These models are valuable because they can be used to generate hypoth-eses about population characteristics that may be associ-ated with DIF [10].
The purpose of this study was to test for DIF on self-report measures of physical and mental health in a diverse population-based cohort using LVMMs. Specifically, we focus on the SF-36 physical functioning (PF) and mental health (MH) sub-scales. These sub-scales were selected for investigation because previous studies have demonstrated their sensitivity to DIF using manifest variable models [8, 9, 11, 22, 23]. An investigation of whether LVMMs will detect DIF in these two SF-36 sub-scales can help to elucidate the causes of DIF and facilitate the interpretation of DIF and its impact on the validity of the SF-36.
Methods
Data source
Study data were from the Canadian Multicentre Osteopor-osis Study (CaMos), a population-based prospective cohort study that was initiated to provide unbiased national esti-mates of the prevalence and incidence of osteoporosis [24]. Individuals were recruited without regard for disease status but had to live within a 50-km radius of one of the nine study sites, which were primarily in urban centres. Baseline data, which were the focus of this analysis, were collected in 1996 to 1997. Details of the data collection methods and sample characteristics have been published elsewhere [24]. We included respondents 25 years of age and older.
Measures
The SF-36 version 1 was used in the CaMos; it encom-passes eight sub-scales: PF, MH, role physical, bodily pain, general health, vitality, social functioning, and role emotional. The PF sub-scale is comprised of 10 items with three response options:limited a lot, limited a lit-tle, and not limited at all. The MH sub-scale is com-prised of five items evaluated on a six-point scale with endpoints ofall of the timeandnone of the time[1, 25].
Statistical Analyses
Descriptive statistics were used to characterize the study sample on the PF and MH item responses, demographic, and health status measures. Item responses with posi-tively worded formats (i.e., MH3 and MH5) were reverse coded prior to analysis.
Analyses were conducted separately for the PF and MH sub-scale items. Unidimensionality, the assumption that all items measure a single construct, was investigated by a descriptive analysis of the standardized residuals of item responses for the one-class model [28]. A χ2statistic was used to test for differences between predicted and ob-served responses. We also examined unidimensionality using exploratory factor analysis with oblique rotation ap-plied to the polychoric correlations for the items [29]. The root mean square error of approximation (RMSEA) and comparative fit index (CFI) were used to assess model fit. A RMSEA value≤0.10 [30], and a CFI value >0.90 [31] in-dicate acceptable model fit.
Local independence of the items is satisfied if the re-siduals of items are not correlated, conditional on the common latent factor (i.e., P[R1, R2|θ] = P[R1|θ] P[R2| θ] where θ represents underlying health status and R1 and R2 are residuals for scale items 1 and 2. In other words, the joint probability of correct responses for an item pair will be a product of the probabilities of correct responses to the two items, conditional on the latent fac-tor. We evaluated local independence by comparing the predicted and observed proportions of responses for each pair of items in a sub-scale in all the models using aχ2statistic [32].
The LVMM combines a latent class model with an IRT two-parameter graded response model (GRM) [33]. This GRM is specified as:
Pij Xð i≥jjθ;aiÞ¼
exphαiθ−βiji
1þ exp αi θ−βij
h i; ð1Þ
where Pij is the cumulative probability that a person re-ceives a score on thejth or higher category (j= 1, 2,…, J) for item i (i= 1, …, I). In Eq. 1,θ represents underlying health status, βij is the item response parameter (also re-ferred to as the difficulty parameter) for categoryjor above relative to lower categories andαiis the item discrimination parameter (i.e., slope) for itemiindicating the relationship between the item and the latent construct [33].
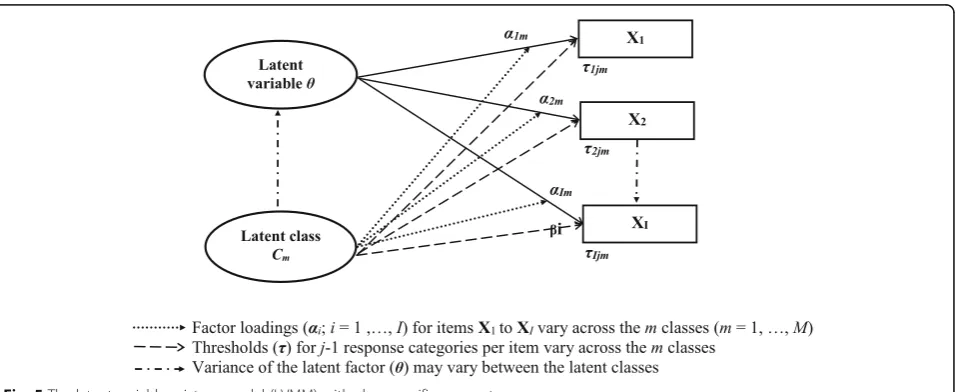
We adopted Muthén’s LVMM framework [34], which estimates factor loadings (λ) and item thresholds (τ); these can be converted to item discrimination and diffi-culty parameters [35]. The item factor loadings and thresholds in the LVMM are allowed to vary across two or more latent classes (see Figure in Appendix).
The conditional cumulative probability of the item re-sponse within themth latent class is estimated by.
Pijm Xð i≥jjθ;C¼mÞ¼
expλimθ−τijm 1þ exp λimθ−τijm
ð2Þ
In Eq. 2,C denotes the latent class variable (m =1,…, M),λim is the estimated factor loading for item iwithin class m, andτijmis the estimated threshold for response categories at or above category j for item i within class
m. The cumulative probability of an item response for categoryjand higher for a respondent is estimated by:
Pij¼
XM
m¼1 πmPijmðXi≥jjθÞ
; ð3Þ
whereπmis the posterior probability for a respondent belonging to the mth latent class [35]. The posterior probability was estimated using Bayes’theorem [36]. Re-spondents were assigned to the latent class with the lar-gest posterior probability among the classes.
To examine DIF and its impact on the underlying la-tent health variable (i.e., PF or MH), we adopted a four-step procedure [10]: (a) fit the standard IRT two-parameter GRM (i.e., one-class model), and multiple-class LVMMs to identify the best-fit model, (b) test for differences in the model parameters across the latent classes, (c) characterize potential sources of DIF by com-paring within-class item response percentages and test associations of class membership with the covariates, and (d) examine the impact of DIF by comparing pre-dicted factor scores between the one-class GRM and the multiple-class LVMM.
The differences in threshold parameters amongst the latent classes were tested for each item using a likelihood ratio (LR) test [37, 43]. Specifically, a model with free threshold parameters for an item was compared with a model in which the threshold pa-rameters were constrained to be equal across classes for an item. A statistically significant difference be-tween the two models indicates uniform DIF for the item [7].
Multinomial logistic regression with pseudo-class ran-dom draws was used to characterize the latent classes on selected demographic and health status variables. Age was categorized as younger (25–64 years) and older (65+ years). BMI was categorized as overweight and obese (BMI ≥ 25.0) versus underweight and normal weight (BMI < 25.0) [44]. Based on the distribution of the HUI3, scores were categorized as low (<0.8) and high (≥0.8). Odds ratios (ORs) and 95% confidence intervals (95% CIs) were reported.
Predicted factor scores and the most likely class mem-bership for each respondent were obtained from the best-fitting LVMM. The reliability of the predicted factor scores was evaluated by the conditional standard error of measurement (CSEM), which was calculated as the inverse of the square root of the information function [45]. Skewness was examined for the distribution of the predicted factor scores [46].
SAS 9.3 was used to prepare the data and conduct the descriptive analyses [47]. The LVMM analysis was con-ducted with Mplus version 7.11 [29].
Results
Description of cohort
The CaMos cohort was comprised of 9423 respondents. In total, 9337 (99.1%), and 9395 respondents (99.7%) had complete data on the 10 PF items and five MH items, respectively.
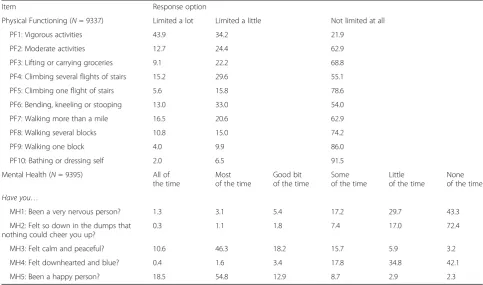
For the PF items, close to half (43.9%) of respondents reported being limited a lot in vigorous activities, while less than 6.0% of respondents reported being limited a lot when climbing one flight of stairs, walking one block, or bathing/dressing (Table 1). For the MH items, less than 2.0% of respondents reported that they were ner-vous, so down in the dumps that nothing could cheer them up, or feeling downhearted and blue all of the time.
Examination of unidimensionality and local independence For the PF sub-scale items, the IRT two-parameter GRM fit the data well as evidenced by absolute values of standardized residuals less than 1.96 for all items. The difference between observed and predicted propor-tions of item responses was not statistically significant
Table 1Distribution of item responses (%) for the SF-36 sub-scale items
Item Response option
Physical Functioning (N= 9337) Limited a lot Limited a little Not limited at all
PF1: Vigorous activities 43.9 34.2 21.9
PF2: Moderate activities 12.7 24.4 62.9
PF3: Lifting or carrying groceries 9.1 22.2 68.8
PF4: Climbing several flights of stairs 15.2 29.6 55.1
PF5: Climbing one flight of stairs 5.6 15.8 78.6
PF6: Bending, kneeling or stooping 13.0 33.0 54.0
PF7: Walking more than a mile 16.5 20.6 62.9
PF8: Walking several blocks 10.8 15.0 74.2
PF9: Walking one block 4.0 9.9 86.0
PF10: Bathing or dressing self 2.0 6.5 91.5
Mental Health (N= 9395) All of the time
Most of the time
Good bit of the time
Some of the time
Little of the time
None of the time
Have you…
MH1: Been a very nervous person? 1.3 3.1 5.4 17.2 29.7 43.3
MH2: Felt so down in the dumps that nothing could cheer you up?
0.3 1.1 1.8 7.4 17.0 72.4
MH3: Felt calm and peaceful? 10.6 46.3 18.2 15.7 5.9 3.2
MH4: Felt downhearted and blue? 0.4 1.6 3.4 17.8 34.8 42.1
(χ2 = 9.01, df = 27, p = 0.999), suggesting that the 10 items represented a single construct.
Confirmatory factor analysis for a single latent con-struct resulted in RMSEA = 0.11 and CFI = 0.98, with the former indicating poor model fit. A con-firmatory factor analysis model with error covariances between five pairs of items (PF1 and PF2, PF2 and PF3, PF4 and PF5, PF7 and PF8, PF8 and PF9) re-sulted in a good fit (RMSEA = 0.057, CFI = 0.99). Thus, the factor structure suggested a single latent factor solution for the PF scale items. Pairwise com-parisons of predicted and observed proportions of item responses for all items revealed a poor fit to the data (χ2 = 3020.96, df = 351, p < 0.001), suggesting that the assumption of local independence might not be tenable and heterogeneous subgroups might exist in the sample [16, 48].
For the MH sub-scale, the IRT two-parameter GRM fit the data well with respect to a unidimensional model. Absolute values of standardized residuals were less than 1.96 for all sub-scale items. Univariate model fit statistics indicated a non-significant differ-ence between observed and predicted item responses (χ2 = 6.61, df = 29, p = 0.999). Confirmatory factor analysis revealed that one-factor model was not a good fit as judged by the RMSEA = 0.15, although the CFI (0.97) indicated good fit. These results sup-port a single dominant latent factor for both the PF and MH sub-scale items. However, a statistically sig-nificant difference in the joint distributions of item pairs (χ2 = 1952.12, df = 159, p < 0.001) for MH sub-scale was also observed, suggesting that local de-pendence might exist, and thus a mixture IRT model with more than one class might be a better choice to account for local dependence.
Fitting models with latent classes
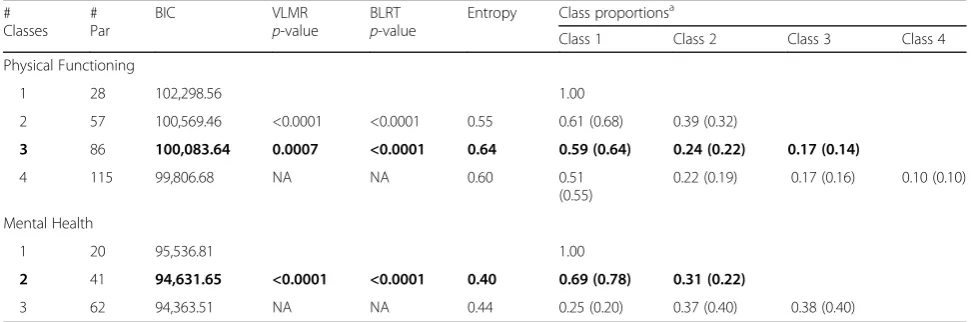
For the PF sub-scale, the three-class LVMM had a better fit than the one- and two-class models; the BIC, VLMR and BLRT all favored the three-class model (Table 2). For the MH sub-scale, the two-class model yielded bet-ter fit indices than the one-class GRM. Therefore, three-and two-class models were chosen as the best-fitting models for the PF and MH sub-scales, respectively (Table 2).
For the PF sub-scale items, threshold values in class 2 were uniformly larger than in class 1. As well, there were larger threshold values amongst respondents in class 3 than in class 2. This indicates that respondents with the same level of latent ability had higher probabilities of en-dorsing lower categories for items representing limited PF in class 2 and class 3 relative to class 1. Differences in factor loadings were found for the items across the classes, suggesting that items varied in their ability to differentiate amongst respondents.
For the MH sub-scale, the absolute value of differences in item thresholds between the two classes ranged from 0.38 for MH1 to 3.56 for MH5. Factor loadings for class 2 were smaller than for class 1.
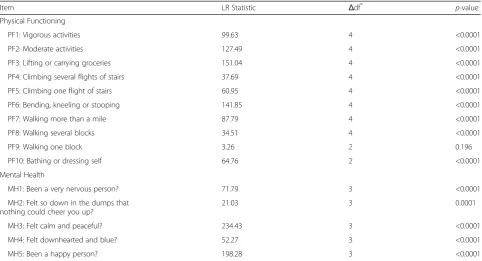
Table 3 shows the LR statistics to test for DIF on PF and MH sub-scale items. Overall, nine of the 10 items for the PF sub-scale and all the five items in the MH sub-scale showed uniform DIF.
Sources of DIF
Figure 1 compares the response percentages for each of the three latent classes on the PF sub-scale items. The prevalence of PF limitations was significantly higher in classes 2 and 3 compared to class 1. Overall, 98.2% of respondents reported having limitations in class 3 on
“vigorous activities”compared to only 67.4% for class 1.
Table 2Model fit statistics and class proportions for latent variable mixture models on the SF-36 physical functioning and mental health sub-scale items
# Classes
# Par
BIC VLMR
p-value
BLRT p-value
Entropy Class proportionsa
Class 1 Class 2 Class 3 Class 4
Physical Functioning
1 28 102,298.56 1.00
2 57 100,569.46 <0.0001 <0.0001 0.55 0.61 (0.68) 0.39 (0.32)
3 86 100,083.64 0.0007 <0.0001 0.64 0.59 (0.64) 0.24 (0.22) 0.17 (0.14)
4 115 99,806.68 NA NA 0.60 0.51
(0.55)
0.22 (0.19) 0.17 (0.16) 0.10 (0.10)
Mental Health
1 20 95,536.81 1.00
2 41 94,631.65 <0.0001 <0.0001 0.40 0.69 (0.78) 0.31 (0.22)
3 62 94,363.51 NA NA 0.44 0.25 (0.20) 0.37 (0.40) 0.38 (0.40)
Bold values indicate the model that was selected for further analysis. # Par = number of parameters.BICBayesian information criterion.VLMR Vuong-Lo-Mendell-Rubin likelihood ratio test.BLRTBootstrap likelihood ratio test.NANot Applicable
a
As well, 99.8% of respondents had limitations on“ climb-ing several flights of stairs” in class 3 compared to only 26.7% in class 1.
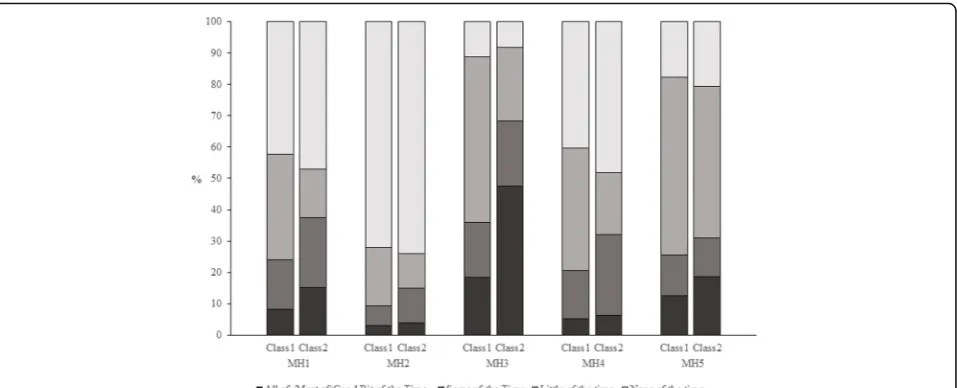
Similarly, respondents reported more MH problems in class 2 than class 1 (Fig. 2). For example, 15.2% of re-spondents in class 2 reported having been a very ner-vous person (MH1) all of the time/most of the time/a
good bit of the time, compared to just 8.3% of respon-dents in class 1. Close to half (47.4%) of responrespon-dents in class 2 reported feeling calm and peaceful none of the time/little of the time/some of the time relative to only 18.5% of respondents in class 1.
Table 4 contains the results for the logistic regression ana-lysis of the associations between latent class membership
Table 3Likelihood ratio (LR) test statistics for differential item functioning on the SF-36 physical functioning and mental health sub-scale items
Item LR Statistic Δdf*
p-value Physical Functioning
PF1: Vigorous activities 99.63 4 <0.0001
PF2: Moderate activities 127.49 4 <0.0001
PF3: Lifting or carrying groceries 151.04 4 <0.0001
PF4: Climbing several flights of stairs 37.69 4 <0.0001
PF5: Climbing one flight of stairs 60.95 4 <0.0001
PF6: Bending, kneeling or stooping 141.85 4 <0.0001
PF7: Walking more than a mile 87.79 4 <0.0001
PF8: Walking several blocks 34.51 4 <0.0001
PF9: Walking one block 3.26 2 0.196
PF10: Bathing or dressing self 64.76 2 <0.0001
Mental Health
MH1: Been a very nervous person? 71.79 3 <0.0001
MH2: Felt so down in the dumps that nothing could cheer you up?
21.03 3 0.0001
MH3: Felt calm and peaceful? 234.43 3 <0.0001
MH4: Felt downhearted and blue? 52.27 3 <0.0001
MH5: Been a happy person? 198.28 3 <0.0001
LR statistics are for the comparison of nested models: (a) mixture IRT model with free thresholds across classes for each item, and (b) IRT model with constrained thresholds across classes for each item. The mixture IRT model accounted for local dependence. Note that the latent variable mixture model for the physical functioning sub-scale had 3 classes and the model for the mental health sub-scale had 2 classes.Δdf is the difference in degrees of freedom for models defined in (a) and (b)
and the demographic and health status variables. For the three classes for the PF sub-scale items, the odds of class membership were higher for females, older respondents, those with a lower level of general health status, and lower HUI3 index scores in both of classes 2 and 3, relative to class 1. Respondents with lower educational attainment (i.e., less than high school), and who were overweight/ obese had a greater odds of being in class 3 than in class 1. For the MH sub-scale, the logistic model revealed that respondents of older age, with less than high school edu-cation, and good health had a greater odds of being in class 2 than class 1.
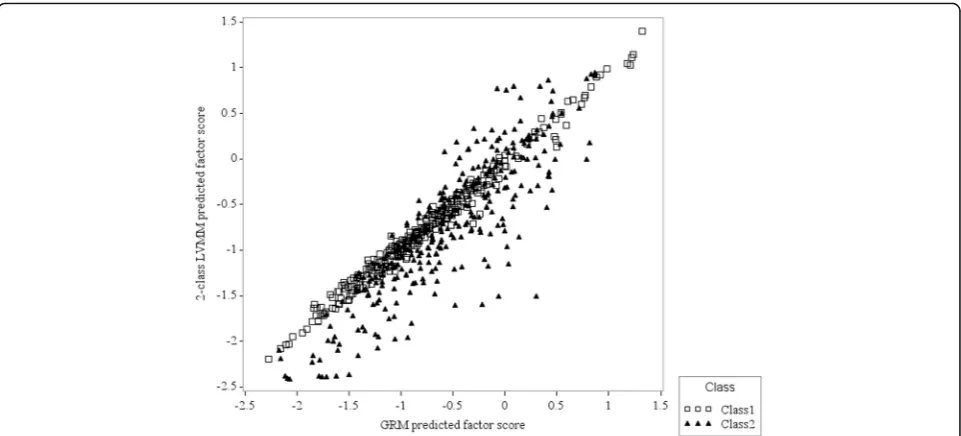
Impact of DIF on predicted factor scores
For the PF sub-scale, factor scores for the standard one-class GRM and the three-one-class LVMM were strongly correlated (Pearson r = 0.89). Despite the high correl-ation, there were differences in the tails of the distribu-tions. The standardized difference was≤ −0.5 for 20.2% of the sample and≥0.3 for 26.2% of the sample (Fig. 3).
For the MH sub-scale, differences in factor scores be-tween the one-class and two-class models for the MH items were also observed. Specifically, 2.6% of respon-dents had a standardized difference≥0.3 and 3.9% of re-spondents had a difference≤ −0.3 (Fig. 4).
There were differences in the CSEMs between the one-class and multi-one-class models. For example, relative to the one-class model for the PF sub-scale items, in the three-class model there was greater measurement precision in the lower range of the theta distribution (i.e., theta <0) for class 1; greater measurement precision was observed in the upper range of the theta distribution (theta >0) for class 3.
Discussion
Using a LVMM, this study identified three groups of indi-viduals with different response patterns on the SF-36 PF sub-scale items and two groups of individuals with differ-ent response patterns on the MH sub-scale items in the population-based CaMos. For both sub-scale analyses, la-tent class 1 primarily contained respondents with fewer health limitations or problems. For the PF sub-scale, class 2 and 3 respondents were more likely to be female, older, and in poorer health than respondents in class 1. For the MH sub-scale, older respondents with lower education and good health were more likely to be in class 2. These findings indicate that DIF is present in unobserved groups, and the source of DIF can be at least partly explained by demographic and health status variables.
The results for the PF sub-scale are consistent with those from a previous study of the Canadian adult popu-lation [10], in which a three-class LVMM was found to fit the data better than one- or two-class models. We observed similar results in terms of item response pat-terns, effect of DIF on the latent factor scores, and the relationship between the latent class membership and selected socio-demographic and health variables. That previous study also found that the first latent class con-tained more people with no limitations in PF than the other two classes, and that sex, age and health status were associated with latent class membership. This pro-vides support for our conclusion that DIF can affect re-sponses to the SF-36 items and helps to validate the utility of the mixture model for exploring DIF.
Table 4Distribution (%) and odds ratios (ORs) for demographic and health status characteristics by latent class
Distribution (%) OR (95% CI)
Class 1 Class 2 Class 3 Class 2 Class 3
Physical Functioning
Class Frequencies 5933 2081 1323
Sex
Men 35.5 23.4 20.6 Ref Ref
Women 64.5 76.6 79.4 1.66(1.44, 1.91) 1.76(1.48, 2.10)
Age
25–64 years 60.5 40.7 31.0 Ref Ref
≥65 years 39.5 59.3 69.0 1.69(1.48, 1.92) 1.81(1.55, 2.12)
Education
Postsecondary 53.7 43.7 33.0 Ref Ref
High school graduate 14.9 14.0 13.8 1.01 (0.84, 1.22) 1.11 (0.88, 1.38)
Less than high school 31.4 42.4 53.2 1.13 (0.98, 1.30) 1.32(1.12, 1.56)
General Health
Excellent/Very good 68.1 42.0 30.0 Ref Ref
Good 26.3 43.2 40.7 1.99(1.73, 2.29) 1.86(1.58, 2.18)
Fair/Poor 5.6 14.8 29.3 2.42(1.94, 3.01) 3.53(2.78, 4.47)
Weight Status
Underweight/Normal 37.1 39.3 31.9 Ref Ref
Overweight/Obese 62.9 60.7 68.1 0.99 (0.87, 1.12) 1.21(1.04, 1.41)
HUI3
High (≥0.8) 81.1 58.9 38.3 Ref Ref
Low (<0.8) 18.9 41.1 61.8 1.92(1.67, 2.22) 2.62(2.22, 3.09)
Mental Health
Class Frequencies 7337 2058
Sex
Men 30.9 29.7 Ref
Women 69.1 70.3 1.03 (0.90, 1.17)
Age
25–64 years 53.8 44.8 Ref
≥65 years 46.3 55.2 1.18(1.05, 1.33)
Education
Postsecondary 50.2 42.4 Ref
High school graduate 14.6 14.1 1.09 (0.91, 1.30)
Less than high school 35.2 43.4 1.21(1.06, 1.38)
General Health
Excellent/Very good 58.7 49.8 Ref
Good 31.1 36.5 1.13(1.00, 1.28)
and peaceful?”, and“Have you been a happy person?”. The low values of the factor loadings for the two items in the second latent class suggests that the two items have low ability to discriminate between respondents having higher and lower levels of mental health. In other words, a unit change in the factor scores in one class is not associated with the same change in the factor scores in the other class [5]. Possible reasons may be the different wording format for these two items when compared to the other MH items. Previous studies have reported that combina-tions of negatively and positively worded quescombina-tions may compromise internal consistency of measures [49, 50].
The LVMM offers a number of advantages for DIF detec-tion relative to tradidetec-tional IRT models that focus on DIF in-vestigations for manifest variables. The standard IRT model assumes there is one homogeneous group (i.e. one latent class) of individuals within a population and DIF is exam-ined for subgroups of the population based on manifest characteristics. However, true sources of DIF may not be limited to manifest groups (i.e., sex, age) conditional on their
latent ability. The LVMM is optimal for DIF examination when the origin(s) of differential response patterns is not known a priori. Prior studies have revealed that the mixture IRT model is a good alternative for detecting DIF [15, 17].
In implementing the LVMM, a critical step is to identify the best-fitting model with an appropriate number of latent classes. A potential problem can arise when the model con-verges on a local solution rather than the expected global maximum likelihood solution, resulting in biased model pa-rameters [51]. To test the stability of the parameter esti-mates for the multiple-class models, we performed analyses by fitting models with the same number of classes but with different numbers of random starts [29]. The parameter es-timates from the models with different sets of random starts were very similar, suggesting a stable and robust result. Another critical step is to characterize the latent classes. To do this, we used a pseudo-class methodology [52, 53] that has been shown to produce unbiased param-eter estimates [52, 54]. Inaccurate numbers of latent classes may result from misspecification of the model [55], or the
Table 4Distribution (%) and odds ratios (ORs) for demographic and health status characteristics by latent class(Continued)
Weight Status
Underweight/Normal 37.4 34.8 Ref
Overweight/Obese 62.6 65.2 1.07 (0.96, 1.21)
HUI3
High (≥0.8) 71.5 65.0 Ref
Low (<0.8) 28.5 35.0 1.01 (0.89, 1.16)
95% CI = 95% confidence interval; HUI3 = Health Utilities Index Mark 3; bold values indicate ORs that are statistically significant atα= .05. Class 1 is the reference group for both models. For the physical functioning sub-scale, the latent variable mixture model has three classes, while for the mental health sub-scale, the latent variable mixture model has two classes
distribution of the data [56]. However, simulation and em-pirical studies have demonstrated the sensitivity of the LVMM [14–16, 20, 21, 57–59] for DIF assesment. Use of LVMMs can aid researchers to identify and characterize DIF effects in self-reported health outcome measures.
In the context of testing for DIF using the LVMM, there has been discussion in the literature about the optimal ap-proach to scale the latent variable(s) in order to enable comparisons of item parameters. One approach is to allow latent factor means and variances to vary in each class, with equality constraints for item thresholds for one or more class-invariant items (also called anchor items) [60]. For this method, anchor items must be identified. Another approach is to set the latent factor means to zero and variances to one across classes; then the item parameters (i.e., factor loadings or item thresholds) are freely esti-mated across classes. We adopted this latter approach (i.e., with unequal item thresholds across classes). We sub-sequently tested for DIF on each item by fitting a set models with constrained item thresholds between latent classes for each item one at a time. The method has been used in previous studies for DIF detection using LVMMs [20, 61].
The study limitations must also be acknowledged. We analysed only the SF-36 PF and MH sub-scale items. Other sub-scales may also exhibit DIF, but they contain small numbers of items and therefore are more difficult to analyze using LVMMs. The sample was comprised of a smaller proportion of men and more older adults than in the general Canadian population; the findings may there-fore not be representative of younger people and men. Al-though we observed comparable findings regarding DIF
effects for the PF sub-scale with previous research in Canada [9], further research is needed to determine whether our findings are applicable to populations from other countries. Strengths of the present study include the use of a large national population-based sample, and the ability to consider both demographic and health status variables to characterize the latent classes. Other health status variables, such as the presence of selected chronic conditions, might be considered, if supported by research.
Conclusions
In conclusion, this study identified latent groups of respon-dents for whom the SF-36 PF and MH items function dif-ferently in a diverse national adult sample. The LVMM was a useful tool to define sub-groups of individuals with similar item response patterns and investigate characteristics po-tentially associated with group member. This analysis pro-vides information that can be useful for generating hypotheses for future studies about DIF; for example, one might use these results to conduct DIF analyses for ob-served population sub-groups in independent samples. Testing for DIF should be a routine part of comparative analyses of population health status. The comparability of SF-36 sub-scale scores can be significantly compromised by heterogeneity in item responses, which can affect the inter-pretation of results from clinical and epidemiologic studies. Future study is needed to validate the present findings in other samples to inform generalizability of the results. Fu-ture research might also compare the sensitivity of the PF and MH sub-scales to detect DIF effects using both mani-fest variable and LVMM approaches.
Appendix
Acknowledgements
We thank all those participants in CaMos whose careful responses and attendance made this analysis possible. We thank the CaMos Research Group for access to the data to complete this study:
•David Goltzman (co-principal investigator, McGill University), Nancy Kreiger (co-principal investigator, Toronto), Alan Tenenhouse (principal investigator emeritus, Toronto),
•CaMos Coordinating Centre, McGill University, Montreal, Quebec: Suzette Poliquin (national coordinator emeritus), Suzanne Godmaire (research assistant), Silvia Dumont (administrative assistant), Claudie Berger (study statistician), Lisa Langsetmo (Fellow).
•Memorial University, St. John’s, Newfoundland: Carol Joyce (director), Christopher Kovacs (co-director), Emma Sheppard (coordinator).
•Dalhousie University, Halifax, Nova Scotia: Susan Kirkland, Stephanie Kaiser (co-directors), Barbara Stanfield (coordinator).
•Laval University, Quebec City, Quebec: Jacques P. Brown (director), Louis Bessette (co-director), Marc Gendreau (coordinator).
•Queen’s University, Kingston, Ontario: Tassos Anastassiades (director), Tanveer Towheed (co-director), Barbara Matthews (coordinator), Wilma Hopman (scientist).
•University of Toronto, Toronto, Ontario: Bob Josse (director), Sophie Jamal (co-director), Tim Murray (past director), Barbara Gardner-Bray (coordinator), Angela Cheung (scientist).
•McMaster University, Hamilton, Ontario: Jonathan D. Adachi (director), Alexandra Papaioannou (co-director), Laura Pickard (coordinator).
•University of Saskatchewan, Saskatoon, Saskatchewan: Wojciech P. Olszynski (director), K. Shawn Davison (co-director), Jola Thingvold (coordinator).
•University of Calgary, Calgary, Alberta: David A. Hanley (director), Jane Allan (coordinator).
•University of British Columbia, Vancouver, British Columbia: JerilynnC. Prior (director), Millan Patel (co-director), Nera Andjelic (coordinator), Brian Lentle (radiologist).
Funding
The research team was funded by the Canadian Institutes of Health Research (Funding Reference #122110). LML is supported by a Manitoba Research Chair from Research Manitoba. CaMos is currently supported by the Canadian Institutes of Health Research, Amgen Canada Inc., Dairy Farmers of Canada, Merck Canada, Eli Lilly Canada, and Novartis Canada.
Availability of data and materials
The data that support the findings of this study are available from the CaMos principal investigators, Dr. David Goltzman and Dr. Nancy Krieger, but restricions apply to the availability of these data. The CaMos has developed an Ancillary Project and Data Release Policy that governs ancillary project approval and access to the data. To obtain a copy of the Ancillary Project and Data Release Policy and the requirements for proposal submission, or to obtain further information from the CaMos principal investigators about data access, please send an e-mail to [email protected].
Authors’contributions
XW, RS, WH, NM, TTS, JL, and LML conceived the study design. WH, JP, AP, RGJ, TT, and KSD contributed to acquisition of the data and interpretation of study results. XW, RS, and LML analyzed the data. XW, RS, and LML drafted the manuscript. All authors provided feedback on a draft version of the manuscript and read and approved the final manuscript.
Competing interests
The authors declare that they have no competing interests.
Consent for publication
Not applicable.
Ethics approval and consent to participate
Approval for this research was provided by the University of Manitoba Health Research Ethics Board. All study particiants provided consent to participate in the study.
Publisher’s Note
Springer Nature remains neutral with regard to jurisdictional claims in published maps and institutional affiliations.
Author details
O’Brien Institute for Public Health, University of Calgary, Calgary, AB, Canada. 7Department of Mathematics and Statistics, University of Saskatchewan, Saskatoon, SK, Canada.8Division of Endocrinology, Department of Medicine, University of British Columbia, Vancouver, BC, Canada.9Department of Medicine, McMaster University, Hamilton, ON, Canada.10Department of Medicine, Faculty of Medicine, University of Toronto, Toronto, ON, Canada. 11Department of Medicine, Queen’s University, Kingston, ON, Canada. 12
Faculty of Graduate Studies, University of Victoria, Victoria, BC, Canada. 13Department of Community Health Sciences, University of Manitoba, S113-750 Bannatyne Ave, Winnipeg, MB R3E 0W3, Canada.
Received: 11 July 2016 Accepted: 4 May 2017
References
1. Hopman WM, Towheed T, Anastassiades T, Tenenhouse A, Poliquin S, Berger C, et al. Canadian normative data for the SF-36 health survey. Canadian Multicentre osteoporosis study research group. Can Med Assoc J. 2000;163:265–71.
2. Reeve BB, Wyrwich KW, Wu AW, Velikova G, Terwee CB, Snyder CF, et al. ISOQOL recommends minimum standards for patient-reported outcome measures used in patient-centered outcomes and comparative effectiveness research. Qual Life Res. 2013;22:1889–905.
3. Mokkink LB, Terwee CB, Patrick DL, Alonso J, Stratford PW, Knol DL, et al. The COSMIN checklist for assessing the methodological quality of studies on measurement properties of health status measurement instruments: an international Delphi study. Qual Life Res. 2010;19:539–49.
4. Terwee CB, Bot SD, de Boer MR, van der Windt DA, Knol DL, Dekker J, et al. Quality criteria were proposed for measurement properties of health status questionnaires. J Clin Epidemiol. 2007;60:34–42.
5. Lix LM, Acan Osman B, Adachi JD, Towheed T, Hopman W, Davison KS, Leslie WD. Measurement equivalence of the SF-36 in the Canadian Multicentre osteoporosis study. Health Qual Life Outcomes. 2012;10:29. 6. Vandenberg R, Lance C. A review and synthesis of the measurement
invariance literature: suggestions, practices, and recommendations for organizational research. Organ Res Methods. 2000;3(1):4–70.
7. Teresi JA, Fleishman JA. Differential item functioning and health assessment. Qual Life Res. 2007;16(Suppl 1):33–42.
8. Lix LM, Wu X, Hopman W, Mayo N, Sajobi TT, Liu J, et al. Differential item functioning in the SF-36 physical functioning and mental health sub-scales: a population-based investigation in the Canadian Multicentre osteoporosis study. PLoS One. 2016;11(3):e0151519.
9. Perkins AJ, Stump TE, Monahan PO, McHorney CA. Assessment of differential item functioning for demographic comparisons in the MOS SF-36 health survey. Qual Life Res. 2006;15:331–48.
10. Sawatzky R, Ratner PA, Kopec JA, Zumbo BD. Latent variable mixture models: a promising approach for the validation of patient reported outcomes. Qual Life Res. 2012;21:637–50.
11. Bjorner JB, Kreiner S, Ware JE, Damsgaard MT, Bech P. Differential item functioning in the Danish translation of the SF-36. J Clin Epidemiol. 1998;51: 1189–202.
12. Fleishman JA, Lawrence WF. Demographic variation in SF-12 scores: true differences or differential item functioning? Med Care. 2003;41(7 Suppl): III75–86.
13. Edelen MO, Reeve BB. Applying item response theory (IRT) modeling to questionnaire development, evaluation, and refinement. Qual Life Res. 2007; 16(Suppl 1):5–18.
14. Oliveri ME, Ercikan K, Zumbo B. Analysis of sources of latent class differential item functioning in international assessments. Int J Test. 2013;13:272–93. 15. Maij-de Meij AM, Kelderman H, van der Flier H. Improvement in detection
of differential item functioning using a mixture item response theory model. Multivar Behav Res. 2010;45:975–99.
16. Cohen AS, Bolt DM. A mixture model analysis of differential item functioning. J Educ Meas. 2005;42:133–48.
17. Samuelsen KM. Examining differential item functioning from a latent class perspective. In G. R. Hancock & K. M. Samuelsen, editors. Advances in latent variable mixture models, Charlotte NC: Information Age Publishing; 2008, p. 177-197.
18. Lubke G, Neale M. Distinguishing between latent classes and continuous factors with categorical outcomes: class invariance of parameters of factor mixture models. Multivar Behav Res. 2008;43:592–620.
19. De Ayala RJ, Kim S, Stapleton LM, Dayton CM. Differential item functioning: a mixture distribution conceptualization. Int J Test. 2002;2:243–76. 20. Chen Y, Jiao H. Exploring the utility of background and cognitive variables
in explaining latent differential item functioning: an example of the PISA 2009 reading assessment. Educ Assess. 2014;19:77–96.
21. Webb ML, Cohen AS, Schwanenflugel PJ. Latent class analysis of differential item functioning on the Peabody picture vocabulary test-III. Educ Psychol Meas. 2008;68:335–51.
22. Yu YF, Yu AP, Ahn J. Investigating differential item functioning by chronic diseases in the SF-36 health survey: a latent trait analysis using MIMIC models. Med Care. 2007;45:851–9.
23. Pollard B, Johnston M, Dixon D. Exploring differential item functioning in the SF-36 by demographic, clinical, psychological and social factors in an osteoarthritis population. BMC Musculoskelet Disord. 2013;14:346. 24. Kreiger N, Tenenhouse A, Joseph L, Mackenzie T, Poliquin S, Brown JP, et al.
The Canadian Multicentre osteoporosis study (CaMos): background, rationale, methods. Can J Aging. 1999;18:376–87.
25. Ware JE Jr, Sherbourne CD. The MOS 36-item short-form health survey (SF-36). I. Conceptual framework and item selection. Med Care. 1992;30:473–83. 26. Horsman J, Furlong W, Feeny D, Torrance G. The health utilities index (HUI):
concepts, measurement properties and applications. Health Qual Life Outcomes. 2003;1:54.
27. Feeny D, Furlong W, Torrance GW, Goldsmith CH, Zhu Z, DePauw S, et al. Multi-attribute and single-attribute utility functions for the health utilities index mark 3 system. Med Care. 2002;40:113–28.
28. Haberman SJ. The analysis of residuals in cross-classified tables. Biometrics. 1973;29:205–20.
29. Muthén LK, Muthén BO. Statistical analysis with latent variables. MPlus user guide, 7th ed. 2012. Los Angeles, CA: Muthén & Muthén.
30. MacCallum RC, Browne MW, Sugawara HM. Power analysis and determination of sample size for covariance structure modeling. Psychol Methods. 1996;1:130–49.
31. Hu LT, Bentler PM. Cutoff criteria for fit indices in covariance structure analysis: conventional criteria versus new alternatives. Struct Equ Model. 1999;6:1–55.
32. Chen W, Thissen D. Local dependence indexes for item pairs using item response theory. J Educ Behav Stat. 1997;22:265–89.
33. Samejima, F. (1969). Estimation of latent ability using a response pattern of graded scores. Psychometrika. 1969 34:100.
34. Muthén B. Latent variables hybrids: overview of old and new models. In G. R. Hancock & K. M. Samuelsen, editors, Advances in latent variable mixture models (pp. 1-24). 2008. Charlotte, NC: Information Age Publishing. 35. Kamata A, Bauer DJ. A note on the relation between factor analytic and
item response theory models. Struct Equ Model. 2008;15:136–53. 36. Dayton C. Latent class scaling analysis. Thousand Oaks, CA: Sage; 1998. 37. Nylund KL, Asparouhov T, Muthén BO. Deciding on the number of classes
in latent class analysis and growth mixture modeling: a Monte Carlo simulation study. Struct Equ Model. 2007;14:535–69.
38. Li F, Cohen AS, Kim S, Cho S. Model selection methods for mixture dichotomous IRT models. Appl Psychol Meas. 2009;33:353–73. 39. Vuong QH. Likelihood ratio tests for model selection and non-nested
hypotheses. Econometrica. 1989;57:307–33.
40. Muthén B, Brown CH, Masyn K, Jo B, Khoo ST, Yang CC, et al. General growth mixture modeling for randomized preventive interventions. Biostatistics. 2002;3:459–75.
41. Holland PW. A framework and history for score linking. In: Dorans NJ, Pommerich M, Holland PW, editors. Linking and aligning scores and scales. New York: Springer; 2007. p. 5–30.
42. Kolen MJ, Brennan RL. Test equating, scaling, and linking. Methods and practices. 2nd ed. New York: Springer; 2004.
43. Cohen AS, Kim S, Wollack JA. An investigation of the likelihood ratio test for detection of differential item functioning. Appl Psychol Meas. 1996;20:15–26.
44. Canada H. Canadian guidelines for body weight classification in adults (publication ID 4645). Ottawa: Health Canada Publications Centre; 2003. 45. De Ayala RJ. The theory and practice of item response theory. New York:
Guilford Press; 2009.
46. Joanes DN, Gill CA. Comparing measures of sample skewness and kurtosis. Statistician. 1998;47:183–9.
48. Reise SP, Gomel JN. Modeling qualitative variation within latent trait dimensions: application of mixed-measurement to personality assessment. Multivar Behav Res. 1995;30:341–58.
49. Spector PE, Van Katwyk PT, Brannick MT, Chen PY. When two factors don't reflect two constructs: how item characteristics can produce artifactual factors. J Manag. 1997;23:659–77.
50. Sawatzky R, Ratner PA, Johnson JL, Kopec JA, Zumbo BD. Sample heterogeneity and the measurement structure of the multidimensional students’life satisfaction scale. SOCI. 2009;94:273–96.
51. Rost J. A logistic mixture distribution model for polychotomous item responses. Br J Math Stat Psychol. 1991;44:75–92.
52. Wang CP, Hendricks BC, Bandeen-Roche K. Residual diagnostics for growth mixture models: examining the impact of a preventive intervention on multiple trajectories of aggressive behavior. JAMA. 2005;100:1054–76. 53. Muthén B, Muthén L. Wald test of mean equality for potential latent class
predictors in mixture modeling. 2007. http://www.statmodel.com/ download/MeanTest1.pdf. Accessed 30 Mar, 2016.
54. Clark SL, Muthén B. Relating latent class analysis results to variables not included in the analysis. 2009. http://www.statmodel.com/download/ relatinglca.pdf. Accessed 30 Mar, 2016.
55. Bauer DJ, Curran PJ. The integration of continuous and discrete latent variable models: potential problems and promising opportunities. Psychol Methods. 2004;9:3–29.
56. Bauer DJ, Curran PJ. Distributional assumptions of growth mixture models: implications for over extraction of latent trajectory classes. Psychol Methods. 2003;8:338–63.
57. Lubke G, Muthén BO. Performance of factor mixture models as a function of model size, covariate effects, and class-specific parameters. Struct Equ Model. 2007;14:26–47.
58. Finch WH, French BF. Parameter estimation with mixture item response theory models: a Monte Carlo comparison of maximum likelihood and Bayesian methods. J Mod App Stat Methods. 2012;11:167–78. 59. Jiao H, Macready G, Liu J, Cho Y. A mixture Rasch model–based
computerized adaptive test for latent class identification. Appl Psychol Meas. 2012;36:469–93.
60. Paek I, Cho S-J. A note on parameter estimate comparability: across latent classes in mixture IRT modeling. Appl Psychol Meas. 2015;39(2):135–43. 61. DeMars CE, Lau A. Differential item functioning detection with latent
classes: how accurately can we detect who is responding differentially? Ed Psychol Meas. 2011;4:597–616.
• We accept pre-submission inquiries
• Our selector tool helps you to find the most relevant journal
• We provide round the clock customer support
• Convenient online submission
• Thorough peer review
• Inclusion in PubMed and all major indexing services
• Maximum visibility for your research
Submit your manuscript at www.biomedcentral.com/submit