ScholarlyCommons
Publicly Accessible Penn Dissertations
1-1-2014
Fluctuations and Entropy in The Energetics and
Function of Protein Complexes
Vignesh Kasinath
University of Pennsylvania, [email protected]
Follow this and additional works at:
http://repository.upenn.edu/edissertations
Part of the
Biochemistry Commons, and the
Biophysics Commons
This paper is posted at ScholarlyCommons.http://repository.upenn.edu/edissertations/1327
Recommended Citation
Kasinath, Vignesh, "Fluctuations and Entropy in The Energetics and Function of Protein Complexes" (2014).Publicly Accessible Penn Dissertations. 1327.
Complexes
Abstract
Conformational entropy is a potentially important thermodynamic parameter contributing to protein function. Quantitative measures of conformational entropy are necessary for an understanding of its role but have been difficult to obtain experimentally. We have recently introduced an empirical calibration method that utilizes the changes in conformational dynamics as a proxy for changes in conformational entropy. This approach raises several questions with regards to the microscopic origins of the measured conformational entropy as well as its general applicability. One of the goals in this work was to probe the microscopic origins of the link between conformational dynamics and conformational entropy. Using MD simulations, we find that the motions of methyl-bearing side chains are sufficiently coupled to that of other side chains and serve as excellently reporters of the overall side chain conformational entropy. We also propose a modified weighting scheme to project the change in NMR-measured methyl dynamics to conformational entropy. This approach has been extended to 36 different protein-ligand complexes each with different ligand types (small molecules, DNA/RNA, peptides and proteins) and binding affinities (10-4to 10-14M). There is excellent agreement between the NMR-measured conformational dynamics derived measure of conformational entropy and the total binding entropy, essentially postulating a 'Universal Entropy Meter'. This universal entropy meter can be utilized to measure the conformational entropy change for any protein-ligand interaction.
The second major goal of this work is to understand the role played by conformational entropy in very high affinity interaction. A dominant view of very high affinity interactions involving proteins is that they are largely driven by both large favorable interactions at the interaction interface and by an increase in solvent entropy due to the creation of dry or solvent depleted interface. The role of conformational entropy, though admitted as a potentially favorable contribution, remains largely obscured by this view. Utilizing NMR measured conformational dynamics, protein conformational entropy was indeed found to play a pivotal role in achieving very high affinity interactions. In the barnase-barstar protein-protein complex (Kd= 10-14M) and the
histamine-binding protein bound to small molecule histamine (Kd = 2.5x10⁻⁹M), large favorable changes in conformational entropy offset unfavorable entropic contributions from both solvent and
rotational-translational contributions. Collectively, these results reveal that this mechanism involving modulation of protein conformational entropy changes to offset other entropic penalties could be a more prevalent paradigm for achieving high affinity interactions than previously anticipated.
Degree Type
Dissertation
Degree Name
Doctor of Philosophy (PhD)
Graduate Group
Keywords
barnase barstar, conformational entropy, dynamics, entropy meter, high affinity, nuclear magnetic resonance
Subject Categories
ENERGETICS AND FUNCTION OF
PROTEIN COMPLEXES
Vignesh Kasinath
A DISSERTATION in
Biochemistry and Molecular Biophysics
Presented to the Faculties of the University of Pennsylvania in
Partial Fulfillment of the Requirements for the Degree of Doctor of Philosophy
2014 Supervisor of Dissertation
A. Joshua Wand, PhD., Benjamin Rush Professor of Biochemistry and Biophysics
Graduate Group Chairperson
Kim A. Sharp, PhD., Associate Professor
Dissertation Committee
Kim A. Sharp, PhD., Associate Prof. of Biochemistry and Biophysics (Committee Chair)
Gregory Van Duyne, PhD., Jacob Gershon-Cohen Prof. of Medical Science
Heinrich Roder, PhD., Professor of Biochemistry and Biophysics (Fox Chase Cancer Center)
Ravinder Reddy, PhD., Professor of Radiology
First and foremost I would like to thank Prof. Joshua Wand, who has been/will be an
amazing mentor and whose insight and guidance were crucial for my thesis work. In
addition to his support, I thank him for his patience, particularly in listening and providing
critical comments on my many crazy and sometimes incorrect ideas. I would also like
to thank Prof. Kim Sharp, who has also been very supportive and from whom I have
learnt a lot from. I cannot thank him enough for his time to both teach me and brainstorm
ideas with me. The knowledge and insight of both my mentors, Josh and Kim, has been
an enriching experience and has served as a wonderful motivation through my thesis
work.
I am also particularly thankful to Dr. Kathleen Valentine for teaching me the ’ABCD’ of
working with NMR and for her never ending enthusiasm for science. Our discussions
were very interesting and something I looked forward to all the time.
I would also like to thank the past and present Wand lab members (John Gledhill,
Nathaniel Nucci, Matt Stetz, Jackwee Lim, Yinan Fu, Igor Dodevski, Sabrina Bedard,
Veronica Moorman, Kyle Harpole, Christine Jorge, Evan O’Brien, Brian Fuglestad,
Bryan Marques). In particular, I would like to thank Yinan Fu, Matt Stetz, Jackwee
Lim, John Gledhill and Nathaniel Nucci for helpful discussions and suggestions.
Special thanks to my friends Dr. Chandrasekhar Gopalakrishnan, Srivatsa Ray, Preeti
Sareen, Dr. Purushottam Dixit, Manas Rachh, Dr. Karthik Shekhar, Kaushik Jayaram,
Sadanand Kamath, Tannishtha Sanyal and Kartik Mohta who have kept me company
and put up with me in the worst of times!
Finally, I would like to thank the people responsible for where I am today, my parents.
Their support and encouragement was more important than they may realize. For my
dad, who has likely spent more time in book stores than at home to get me that one
extra book which might make a difference, I hope he thinks I have done well so far! For
FLUCTUATIONS AND ENTROPY IN THE ENERGETICS AND FUNCTION OF
PROTEIN COMPLEXES
Vignesh Kasinath
A. Joshua Wand, PhD.
Conformational entropy is a potentially important thermodynamic parameter
contribut-ing to protein function. Quantitative measures of conformational entropy are necessary
for an understanding of its role but have been difficult to obtain experimentally. We have
recently introduced an empirical calibration method that utilizes the changes in
confor-mational dynamics as a proxy for changes in conforconfor-mational entropy. This approach
raises several questions with regards to the microscopic origins of the measured
confor-mational entropy and also the validity of the empirical method to different protein-ligand
complexes. One of the goals in this work was to probe the microscopic origins of the
link between conformational dynamics and conformational entropy. Molecular
dynam-ics simulations of seven proteins gave an excellent correlation of the calculated side
chain motion with those of the corresponding measured side-chain motion derived from
NMR relaxation. The simulations show that the motion of methyl-bearing side chain
motion are sufficiently coupled to that of other side chains and serve as excellently
re-porters of the overall side chain conformational entropy. These results validate the use
of experimentally accessible measures of methyl motion - the NMR-derived generalized
order parameter - as a proxy from which to derive changes in protein conformational
entropy. A slightly modified weighting scheme to project the change in dynamics of
experimental methyl dynamics into conformational entropy results in validating the
gen-erality of the dynamical proxy approach to measure conformational entropy changes of
any protein-ligand interaction. Furthermore, In this work this approach has been
ex-tended to 35 different protein-ligand complexes each with different ligand types (small
molecules, DNA/RNA, peptides and proteins) and binding affinities (10−4 - 10−15 M).
There is excellent agreement between the NMR-measured conformational dynamics
The second major goal of this work is to understand the role played by conformational
entropy in very high affinity interaction. A dominant view of very high affinity interactions
involving proteins is that they are largely driven by both large favourable interactions
at the interaction interface and by an increase in solvent entropy due to the creation
of dry or solvent depleted interface. The role of conformational entropy, though
ad-mitted as a potentially favourable contribution, remains largely obscured by this view.
The vast majority of high affinity interactions contain an abundance of aromatic amino
acids at the interaction interface. In order to characterize the contributions of aromatic
amino acid side chains, a new 13C isotope enrichment scheme is introduced which
eliminates all the complexities associated with the NMR relaxation measurement of
aromatic amino acid side chains. The application of this scheme to different protein
sys-tems reveal that aromatic amino acid side chains display a wide range of dynamics than
previously understood. Utilizing both the NMR-measured conformational dynamics of
methyl-bearing and aromatic amino acid side chains, I find that protein conformational
entropy can indeed play a pivotal role in achieving very high affinity interactions. In
the barnase-barstar protein-protein complex (Kd =10−14 M) and the histamine-binding protein bound to small molecule histamine (Kd=2.5x10⁻⁹M), large favourable changes
in conformational entropy offsets unfavourable entropic contributions from both solvent
and rotational-translational contributions. Furthermore, the binding of barnase to the
4mer DNA (dCGAC) is found to be driven by favourable changes in conformational
entropy in the absence of any enthalpic contribution to binding. Collectively, these
re-sults reveal that conformational entropy can provide large favourable contributions to
the binding of both large and small ligands by offsetting other potentially unfavourable
contributions to binding. This suggests that conformational entropy could represent
the missing piece of the puzzle in the quest for the rational design of high-affinity and
Acknowledgements iii
Abstract iv
List of Tables ix
List of Figures xii
1 Introduction 1
1.1 Thermodynamics . . . 1
1.1.1 Entropy change upon ligand binding . . . 5
1.2 Nuclear Magnetic Resonance (NMR) . . . 7
1.2.1 Introduction to NMR [1] . . . 7
1.2.2 Probing molecular motions using NMR. . . 10
1.2.3 Backbone Relaxation and side chain Relaxation . . . 12
1.2.3.1 Backbone Relaxation . . . 16
1.2.3.2 Side chain Relaxation . . . 18
1.3 Conformational Entropy from Protein Dynamics: The History . . . 22
1.3.1 Model Dependent Approach: Harmonic Oscillator. . . 24
1.3.2 Model Independent Approach: Empirical Calibration . . . 25
1.3.3 Questions that need to be addressed . . . 27
2 Insights into the microscopic origins of protein conformational entropy 30 2.1 Introduction . . . 30
2.2 Results . . . 35
2.2.1 Simulation versus Experiment:O2axis . . . 39
2.2.2 Rotamer Entropy from MD andO2axis . . . 43
3 Aromatic amino acid side-chain relaxation 64
3.1 Introduction . . . 64
3.2 Establishing13Clabelling in aromatic amino acids. . . 69
3.3 Fast dynamics of aromatic amino acid side-chain in calmodulin . . . 74
3.4 Summary and Discussion . . . 80
4 A sharp thermal transition of fast aromatic ring dynamics in ubiquitin 85 4.1 Introduction . . . 85
4.2 Effect of temperature on fast motions of aromatic rings . . . 88
4.3 Examining the cooperative nature of the aromatic ring motions . . . 98
4.4 Pressure induced fluctuations in aromatic dynamics . . . 102
4.5 Summary and Outlook . . . 106
5 Conformational entropy in very high-affinity interactions 110 5.1 Introduction . . . 110
5.2 Thermodynamics of protein-ligand systems: barnase-barstar; HBP(D24R)-histamine . . . 113
5.2.1 Very high affinity: barnase-barstar . . . 113
5.2.2 Very high affinity: histamine-binding protein:histamine . . . 115
5.2.3 Moderate affinity: barnase-dCGAC . . . 117
5.2.4 Weak binder: HBP(D24R)-serotonin . . . 119
5.2.5 Summary . . . 121
5.3 Results . . . 122
5.3.1 NMR chemical shift assignments . . . 122
5.3.2 Increase in conformational entropy upon barnase-barstar high affin-ity interaction . . . 123
5.3.3 Dynamics of the interface waters in barnase-barstar complex . . . 131
5.3.4 Conformational entropy can act as a driving force for binding in-teractions . . . 136
5.3.5 Conformational entropy offsets unfavourable entropic contribu-tions to binding . . . 141
5.3.6 Conformational entropy modulates binding affinity . . . 143
5.4 Conclusions and Discussion. . . 144
6 A Universal Entropy Meter 150 6.1 Introduction . . . 150
6.2 Results . . . 154
7 Conclusions 166
7.1 Summary . . . 166
7.2 Future Directions . . . 170
A Appendix Chapter 2 172
B Appendix Chapter 4 192
C Appendix Chapter 5 196
D Appendix Chapter 6 212
1.1 Amino acids and at least one type of interaction they participate in . . . . 5
2.1 Proteins used in MD simulations . . . 38
2.2 Characteristics of the protein set used for MD simulations . . . 38
2.3 Comparison of MD simulations and ExperimentalO2axis statistics. . . 42
2.4 Correlation of normalized entropy (Sb) to MDO2axis . . . 48
3.1 Lipari-Szabo Model-Free Parameters for Aromatic Ring Motion in Calcium-Saturated Calmodulin grown in[4−13C]-erythrose . . . 79
3.2 Lipari-Szabo Model-Free Parameters for Aromatic Ring Motion in Calcium-Saturated Calmodulin grown in[1−13C]-glucose . . . 81
4.1 Temperature dependence of the macromolecular tumbling time of ubiquitin 90 5.1 Thermodynamics of binding of the different protein-ligand complexes . . . 121
A.1 Methyl order parameters and Side chain entropies of ubiquitin from MD simulations . . . 172
A.2 Methyl order parameters and Side chain entropies of alpha3D from MD simulations . . . 174
A.3 Methyl order parameters and Side chain entropies of CaM-smMLCK from MD simulations . . . 175
A.4 Methyl order parameters and Side chain entropies of CaM-nNOS from MD simulations . . . 179
A.5 Methyl order parameters and Side chain entropies of Adipocytle lipid binding protein (ADBP) from MD simulations . . . 183
A.6 Methyl order parameters and Side chain entropies of Hen egg white lysozyme (HEWL) from MD simulations . . . 186
A.7 Methyl order parameters and Side chain entropies of Cytochrome c2 (Cyt c2) from MD simulations . . . 189
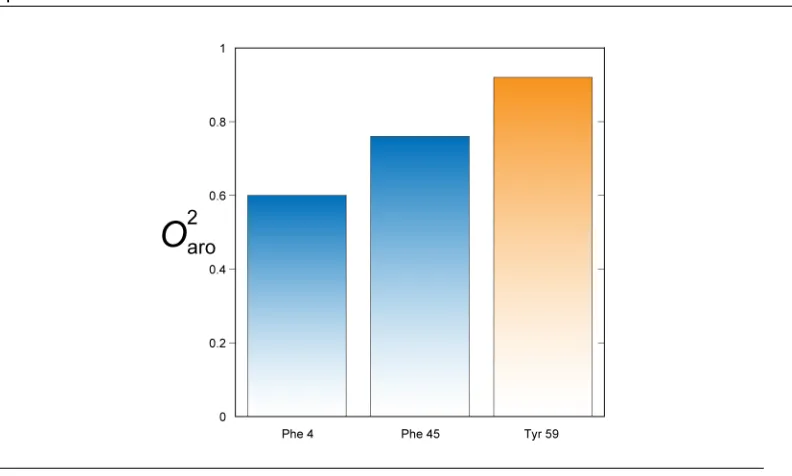
B.3 Pressure dependence of ubiquitin F45 aromatic order parameter. . . 193
B.4 Pressure dependence of ubiquitin Y59 aromatic order parameter. . . 193
B.5 Pressure dependence of ubiquitin F4 aromatic order parameter.. . . 193
B.6 Pressure dependence of ubiquitin F45 aromatic internal correlation times. 194
B.7 Pressure dependence of ubiquitin Y59 aromatic internal correlation times.194
B.8 Pressure dependence of ubiquitin F4 aromatic internal correlation times. . 194
B.9 Temperature dependence of ubiquitin aromatic order parameter from 120ns MD simulations . . . 194
B.10 Pressure dependence of ubiquitin F45 aromatic order parameter from MD simulations. . . 195
B.11 Pressure dependence of ubiquitin Y59 aromatic order parameter from MD simulations. . . 195
B.12 Pressure dependence of ubiquitin F4 aromatic order parameter from MD simulations. . . 195
C.1 Backbone order parameters of free barnase and barnase in complex with barstar . . . 196
C.2 Backbone order parameters of free barstar and barstar in complex with barnase . . . 198
C.3 Methyl side chain order parameters of free barnase and barnase in com-plex with barstar . . . 200
C.4 Methyl side chain order parameters of free barstar and barstar in complex with barnase . . . 202
C.5 Backbone order parameters of free barnase and barnase in complex with 4mer dCGAC . . . 203
C.6 Methyl side chain order parameters of free barnase and barnase in com-plex with 4mer dCGAC . . . 205
C.7 Aromatic side chain order parameters of free barnase and barnase in complex with barstar . . . 207
C.8 Aromatic side chain order parameters of free barstar and barstar in com-plex with barnase . . . 207
C.9 Aromatic side chain order parameters of free barnase and barnase in complex with dCGAC. . . 208
C.10 Barnase hydration measurement (NOE/ROE) in the free state and com-plex states. . . 208
C.11 Barstar hydration measurement (NOE/ROE) complex state bound to bar-nase . . . 210
1.1 ITC of a protein binding to a ligand . . . 3
1.2 External magnetic field induced splitting of spin states . . . 8
1.3 Relaxation of nuclei in external magnetic field . . . 11
1.4 Time scales of motion . . . 13
1.5 Time Correlation of bond vector fluctuations . . . 14
1.6 Backbone order parameter distribution in ubiquitin . . . 17
1.7 side chain methyl group order parameter distribution in ubiquitin . . . 20
1.8 Order parameter distribution of aromatic ring side chain in calmodulin . . 21
1.9 Model dependent correlation of−T∆Scon f vs−T∆Stotal . . . 25
1.10 Model independent correlation of−T∆Scon fN MRvs−T∆SIT Ccon f . . . 27
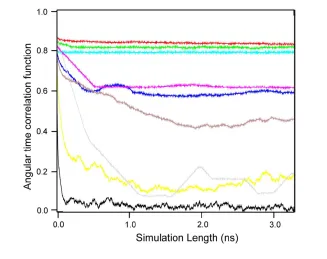
2.1 Convergence of angular time correlation functions . . . 41
2.2 Comparison of averageO2axis: MD vs Experiment . . . 43
2.3 Comparison of site-to-siteO2axis: MD vs Experiment . . . 44
2.4 Correlation of MDO2axisand rotamer entropy . . . 46
2.5 Correlation of site-to-site MDO2axis and rotamer entropy . . . 47
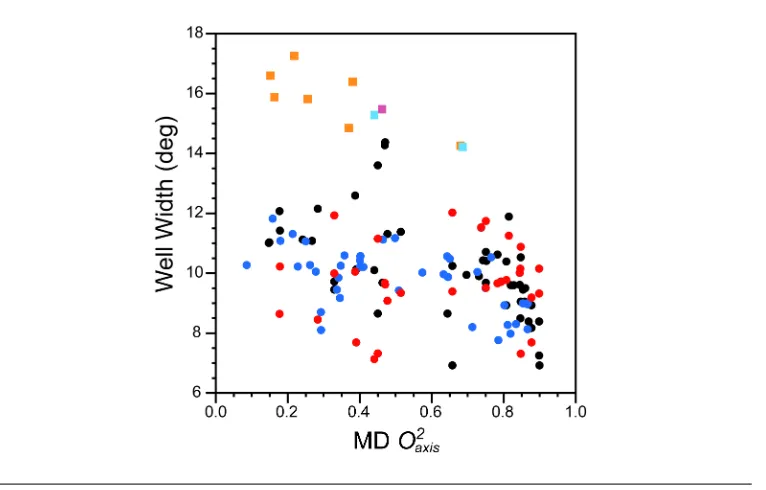
2.6 A representative rotamer landscape for methyl side-chains. . . 49
2.7 Rotamer entropy contributions from within well fluctuations . . . 50
2.8 Methyl groups as reporters of total conformational entropy . . . 54
2.9 Empirical calibration of CAP binding to DNA . . . 56
2.10 New universal "Entropy Meter" calibration . . . 58
3.1 Carbon labelling of aromatic amino acid . . . 69
3.2 Selective isotope enrichment of aromatic residues . . . 72
3.3 13C labelling efficiency of erythrose . . . 73
3.4 13C incorporation dictates labelling efficiency . . . 75
3.5 13C HSQC Flavodoxin C55A. . . 76
3.6 (4−13C)-erythrose versus(1−13C)-glucose: R1,R1ρ relaxation . . . 77
3.7 Comparison of13C HSQC: Erythrose vs Glucose . . . 80
4.3 van’t Hoff analysis of the fast motions of aromatic side chains in ubiquitin 93
4.4 Experimental temperature dependence of ps-ns aromatic ring correlation
times in ubiquitin . . . 94
4.5 Temperature dependence of MD derived ps-ns aromatic ring motion in ubiquitin . . . 95
4.6 Aromatic ring flip motions above 300 K in ubiquitin . . . 97
4.7 Time correlation functions of aromatic rings from MD simulations . . . 99
4.8 Packing efficiency of ubiquitin as a function of temperature . . . 100
4.9 Contributions of the side chains to the pressure virial . . . 101
4.10 Pressure sensitivity of fast motions of aromatic rings in ubiquitin. . . 103
4.11 Pressure sensitivity of fast motions of aromatic rings in ubiquitin from MD simulations . . . 104
4.12 Non-linear pressure response of methyl motions in ubiquitin . . . 106
4.13 Experimental temperature dependence of ps-ns aromatic ring motion in Ca2+−Calmodulin−smMLCK . . . 108
5.1 Minimal structural perturbation upon barnase-barstar complex formation . 114 5.2 Interface of barnase-barstar consist of several water molecules . . . 115
5.3 Structural perturbations and thermodynamics of HBP(D24R) binding to histamine . . . 117
5.4 Water mediated interactions of histamine binding to HBP(D24R) . . . 118
5.5 Structural pertubations and thermodynamics of barnase-dCGAC complex 119 5.6 Dissociation constant of barnase-dCGAC . . . 120
5.7 Binding of serotonin to HBP(D24R) in the presence and absence of his-tamine . . . 121
5.8 15N amide chemical shift assignments of free barnase and free barstar . . 124
5.9 13C-methyl chemical shift assignments of free barnase and free barstar . 125 5.1015N and13C-methyl chemical shift assignment of barnase-barstar complex126 5.1113C-aromatic chemical shift assignments of free barnase and free barstar 127 5.12 Changes in motion of the polypeptide backbone of barnase and barstar upon formation of the complex . . . 128
5.13 Correlation of2Hvs13C O2axis of free barnase and complexed barnase . . 129
5.14 Distribution of the changes inO2axis in barnase-barstar complex . . . 130
5.15 Distribution of the changes in motion of aromatic side chains in barnase-barstar complex. . . 131
5.16 Water-protein interaction at the interface of barnase-barstar complex . . . 132
5.19 Motional changes in the polypeptide backbone of barnase upon dCGAC binding . . . 137
5.20 Motional changes in the methyl-bearing amino acid side chains of bar-nase upon dCGAC binding . . . 138
5.21 Motional changes in the aromatic amino acid side chains of barnase upon dCGAC binding. . . 139
5.22 Reverse micelle encapsulation mediated hydration measurement of barnase-dCGAC complex . . . 140
5.23 Motional changes of the backbone amide and methyl side chains in HBP(D24R) upon histamine binding . . . 142
5.24 Motional changes of the methyl side chains in HBP(D24R)/HBP(D24R)-histamine upon serotonin binding . . . 144
5.25 Interplay between the different thermodynamic components of the bind-ing interactions . . . 148
6.1 Binding energetics of the different protein-ligand complexes . . . 154
6.2 Calibration of the dynamical proxy for protein conformational entropy . . . 158
6.3 A Universal Entropy Meter for quantitative estimates of protein conforma-tional entropy . . . 161
Introduction
1.1
Thermodynamics
Thermodynamics is a part of science which defines the rules that govern any process
which involves energy and work. This seemingly simple science lays the foundation
from which energetics of chemical reactions can be understood. Not surprisingly, all
biological processes are subject to thermodynamics. Almost all biochemical processes
(chemical processes associated with cellular function) are effected through proteins,
three-dimensional molecules made up of amino acids. Proteins are involved in
replica-tion [2], signalling [2,3], enzymatic reactions [2] and many many other vital processes. Understanding how proteins carry out this spectrum of functions is one of the central
questions in biology.
All biochemical processes are accomplished by interaction among different elements
function is to gain insight into the mechanism governing interaction of different
ele-ments in the biochemical process, i.e., protein-protein interactions, protein-DNA/RNA
interaction, protein-small molecule interaction, together labelled as protein-ligand
inter-actions. The factors influencing these interactions can be understood by studying the
thermodynamics involved. The propensity for any reaction depicted as
[Protein]+[Ligand][Protein−Ligand] (1.1)
to be thermodynamically favourable or unfavourable can be understood using:
∆G= ∆H−T∆S (1.2)
Equation 1.2is one of the most important equations and will be referred to time and again throughout this thesis. What does Equation 1.2 represent? It defines the en-ergy involved when a ligand binds a protein to form a protein-ligand complex as
indi-cated in1.1[4]. In detail,∆G, represents the change inGibbs-Helmholtz Free Energy
associated with the reaction1.1 while∆H represents net Enthalpy change which pro-vides insight into the structural aspects involved in the interaction of protein and
lig-and lig-and finally −T∆S represents the energy associated with the netEntropy change
for the reaction. Understanding the fundamental aspects of proteins, namely their
three-dimensional structure and dynamics, which contribute to enthalpy and entropy
Calorimetric measurements have aided in the measurement of changes in enthalpy
and free energy and indirectly changes in entropy for reactions such as those in1.1[5]. Figure1.1shows an example isothermal calorimetry (ITC) measurement for a reaction similar to1.1.
Figure 1.1: ITC Measurement of a protein binding to a ligand (S Leavitt, E Freire,
unpublished data)
The basis of ITC measurements rely on the fact that titrating ligand to a protein or
vice-versa, gives rise to the characteristic heat of dilution. The amount of power required
reference cell is then calculated based on the amount of heat of dilution. The area
under each peak is the heat associated with the binding process. The free energy
change of the reaction1.1is then calculated using the affinity constant (Ka) associated with the binding of protein to ligand or vice-versa. This affinity constant is derived from
a straightforward analysis of1.1.
∆G=−RT ln(Ka) (1.3)
Over the last few decades, an intense focus on the 3-dimensional structure of proteins
has resulted in a thorough understanding of the origins of enthalpy associated with
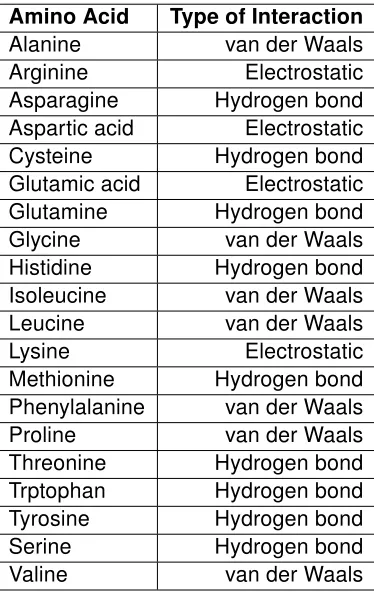
reactions such as1.1[6,7]. A survey of several protein-ligand interactions reveal that,
van der Waals,electrostatic, and hydrogen bond interactions are the primary sources
of the associated enthalpy for 1.1 [6, 8]. These vary between different proteins as they depend on the amino acid composition in the protein/ligand binding site. The
non-uniform contribution of the different amino acids to each of these different types of
interaction has however hindered the computation of the energetics governing
protein-ligand interactions [9] .
Amino Acid Type of Interaction
Alanine van der Waals
Arginine Electrostatic
Asparagine Hydrogen bond
Aspartic acid Electrostatic
Cysteine Hydrogen bond
Glutamic acid Electrostatic
Glutamine Hydrogen bond
Glycine van der Waals
Histidine Hydrogen bond
Isoleucine van der Waals
Leucine van der Waals
Lysine Electrostatic
Methionine Hydrogen bond
Phenylalanine van der Waals
Proline van der Waals
Threonine Hydrogen bond
Trptophan Hydrogen bond
Tyrosine Hydrogen bond
Serine Hydrogen bond
Valine van der Waals
Table 1.1: Amino acids and at least one type of interaction they participate in
1.1.1 Entropy change upon ligand binding
The total entropy change association with reaction1.1consists of several different con-tributions, namely:
• Solvent Entropy (∆Ssolvent)
• Conformational Entropy (∆Scon f)
−T∆S =−T[∆Ssolvent+ ∆Scon f + ∆SRT] (1.4)
∆G= ∆H−T[∆Ssolvent+ ∆Scon f + ∆SRT] (1.5)
Solvent entropy contributions have been estimated using the three-dimensional
struc-tures of protein in the free and ligand bound state [10]. These calculations have become more reliable wherein data from several proteins are used to parametrize the
relation-ship between buried surface area and solvent entropy [10]. Very briefly, upon complex formation, buried waters are released giving rise to a gain in solvent entropy. This forms
the basis for relating the change in buried surface area to the solvent entropy change
upon complex formation.
Why is it important to understand the role played by conformational entropy (∆Scon f)?
The typical change in conformational entropy associated with the unfolding of proteins
from folded to unfolded state is of the same order of magnitude or even one order of
magnitude less than that of the residual conformational entropy of the folded protein
[11]. In other words, there is substantial residual conformational entropy in the folded state of proteins [11]. This suggests that conformational entropy of proteins could in theory contribute substantially to the free energy of reaction1.1. Yet, protein conforma-tional entropy contributions to 1.1have been largely ignoredor assumed to be zero. Protein conformational entropy has only recently been investigated in detail due to the
estimates of conformational entropy exclusively came from computer based
calcula-tions aided by molecular dynamics (MD) simulacalcula-tions [11]. These however depend on the accuracy of MD simulations and were not sufficient to provide accurate quantitative
measurement of conformational entropy changes. The experimental measurement of
protein conformational entropy has proven challenging.
Nuclear Magnetic Resonance (NMR)has proved to be crucial in addressing this
prob-lem.
1.2
Nuclear Magnetic Resonance (NMR)
1.2.1 Introduction to NMR [1]
The nucleus of atoms, i.e. neutrons and protons, possess an intrinsic property, spin.
Every nucleus is associated with a characteristic spin value, (eg) 12 (1H, 13C, 15N), 1
(2H),. . ., which in turn is related to the magnetic moment (µ) of that particular nucleus
through its respective spin quantum number (S) and gyromagnetic ratio (γ) according
to1.6.
µ=γS (1.6)
A spin 12 nuclei, say1Hor13C, has its spin in two possible states:
• spin-down state (−12)
These two states are degenerate when the nuclei is isolated, i.e. the two states are of
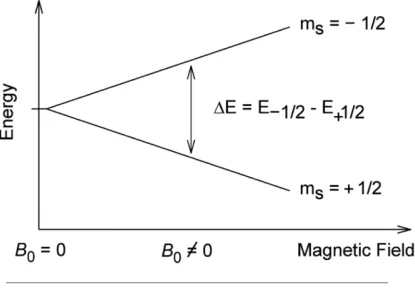
equal energy. However, when this spin 1
2 nuclei is placed in an external magnetic field,
the interaction of these two spin states with the external magnetic field results in the
two states being of different energy. This difference in energy (E) can be related to the
Figure 1.2: External magnetic field induced splitting of spin states
magnetic moment of the nuclei and the field strength of the external magnetic field (BO)
using1.7.
Interestingly, due to this energy difference between the spin states, the precession of
the nuclear magnetic moment relative to the external magnetic field will be different for
the two states. One of the spin states will be aligned with the external magnetic field and
the other aligned against. A precessing nuclear spin is then said to be in "resonance"
when the energy difference between the spin states is the same as the energy applied
through the external electromagnetic radiation. In other words, if the frequency of the
applied electromagnetic radiation matches with the difference in energy of the two spin
states then the nuclei absorbs energy and precesses in an external magnetic field and
we observe resonance.
∆E=~ωo = µ.BO
ωo =
γBO
2π (1.8)
The precession frequency (ωo) is called Larmor precession rate. Does the larmor
fre-quency as defined above suggest that for all spin 12 nuclei (with sameγ) in an external
magnetic field it takes the same value?No. In a protein, different nuclei are surrounded
by various other nuclei and that each nuclei is surrounded by its own shell of electrons.
This gives rise to the effect of shielding. This shielding of the nuclei from external
magnetic field by the surrounding electrons reduces or increases the magnetic field
experienced by the nucleus. Also, due to the complex nature of protein structure and
that the chemical environment is so heterogeneous throughout the protein, the larmor
in NMR larmor frequency due to the nature of chemical environment is termedchemical
shift.
The ability of NMR to probe the chemical shift of all spin active probes in a
macro-molecule, (eg) protein, makes it a very powerful technique. In summary, every single
NMR spin active nuclei in a protein experiences distinct chemical environments (baring
some superimposed symmetry considerations) which in turn can be probed by NMR.
Thus, NMR provides the tools for identifying individual atomic nuclei and the
perturba-tions they undergo due to some external influence, (for example) binding of a ligand.
Upon studying such perturbations, we gain valuable insight into the fundamentals of
the binding process.
1.2.2 Probing molecular motions using NMR
It has been well established that proteins are not just static three-dimensional static
structures. Proteins indeed undergo significant rotational, translational, and librational
motions at the individual atomic level [11]. NMR provides a very concise way to probe some of these motions. At equilibrium, the spins in proteins are all aligned to the
exter-nal magnetic field by some degree characteristic to the particular nuclei type. However,
when these spins are perturbed to produce a non-equilibrium distribution of spin states,
these spinsrelax back to their equilibrium distribution. This phenomenon of how fast
is a powerful tool to study the molecular motions of atoms/bond vectors within proteins
[17]. Each spin returns to its equilibrium distribution at a different rate which is influ-enced by the chemical environment surrounding it. There are two types of relaxation
processes that can occur:
• Longitudinal/Spin-lattice relaxation (T1)
• Transverse/Spin-spin relaxation (T2)
The external magnetic field in NMR is typically applied along the z-axis. Longitudinal
relaxation deals with the relaxation of the z component of the spins returning back to
their equilibrium population while transverse relaxation deals with the transverse (xy)
component of the spins. As mentioned earlier, the relaxation times for different nuclei
Figure 1.3: Relaxation of nuclei in external magnetic field
are strongly dependent on the surrounding environment, i.e., the nearby nuclei. The
relaxation times contain vital information regarding the motion of the bond vector
protein. Extracting this information paves the way for probing the molecular motions
of proteins. The theory behind extracting this information has been well documented
and hence will not be discussed here [17]. However, a brief account of the two main applications of relaxation,Backbone (main chain) relaxationandside chain relaxation,
and their corresponding theory will be presented. These two methods have been
ex-tensively used throughout this thesis. The following sections will outline in brief the idea
and theory behind these methods as well as their connection to molecular motion of
proteins.
1.2.3 Backbone Relaxation and side chain Relaxation
Proteins, which are polymers composed of many different amino acids, can be broadly
classified to be made of two main elements:
• Backbone or Main chain
• Side chain (methyl, aromatic, and others)
Due to the complicated nature of these relaxation methods, probing the motions of all
these elements simultaneously is a major challenge in NMR. Hence, motions pertaining
to these elements are probed individually.
Probing the relaxation of protein backbone, i.e. the amide bond, provides information on
spectrum of molecular motions in proteins span a variety of time scales (1.4) and NMR has proven useful to probe each of these time scales. The different type of motions
probed by NMR include:
• Librational motions (very fast motions, < nanoseconds)
• Molecular tumbling (nanoseconds)
• Structural transitions, ligand binding (microseconds-milliseconds)
• Molecular diffusion (milliseconds-seconds)
• Hydrogen exchange (seconds-minutes)
Figure 1.4: Time scales of motion
Backbone and side chain relaxation methods described here are primarily focussed on
the fast time scale librational motions (less than nano seconds), these include amide
bond fluctuations and side chain rotations, respectively. The measured backbone and
side chain relaxation times are related to their respective degree of motions through the
on values in the range of[0,1]where 0 represents complete flexibility and 1 represents
a rigid bond vector in the molecular frame. In other words, the order parameter is the
limiting value of the autocorrelation function of a bond vector’s position with time. The
area under figure1.5(τe) represents the time scale of fluctuations for the correspond-ing bond vector (referenced as internal correlation time). The order parameter values
Figure 1.5: Time Correlation of bond vector fluctuations
extracted from backbone relaxation provide information on the molecular motions of the
amide bond vector about its axis whereas the order parameter values extracted from
other side chain relaxation experiments provide information on the molecular motions
of the side chains about their respective axis. The order parameter value for any
par-ticular amide 15N nuclei depends on its interaction with the surrounding nuclei. These
interactions can be broadly classified into two categories:
• Chemical Shift Anisotropy (The effect of the anisotropic electronic environment
around nuclei)
For example, consider an amide15Nnuclei, the dominant interactions affecting its
relax-ation are the dipolar interaction with the attached amide proton (hydrogen) and its (15N)
chemical shift anisotropy (CSA). The dipolar interaction from surrounding nuclei, (eg)
1H, and others . . . do indeed affect the relaxation properties. However, since dipolar
interactions depend on the inverse 6th power of the distance between the nuclei (r−6),
contributions from these surrounding nuclei are limited. Similar to dipolar interactions,
chemical shift anisotropy is also dependent on the environment surrounding the nuclei
of interest, in this case the amide15N. Depending on whether the nature of anisotropy
is isotropic, axial or completely anisotropic, the effect on relaxation is different.
Hence, considering the appropriate effect of both dipolar interactions and chemical shift
anisotropy influences the calculation of dynamic parameters, namely the order
param-eter (O2), and internal correlation time (τe), from relaxation measurements [1,18,19].
I have developed a computer program (pyRelxn2A) which can incorporate all of these
complex interactions and aid in extracting the dynamics information (i.e. O2 and τe)
from NMR-relaxation data. The analysis of all the relaxation data in this thesis were
1.2.3.1 Backbone Relaxation
Backbone relaxation measurements which comprise longitudinal relaxation (T1) ,
trans-verse relaxation (T2), and heteronuclear nuclear overhausser effect (NOE), together
(Equation1.9) provide a complete description of the different motions occurring in the main chain chain of proteins [20]. The relaxation of15N nuclei of the amide backbone
is measured using15N relaxation of the15N amide nuclei in proteins.
1
T1 =
1 4d
2{J(ω
H−ωN)+3J(ωN)+6J(ωH+ωN)}+c2J(ωN)
1
T2 =
1 8d
2{J(ω
H−ωN)+3J(ωN)+6J(ωH+ωN)+4J(0)+6J(ωH)}
+ c2
6[4J(0)+3J(ωN)]+Rex
NOE = 1+ T1d
2
4 .
γH
γN
{6J(ωH+ωN)−J(ωH−ωN)} (1.9)
The spectral density function (J) in equation 1.9corresponds to the probability of mo-tions occurring at a given larmor precession frequency ω and is defined for isotropic
motion as:
J(ω)= 2 5
O2τm 1+(ωτm)2
+ (1−O2)τf 1+(ωτf)2
(1.10)
frequencies of amide nitrogen (15N,ωN), amide proton (1HN,ωH), spectral density
func-tion (J), molecular tumbling time (τm), τf (= τ1
m +
1
τe) , internal correlation time or time
scale of bond vector fluctuations (τe), and the order parameter (O2).
The analysis of backbone relaxation prior to side chain relaxation is critical since an
ac-curate estimate of molecular tumbling can be calculated through backbone relaxation.
This is due to the fact that the main chain of most proteins, if not all, is predominantly
rigid with flexible motions restricted to the unstructured regions of the proteins, namely
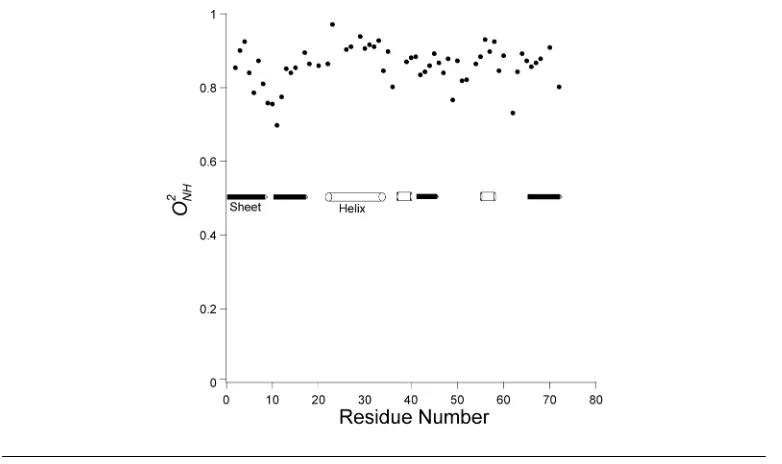
loops, amino and carboxy termini. Depicted in figure 1.6are the amide backbone or-der parameters (O2NH) for ubiquitin and it is evident that the structured regions, helix
and beta-sheet, are predominantly rigid whereas the loops regions exhibit
conforma-tional flexibility. The calculation of molecular tumbling from the 15N relaxation times
Figure 1.6: Backbone order parameter distribution in ubiquitin
Equation 1.9and 1.10 and extractτm. The molecular tumbling can be isotropic, axi-ally symmetric or completely anisotropic depending on the size and shape of the
pro-tein [21]. Therefore depending on the tumbling model used, the spectral density
func-tion changes andpyRelxn 2Acan accordingly be used to appropriately accommodate
for the modified functions to calculate the molecular tumbling time(s). The functional
importance of understanding the molecular motions highlights changes in motions of
backbone directly linked to the function of protein such as catalytic activity or structural
transition resulting in motional changes [22, 23]. The calculated molecular tumbling model and time will need to be carried forward to analyse the relaxation of side chains
in order to extract information pertaining to their molecular motions, i.e. side chain order
parameter and their time scales of motion. In the next section, side chain relaxation of
methyl-bearing amino acid side chain is described as these are the most well
charac-terized and are also used extensively in this thesis. The theory described however, is
applicable to other side chains namely aromatic rings with minor modifications.
Back-bone relaxation, methyl side chain relaxation, and aromatic side chain relaxation are
the three relaxation methods used in this thesis.
1.2.3.2 Side chain Relaxation
Side chain relaxation methods probe the molecular motions of side chain nuclei of
amino acids in proteins. The two main side chains that will be considered in this thesis
• Methyl side chain (Order Parameter: O2axis)
• Aromatic side chain (Order Parameter:O2aro)
Unlike the amide backbone of proteins, side chains have been observed to undergo a
heterogeneous distribution of motion in the fast time scale (∼10−12) by both molecular
dynamics and NMR [17, 24]. How does NMR probe these motions? These fast time
scale motions are probed similarly to that of the amide backbone, i.e., using relaxation
methods (T1andT1ρ). However, unlike the amide backbone where the relaxation of15N
nuclei is measured, for side chains13Cor2Hrelaxation is measured.
The relaxation of backbone amides involves an AX spin system, i.e., (A-X:15N−1H
N;
A≡15N and X≡1H) where as side chain relaxation can be AX (in the case of aromatic
ring:13C−1H;A≡13CandX≡1H) orAX
3(in the case of methyl groups:13C1H3). The
re-laxation properties of anAX3 spin system is more complicated than an AX spin system
hence theAX3spin system is usually reduced to anAXY2 spin system where Y is
deu-terium2Hnuclei which does not affect dipolar interactions of13Cspins significantly. It is
important to note here that methyl side chain relaxation can also be measured through
deuterium relaxation, i.e., relaxation of2H nuclei in anAY X2. However, deuterium
re-laxation is not detailed here since13Crelaxation is used exclusively in this thesis. For a
detailed review of these different methods refer to Igumenova et al [17].
The calculation of dynamics parameters (O2andτe) from the measured relaxation times
(T1 and T1ρ) are similar to backbone amide relaxation wherein they involve Equation
(ωC). However, the main difference here being that the molecular tumbling time (τm)
calculated from the amide backbone relaxation for the same protein at identical
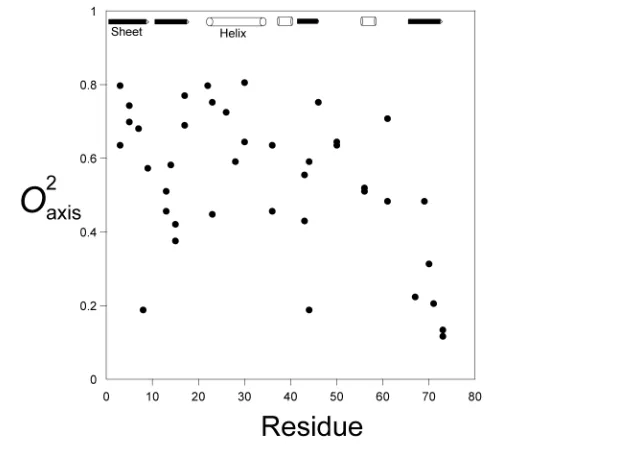
con-centration is used. The side chain methyl order parameters calculated from Equation
Figure 1.7: Methyl group order parameter distribution in ubiquitin
1.9 represent the motion of 13C−1 H bond in the methyl group which can be related to the motions of the symmetry axis of the methyl group, i.e., 13C
β −13Ci, where 13Ci
corresponds to the carbon in the AXY2 spin system. This transformation is of
practi-cal significance as the order parameter (O2axis) corresponds to the motion of the entire
methyl group rather than the motions of an individual 13C−1 H bond. However, in the
case of the aromatic side chain relaxation, the calculated order parameter represents
the13C−1Hbond motion or in other words the motions of the ring about its symmetry
Figure 1.8: Order parameter distribution of aromatic ring side chain in calmodulin
seen in Figure1.7is heterogeneous [17,25]. Aromatic side chains on the other hand have only recently been shown to possess such a heterogeneous range of dynamics
and as such were previously thought to be quite rigid, similar to the backbone amides
[26] (refer to Chapter3).
The order parameters or dynamics of side chains combined with those of backbone
aid in understanding how ligand binding affects protein function. The changes induced
in the internal motions of proteins due to ligand binding contribute to the changes in
conformational entropy. NMR-relaxation measurements of internal motions of protein
side chains, namely methyl bearing amino acid side chains, have been used to provide
quantitative estimates of changes in protein conformational entropy [13, 14]. Recent studies have shown that ligand binding modulates the conformational entropy of
1.3
Conformational Entropy from Protein Dynamics: The
His-tory
One of the simplest definitions of entropy comes from the Boltzmann’s principle which
defines entropy as the measure of the number of possible states in a system at
ther-modynamic equilibrium. However, the Gibbs formulation (Equation1.11) which is not too dissimilar to the Boltzmann formulation (Equation1.12) defines the entropy in two levels, a macroscopic state and microscopic states. The macroscopic state of the
sys-tem is defined by the number of different micro states visited by the syssys-tem. In other
words entropy is defined within the context of a distribution of micro states accessible
for any particular macro state. The advantage of the Gibbs definition is that it is valid
even for systems far away from equilibrium. Equation1.11and1.12define the entropy according to Boltzmann and Gibbs formulation, respectively.
S = −kBlnΩ (1.11)
S = −kB n
X
i=1
pilnpi (1.12)
Ωrepresents the number of states accessible to the system whereas pi represents the
probability of theithstate being visited when the system fluctuates.
Order parameters measured from NMR inherently contain information regarding the
number of states visited, i.e., residues which are dynamic, visit more states and display
reduced to extracting the number of states visited. The following set of equations relate
the order parameter to entropy:
O2 =
"
dΩ1dΩ2peq(Ω1)peq(Ω2)P2(cos(θ12))
peq ≡
exp(−UkT(Ω))
Z
A ≡ −kT lnZ
H ≡ kT2∂lnZ
∂T
S = klnZ+kT∂lnZ
∂T (1.13)
As evident from Equation 1.13, the calculation of the partition function (Z) from order parameter is required for the eventual transformation to entropy. The partition function
(Z) is however dependent on the free energy (A) of the system and hence the potential
U(Ω). To this end, much research effort has been directed at examining the effect of
different energy potentials [15,16]. One of the simplest potentials examined is that of the harmonic oscillator where the potential take the form:
U= 1
2kθ
2 (1.14)
A detailed analysis of the the nature and characteristics of the different potential will not
be presented here but it suffices to say that the different potentials reveal interesting
have shortcomings which are a result of the inherent assumptions associated with the
form of the potential (U(Ω)). For example, the harmonic oscillator model among many
things does not account for correlated motions of side chains. In the densely packed
environment of proteins, motions of side chains are highly correlated [17].
1.3.1 Model Dependent Approach: Harmonic Oscillator
With the above physical basis for the relationship between order parameter and entropy,
Wand&co-workers have examined the effect of protein conformational entropy (if any)
on the binding of ligands, small peptides, to the protein, Calmodulin [13]. Armed with measurements of methyl side chain dynamics of Calmodulin bound to several different
peptide ligands, the protein conformational entropy was calculated (Equation1.15).
Scon f =
X
piShi −kB
X
pilnpi (1.15)
The entropy here (Equation1.15) was modelled by a multidimensional harmonic well. The first term (Shi) represents the entropy due to the fast intra-well motion or
fluctua-tions about a particular conformation. The second term represents the classical
Boltz-mann entropy, corresponding to the number of different conformations. The potential
the potential energy function, but this shortcoming was addressed when evaluating the
changes in conformational entropy (∆Scon f) since the changes in order parameter (∆O2)
are insensitive to the model used.
There was an excellent correlation between the changes in protein conformational
en-tropy calculated using the above model and the changes in total binding enen-tropy for the
calmodulin:peptide complexes [13]. This was an unprecedented result as it stated that not only is conformational entropy important, its contribution could be of the same order
of magnitude as that of the total binding entropy.
Figure 1.9: Correlation of change in protein conformational entropy with change in total binding entropy for Calmodulin
1.3.2 Model Independent Approach: Empirical Calibration
One of the main drawbacks of the model dependent approach as mentioned earlier is
the inherent assumption of the form of potential used as well as the fact that the effect of
order to overcome this limitation, Wand&co-workers proposed an empirical calibration
of the conformational entropy through the measured methyl side chain order
parame-ters [14]. This is inherently a model dependent approach where in a linear relationship is assumed between the order parameter and the conformational entropy. The use of
a linear relationship is the simplest possible and results in the least number of
exter-nal variables needed to consider. The empirical relationship used could be written as
follows:
∆Scon f =m[(nprotein•<∆O2axis >
protein +
nligand•<∆O2axis >ligand)]+ ∆Sother (1.16)
where ’m’ corresponds to the empirical calibration slope and ’n’ corresponds to the
num-ber of amino acids in the molecule. The conformational entropy of proteins calculated
using Equation1.16correlated well to that calculated from the total binding entropy after accounting for the change in solvent entropy of the protein.
∆Stotal = ∆Ssolvent+ ∆S protein con f + ∆S
ligand
con f + ∆Sother (1.17)
This suggested that protein conformational entropy can indeed be calculated accurately
from the NMR measured side chain dynamics albeit with some constraints. These
constraints being that there are enough methyl probes to accurately represent the entire
protein, i.e. good coverage, and that the assumption of methyl group dynamics are
issues in this thesis (refer to Chapter2).
Figure 1.10: Correlation of change in protein conformational entropy measured by NMR versus that calculated from calorimetric measurements for Calmodulin
1.3.3 Questions that need to be addressed
The measurement of protein conformational entropy presents a significant step forward
in understanding the subtleties of protein thermodynamics. However, the overall
sig-nificance of conformational entropy with respect to the contribution and influence over
protein:ligand interactions remains unclear. Is there a global role played by
conforma-tional entropy which is applicable to all protein:ligand interactions irrespective of the
nature of the ligand? Furthermore, are methyl groups dynamics sufficient to measure
protein conformational entropy? What about protein:protein interfaces which are largely
chains are correlated to the rest of the protein? How does protein conformational
en-tropy changes contribute to protein-ligand complexes spanning low to high affinities?
These are just some of the many questions that still need to be answered. The most
important question which has so far not been addressed is whether protein
conforma-tional entropy changes can be included in the pharmaceutical drug design process?
In this thesis, I attempt to address these questions with the aid of several techniques,
including NMR-relaxation and MD simulations. First, the assumptions of the empirical
calibration model (Equation1.16) will be addressed through the use of MD simulations of several different proteins. Some interesting new results which have emerged out of
this MD simulation study will also be outlined in detail (refer to Chapter 2). Secondly, a new approach to supplement the measure of protein conformational entropy is
pre-sented (Chapter 3). This involves aromatic amino acid side chains. Aromatic amino acids are ubiquitous in protein:protein, protein:RNA and protein:small molecule
interac-tions. Moreover, they are highly populated in the interfaces of these interactions [28]. However, they remain largely unexplored due to the several complications associated
with their NMR-relaxation properties. I have developed a new isotope labelling method
which overcomes these issues. The application of this scheme to different systems
and the wealth of interesting information we have learnt will be outlined (Chapter3and
4). In Chapter 5, I have combined both methyl side chain dynamics and aromatic side chain dynamics to study the interaction of a very high affinity protein-protein interaction.
is examined in detail. One of the fundamental assumptions associated with very high
affinity interactions is scrutinized here with the methods developed. Finally, in order to
address the generality of the interpretation of the ’Entropy Meter’ formulation, I have
combined calorimetric and NMR dynamics information for 35 different protein-ligand
complexes to demonstrate that the ’Entropy Meter’ is indeed universal (Chapter7). The generalized entropy meter presented here is a significant step forward in utilizing
pro-tein conformational entropy changes as an additional dimension for rational design of
Insights into the microscopic
origins of protein conformational
entropy
2.1
Introduction
The forces that govern the stability of the native state of proteins are complex and
dif-ficult to unravel and dissect through experiment, simulation or theory [29,30]. This is particularly the case for the residual conformational entropy of proteins. Protein
con-formational entropy is a central component of the thermodynamics governing protein
contribution of residual protein conformational entropy to fundamental protein activities,
such as binding of ligands, which is vital for protein function. Recent progress has
il-luminated the possibility of employing NMR relaxation based methods to quantitatively
determine the role of changes in conformational entropy in molecular recognition by
pro-teins [24]. This approach rests on using the fast internal motion of proteins as a proxy for conformational entropy [17]. The initial approach which as introduced previously (Figure 1.9) was to effectively take an inventory of the change in motion at a limited number of sites and interpret this within the context of a simple physical model, such as
the harmonic oscillator [16] or diffusion within an infinite square well [15]. This raised several obvious issues, such as the effects of correlated motion, the operation of a more
complex potential energy function, the completeness of the oscillator count, and others
[17]. More recently this issue was sidestepped by using an empirical calibration of the dynamical proxy for conformational entropy. Rather than attempt a model-dependent
in-terpretation of an inventory of changes in local dynamics, an empirical scaling between
the experimental measure of local dynamics and local disorder (entropy) was attempted
(Figure1.10) [14]. The idea rests of the assumption that the experimentally accessible methyl-bearing side chains are numerous enough to provide sufficient coverage of
in-ternal motions and are sufficiently coupled to the neighbouring side chains to report on
the total entropy [24]. With an appropriate experimental system, this leads to a rather simple relationship between what can be measured (protein motion and total binding
entropy) [14]. Measuring the change in motion of methyl bearing side chains on the nanosecond time scale using classical NMR relaxation methods [33–37], it is possible to obtain a quantitative measure of the underlying change in conformational dynamics
[14]. This methodology was first applied on calcium-saturated calmodulin to a series of calmodulin-binding domains [14].The results demonstrated that changes in conforma-tional entropy were important to ligand binding and also confirmed that conformaconforma-tional
entropy contributed to the tuning of free energy of binding in this system [13,14]. Re-cently, a second example demonstrated by Tzeng&Kaladimos, where a collection of
mutants of catabolite activator protein (CAP) was used to study the thermodynamic
origins of high affinity binding od DNA to the cAMP-activated protein [27]. The advan-tage of the CAP system is that the same binding ligand (DNA) was used, the structure
does not change appreciably upon binding the DNA, and a array of structurally benign
mutations remote from the binding interface were available. This eliminated most of
the uncertainties associated with the analysis of the calmodulin complexes described
previously. The resulting empirical calibration of CAP was excellent and led to a
con-vincing analysis of the role of conformational entropy in binding of ligands to the CAP
protein and its potential role in allosteric regulation [27]. This was a remarkable result as it demonstrates that for two completely independent protein system binding to
dif-ferent ligands, the NMR measured conformational entropy is excellently correlated to
that from ITC and that the magnitude of protein conformational entropy is of the same
the protein conformational entropy is a significant contributor to the free energy of
lig-and binding lig-and may even play a vital role in tuning the affinity of proteins to different
ligands. However, a key difference between the CAP study and the calmodulin study
was that the degree of correlation between the NMR measured protein conformational
and from ITC was different by two fold. This raised several questions pertaining to the
validity of using methyl groups as reporters of global protein conformational entropy,
whether such a relation is indeed system specific and if so, what are the consequences
of same.
Here I attempt to understand the microscopic origins of the apparent success of the
empirical "entropy meter" based on a dynamical proxy measured through NMR
relax-ation methods. Extensive MD simulrelax-ations in explicit water are employed to examine the
ability of measure of fast internal motions of methyl groups in proteins to adequately
represent the conformational entropy fo proteins. In addition, MD simulations provide
an excellent platform to analyse the contributions of correlated motions of side chains
to the measure of protein conformational entropy. However, extending the results from
MD simulations to experimental measurements impose the condition that the calculated
variables are correlated well to the NMR relaxation measured observables, namely
side-chain motions derived from NMR relaxation [40]. With one exception [41], the cor-respondence between Lipari-Szabo (L-S) methyl group order parameter derived from
MD and experiment has been poor and definitely insufficient to promote further
stud-ies dependent on such correspondence. Therefore, prior to dissecting the origins of
the entropic contribution coming from methyl bearing side-chains, I have compared the
L-S order parameters obtained from the MD simulations performed here, to those
ob-tained via NMR deuterium or carbon relaxation based methods. The MD simulations
performed here have been using NAMD [42,43] with CHARMM27 force field [44,45]. I find that the agreement with experiment is excellent, a marked improvement over the
limited number of previous studies. This provides a solid platform from which results
from MD simulations can be extended to experiment and would potentially aid in
under-standing the origins of the "entropy meter" established using NMR relaxation methods.
In summary, the results of the analysis of the simulations reveal that the experimentally
accessible motions of methyl bearing side chains are coupled sufficiently to the motions
of other side chains and hence serve as excellent reporters of conformational entropy.
The total side chain conformational entropy can be accurately recapitulated using only
measures of side-chain methyl motions provided there is a good distribution of methyl
containing amino acids in the protein. Interesting, MD simulations reveal that the
con-formational entropy varies mostly through the changes in populations of the rotameric
This provides comprehensive evidence for the linear correlation between NMR
mea-sured conformational entropy versus the total binding entropy meamea-sured using ITC, for
both the model-dependent approach and model-independent approach even though
the model-dependent approach uses a potential, the conformational entropy
contri-bution is predominantly from the changes in population of rotameric well. Finally, a
statistical analysis reveals that the correlated motions are sufficiently limited to have
limited impact on the relationship between the NMR measure of methyl dynamics and
the derived entropy. These, in total, validate the use of conformational dynamics
de-rived experimentally from NMR relaxation as a proxy from which to obtain quantitative
estimates of changes in protein conformational entropy.
2.2
Results
MD simulations of several different proteins containing different structural motifs,
rang-ing in size from 73 to 168 residues were selected for study (Table 2.1). Some of the proteins studied here also contain bound metals (calmodulin) or a prosthetic group
(cy-tochrome c2). Two of the proteins are also high-affinity complexes of small peptides
with calmodulin. All have extensive experimental reference sets for dynamics derived
from site-resolved solution NMR relaxation studies. The methyl group L-S squared order
[46], adipocyte lipid binding protein (ADBP) [47], cytochrome c2 (Cyt c2) [48], calcium-saturated calmodulin (CaM) complexes with peptides corresponding to the
calmodulin-binding domain of the smooth muscle myosin light chain kinase (smMLCKp) and the
neuronal nitric oxide synthase (nNOSp) [13], hen egg white lysozyme (HEWL) [49], and ubiquitin [50]. The average dynamical properties of the proteins range from quite rigid (e.g. cytochrome c2 and lysozyme) to quite internally dynamics (e.g. α3D). The
molec-ular coordinates for the proteins used in the simulations were derived from structures
deposited in the Protein Data Bank (PDB): ubiquitin [51], α3D[52], calcium-saturated
calmodulin-smMLCK [53], calcium-saturated calmodulin-nNOS (unpublished), hen egg white lysozyme [54], adipocyte lipid binding protein [55], and cytochromec2[56] (Table
Protein Structure
Ubiquitin
α3D
CaM-smMLCK
CaM-nNOS
Set up variables for MD simulations: The MD simulations of the seven proteins listed above in Table2.2were carried out with NAMD2 [43] using CHARMM27 [44] all-atom parameter set and TIP3P [57] water potential. Hydrogen atoms were added to the PDB structure using VMD [58]. Individual proteins were centred in a TIP3P water box such that protein atoms were at least 8Å from the boundary except in the case of two small proteins, ubiquitin and α3D, where the solvent layer was at
least 5Å and 6Å, respectively. Simulations were performed using a time step of 2 femto-seconds. Bonds to hydrogen atoms were constrained using the SHAKE algorithm [59]. A switching distance of 10Å and cutoff of 12Åwere used for
Protein Structure
ADBP
HEWL
Cyt c2
Table 2.1: Proteins used in MD simulations
Proteins Residues PDB code Temperature (deg C) waters Length (ns)
Ubiquitin 76 1UBQ 20 4008 260
α3D 73 2A3D 30 2532 160
CaM-smmLCK 167 1CDL 35 5228 1280
CaM-nNOS 168 2O60 35 4957 1120
ADBP 131 1LIB 20 4008 112
HEWL 129 1LZA 35 4133 240
Cyt c2 116 1C2R 30 5116 120
Table 2.2: Characteristics of the protein set used for MD simulations
performed for each protein (Table2.2). Following equilibration runs of atleast 1 ns, several 60 ns simulations were performed starting from the final coordinates of the earlier run but with different initial velocities. For three protein systems, ubiquitin, calmodulin-smMLCKp and calmodulin-nNOSp complexes, longer simulations were also run on the Anton supercomputer using the same force field and simulation conditions except for a non-bond cut off of 14Å.
2.2.1 Simulation versus Experiment: O2
axis
As mentioned earlier, establishing the validity of the MD simulations is crucial for
in-terpreting the conclusions and results derived from the simulations in the context of
experimental data i.e. order parameters (O2axis) corresponding to the fast methyl
side-chain motions. The first step towards this is to calculate the order parameters from MD
simulations and compare it to those from NMR-relaxation data for each of the proteins.
Briefly, the time scale of motions in proteins spans a wide range of time scales. The
global macromolecular tumbling motions are in the nanosecond time scale, whereas
the time scale of fast internal motions of methyl groups or other side chains are
pre-dominantly in the pico-second time scale. Due to this superposition of multiple time
scale motions on every side-chain in proteins, the contributions from macromolecular
tumbling are separated from internal motions to get accurate estimates or rather true
measure of fast internal motions of side-chains. Hence, the interpretation of the
NMR-relaxation data using L-S [18] involves the simple assumption that internal motions and macromolecular tumbling motions can be separated. This is accomplished by