ARTICLE
Impact of Implementing Developmental Screening at
12 and 24 Months in a Pediatric Practice
Hollie Hix-Small, PhDa, Kevin Marks, MDb, Jane Squires, PhDa, Robert Nickel, MDc,d
aEarly Intervention Program, Special Education Department, College of Education, University of Oregon, Eugene, Oregon;bPediatrics Department, PeaceHealth Medical
Group, Eugene, Oregon;cDevelopmental Pediatrics Department, Child Development and Rehabilitation Center, Eugene, Oregon;dDevelopmental Pediatrics
Department, Oregon Health Sciences University, Portland, Oregon
Financial Disclosure: Drs Squires and Nickel are ASQ authors and receive publication royalties.
ABSTRACT
OBJECTIVES.The purpose of this study was to investigate the effectiveness and costs of incorporating a parent-completed developmental screening tool, the Ages and Stages Questionnaire, into the 12- and 24-month well-child visits under “real-world” conditions, using a combined in-office and mail-back data collection pro-tocol.
METHODS.A convenience sample of 1428 caregivers and children presenting for their 12- or 24-month well-child visit between April 2005 and March 2006 participated. Children with identified delays or disorders were excluded. Board-certified pedi-atricians (n⫽18) and nurse practitioners (n⫽2) acted as secondary participants. Pediatricians were blinded to Ages and Stages Questionnaire results when com-pleting the Pediatric Developmental Impression. Patients with delayed Ages and Stages Questionnaire or Pediatric Developmental Impression results were referred for additional evaluation.
RESULTS.Referral rates increased by 224%. Pediatrician referral on the basis of the Pediatric Developmental Impression was predicted significantly by suspected com-munication delay and gross motor delay. The Ages and Stages Questionnaire and Pediatric Developmental Impression results differed significantly, with overall agreement of 81.8%. Of Ages and Stages Questionnaire– delayed cases, 67.5% were not detected by pediatricians. Of the 78 patients referred on the basis of combined Ages and Stages Questionnaire and Pediatric Developmental Impression results, 53 would not have been referred on the basis of Pediatric Developmental Impression results alone; 37 patients qualified for special services, and 44 were scheduled for additional developmental monitoring. The rate of Ages and Stages Questionnaire return by caregivers/parents was 54%.
CONCLUSIONS.Referral rates increased dramatically, with the greatest increase at 12 months. Although patients with pediatrician referrals were likely to qualify for services (96%), physician referrals accounted for only 42% of total referrals, which highlights the need for pediatric developmental screening. The 54% Ages and Stages Questionnaire return rate, although acceptable under study conditions, calls for alternative implementation strategies.
www.pediatrics.org/cgi/doi/10.1542/ peds.2006-3583
doi:10.1542/peds.2006-3583
Drs Hix-Small and Marks are coauthors.
Key Words
Ages and Stages Questionnaire, developmental delay, developmental screening, developmental surveillance, early intervention, parent-completed screening
Abbreviations
ASQ—Ages and Stages Questionnaire EI— early intervention
PDI—Pediatric Developmental Impression IDEA—Individuals with Disabilities Education Act
Accepted for publication Mar 16, 2007 Address correspondence to Hollie Hix-Small, PhD, Early Intervention Program, 5253 University of Oregon, 901 E 18th St, Suite 100, Eugene, OR 97403–5253. E-mail: hhixsmal@ uoregon.edu
O
NE CHALLENGE INa busy office practice is how best to incorporate formal developmental screening, as recommended by the American Academy of Pediatrics.1,2 Early intervention (EI) has been shown to improve chil-dren’s developmental outcomes.3–6 Recent data on pre-mature infants with low birth weights (excluding infants with birth weights of⬍2000 g) provide the best evidence to date of the sustained positive effects of EI on long-term reading, mathematics, and behavioral outcomes.3Developmental and behavioral problems are esti-mated to be present in 12% to 16% of US children.7–10 However, rates of children with delays receiving EI ser-vices are reported to be⬃5% for 3- to 5-year-old chil-dren and 1.8% for chilchil-dren from birth through 2 years of age.10Although rates increase with age, significant num-bers of young children with disabilities are not identified until well into their school years.
Research suggests that pediatrician appraisal of a child’s developmental status is often inaccurate without the use of a standardized developmental screening tool. It has been reported that pediatricians fail to identify and to refer 60% to 80% of children with developmental delays in a timely manner.11,12 These figures are not surprising, because well-child checks typically are sched-uled for 15 to 30 minutes, an insufficient time for as-sessment of all domains of development in addition to administration of vaccines and discussion of other antic-ipatory guidance topics.
How can children with delays be identified systemat-ically in the context of a busy pediatric practice? A variety of technically sound, parent-report, develop-mental screening tools for the early identification of delays are now available.2,13One validated tool, the Ages and Stages Questionnaire (ASQ),14,15shows promise for pediatric practice.7Extensive research on the ASQ sup-ports its validity and reliability across the 4-month to 5-year age span.8
We hypothesized that parent completion of the ASQ in the pediatric office or at home in conjunction with the 12- or 24-month well-child visit would increase referral and EI service eligibility rates. We also sought to learn more about which cases pediatricians were likely to refer when blinded to ASQ results. A “real-world,” conve-nience-sample, study design was used, by keeping reg-ular office constraints in place to evaluate implementa-tion issues, including ASQ return rates, costs, training requirements, and medical personnel time allocation. The study was designed and performed before the July 2006 American Academy of Pediatrics recommendations on developmental surveillance and screening.1
METHODS
Participants
Participants were 1428 parents or legal guardians of children arriving for their 12- or 24-month well-child
visit between April 1, 2005, and March 1, 2006. Board-certified pediatricians (n⫽18) and nurse practitioners (n
⫽ 2) employed by a large, Pacific Northwest, medical group (PeaceHealth Medical Group) serving the children and their families acted as secondary participants. Chil-dren identified previously as having developmental de-lays/disorders were excluded. An accredited institutional review board approved the study procedures. Consent, including Health Insurance Portability and Accountabil-ity Act authorization, was obtained, and participants did not receive compensation. Study forms were avail-able in English and Spanish, the primary participant languages. Measures included the ASQ,8,14–16 a family information form (demographic data), a pediatrician-completed, developmental impression sheet (Pediatric Developmental Impression [PDI]) developed for this study, and follow-up screening and assessment results from the county EI part C service provider.
ASQ
The ASQ is a parent-completed, child-development, screening test with 19 questionnaire intervals, ranging from 4 to 60 months, that are identical in format and organized into five 6-item domains (communication, gross motor, fine motor, problem-solving, and personal-social), for a total of 30 items. ASQ questions are written at the fourth- to sixth-grade reading level and can be administered as an interview for parents with low liter-acy levels. Parents indicate “yes,” “sometimes,” or “not yet” in response to each item. The ASQ requires ⬃15 minutes to complete and 2 to 3 minutes to score. It has moderate to high sensitivity (0.70 – 0.90) and specificity (0.76 – 0.91) and excellent reliability (test-retest reliabil-ity: 0.95; inter-rater reliabilreliabil-ity: 0.95), with the 12- and 24-month intervals having the highest sensitivity and specificity in the first 24 months of life.8The tool seems to work well with families lacking a high school educa-tion, Hispanic families, and families of children with psychosocial risk factors.17Participating pediatricians re-viewed several developmental screening tools and se-lected the ASQ before study implementation.
A multidisciplinary panel of specialists in neurology, child neurology, communication disorders, pediatrics, psychology, and psychiatry endorsed the ASQ as a rec-ommended screening tool to assist in the early identifi-cation of autism and developmental disorders,18,19and it has been recommended for pediatric practice13and early childhood programs, including Head Start. The ASQ has been used for developmental monitoring in several large-scale, pediatric, research studies, including the Magpie Trials,20and follow-up monitoring of premature infants21and pediatric heart patients.22
Family Information Form
about their age, level of education, ethnicity, and home language, in addition to their child’s home language and ethnicity. Respondents could indicate that help was needed to complete the ASQ. A final question asked about Internet access. Insurance status was used as an income proxy.
PDI
At the end of the well-child visit, physicians documented their overall ratings of the child’s developmental status, indicating typical, questionable, or delayed. If “question-able” or “delayed” was indicated, then pediatricians specified developmental areas of concern from the fol-lowing options: communication, gross motor, fine mo-tor, problem-solving, and personal-social (the 5 areas assessed with the ASQ). Physicians also indicated whether they would make a referral to the Individuals with Disabilities Education Act (IDEA) part C agency for additional eligibility evaluation. Practitioners were blinded to ASQ results when they completed the PDI. The PDI was created for this study.
EI Assessment Outcomes
Results of additional screening/evaluation (eligible for services, not eligible, ongoing monitoring, and referral source) were obtained for children referred to the local IDEA part C EI agency.
Data Collection Procedures and Analyses
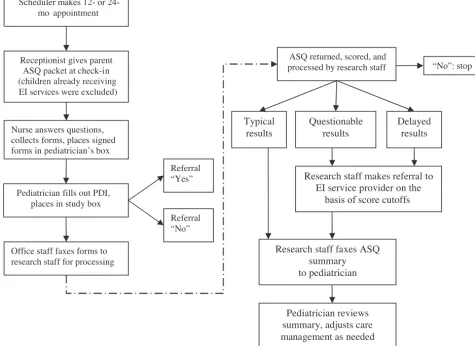
Thirty minutes of initial training on ASQ administration and data collection procedures were provided to pediat-ric support staff members. Receptionists provided par-ents with study materials at check-in and instructed them to review and to complete the forms. The packet included an introductory letter, consent form, demo-graphic questions, and ASQ, with a postage-paid return envelope. In the examination room, the nurse answered questions and collected completed forms. The nurse and pediatrician both relayed a simple message to caregivers, “The ASQ is a fun and very important part of this well-child visit. Please fill it out. If you don’t have time, take it home and mail it in.” The pediatrician filled out the PDI after the well-child visit, blinded to the ASQ results. A flowchart depicting the implemented ASQ screening process is shown in Fig 1.
Referral Criteria and Referral Rate Comparison
Pediatricians referred cases according to their usual care procedures. ASQ referral rules followed eligibility crite-ria set forth in the state where the study took place, that is, 2 SDs below the mean in 1 developmental area or 1.5 SDs below the mean in 2 areas. Recorded physician referrals from April 2003 to March 2004 were used for comparison. (Data for 2004 –2005 could not be used because a pilot test of the ASQ system was conducted
during that period.) Physicians remained constant (no changes) during the comparison and study years.
Physician Referral Probability and ASQ Return
The2test, thettest, and backward-elimination logistic models were used to determine the probability of phy-sician referral and differences in no-return cases. For the no-return analysis, 13 demographic variables were tested and evaluated with an adjusted Bonferroni P
value.
PDI-ASQ Agreement
Only cases with PDI and ASQ results were analyzed (n⫽
699). PDI categories of questionable and delayed were collapsed, to capture all cases of physician concern even if a referral was not made; ASQ questionable and de-layed categories were also collapsed. A2test was used to examine the relative distribution frequency of the PDI and ASQ developmental categories.
Screening, Evaluation Criteria, and Eligibility Outcomes After receiving the referral, part C EI service providers conducted customary intake screening over the tele-phone with the parent. Additional information, includ-ing parent medical concerns, psychosocial issues, risk factors, and clarification or readministration of ASQ items, was collected. Children were placed in 1 of 3 categories, that is, (1) eligible for evaluation, (2) ongoing monitoring, or (3) not eligible for services. Subjects who were determined to be not eligible under the state’s part C eligibility guidelines were screened out, with no planned future contact.23 Subjects who had low test scores but were unlikely to meet eligibility criteria were placed on an “ongoing monitoring” list, with repeat ASQ testing over the telephone by the part C agency 2 to 6 months later. ASQ and part C agency agreement was examined with cross-tabulation using a 2-SD ASQ cutoff value for delayed classification, as advised in the ASQ technical report. The2test could not be used because of small cell size.
RESULTS
Patient Characteristics
The 12-month sample consisted of approximately equal male (49.9%) and female (50.1%) proportions; the 24-month sample included slightly more male subjects (53.0%) than female subjects (47.0%). For the com-bined sample, white children constituted the largest eth-nic group (72.2%). Hispaeth-nic/Latino children made up the second largest ethnic group, with 7.7% Spanish-first and 5.9% English-first language groups. Patient charac-teristics are summarized in Table 1.
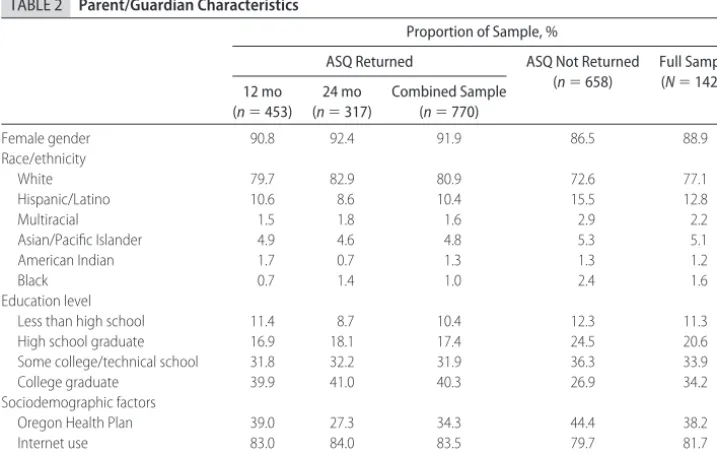
Parent/Guardian Characteristics
of-ten acting as the study respondent (86.9%), followed by fathers (10.8%), foster parents (1.2%), and grandpar-ents (1.1%). The mean respondent age was 29.69 years, with 88.7% self-reported as high school or higher edu-cation graduates. Parents were 77.1% white, 10.3% His-panic/Latino, Spanish-first, and 4.5% HisHis-panic/Latino, English-first. Insurance status, collected as a proxy for income, was recorded as self-pay, Oregon Health Plan,
or commercial insurance. During the study, the Oregon Health Plan provided Medicaid coverage to Oregon fam-ilies with incomes at or below 133% (famfam-ilies with chil-dren⬍6 years of age) and 185% (families with children
⬍19 years of age) of the federal poverty level, with income cutoff values being dependent on the number of family members. Thirty-nine percent of patients re-ceived coverage under the Oregon Health Plan. Internet FIGURE 1
Flowchart of ASQ screening implementation.
TABLE 1 Patient Characteristics
Proportion of Sample, %
ASQ Returned ASQ Not Returned (n⫽658)
Full Sample (N⫽1428) 12 mo
(n⫽453)
24 mo (n⫽317)
Combined Sample (n⫽770)
Female gender 50.1 47.0 48.8 48.8 48.8
Race/ethnicity
White 73.7 77.3 75.0 69.2 72.2
Hispanic/Latino 13.4 10.2 12.3 15.2 13.6
Multiracial 5.4 6.3 5.7 7.9 6.8
Asian/Pacific Islander 5.4 3.9 4.8 4.4 4.6
American Indian 1.1 0.4 0.8 1.4 1.1
use was assessed by asking parents the following ques-tion: “Do you log on and use the Internet by yourself, without help, either at work or at home?” Although the current study did not use an Internet-based system, the participating medical group (PeaceHealth) was inter-ested in assessing the practicality of moving toward an electronic system. Results showed that 81.7% accessed and used the Internet. Parent/guardian characteristics are presented in Table 2.
Nonresponse bias was assessed by testing participant characteristic differences listed in Table 3. Notable sig-nificant differences existed for just 2 of the 13 tested demographic factors, that is, younger parents and lower-income participants (Medicaid). A Bonferroni-adjustedP
value was used to control for multiple tests and associ-ated spurious findings attributable to chance.
Practitioner Characteristics
Of the 18 pediatricians, 44.4% were female and 99.6% had been practicing forⱖ5 years (mean years in practice: 18.67; SD: 11.53). Almost one half were in full-time practice (44.5%), with 5.6% employed less than half time.
Office Feasibility
Office feasibility pertained primarily to implementing a low-cost screening system that did not disrupt office flow. Total itemized costs ranged from $1.61 to $2.43 per patient. Cost variability included in-office or mail-back ASQ completion and practitioner follow-up time. The needed time per patient was⬍30 seconds for the recep-tionist to explain the process,⬍30 seconds for the prac-titioner and nurse to give instructions, and ⬃3 to 4 minutes for resource office staff members to enter ASQ
results into the electronic medical charts, complete re-ferrals, and score the ASQ. Approximately 3% of partic-ipants requested assistance with completing the ASQ (72% Hispanic/Latino and 67% Medicaid). Although the system required training of both receptionists and nursing staff members for specific tasks, this training was minimal (30 minutes).
Referral Rates
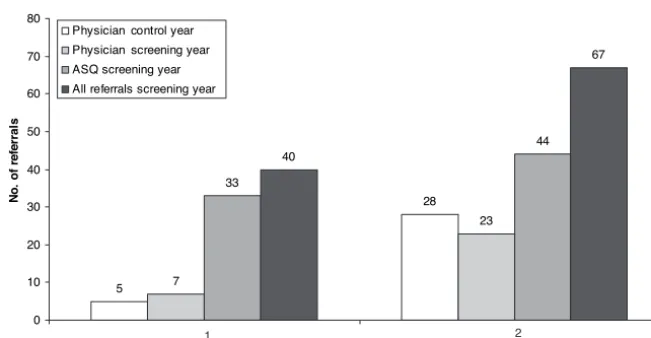
Referral rates increased by 224% from the control year to the screening year (from 33 to 107 patients), with physicians referring 45 of 107 patients on the basis of their clinical impression alone. Of those patients, 78% were 24 months of age and 73% were male. Patient volume for children in the 0- to 2-year age group was tracked, to determine whether changes in total patient
TABLE 2 Parent/Guardian Characteristics
Proportion of Sample, %
ASQ Returned ASQ Not Returned (n⫽658)
Full Sample (N⫽1428) 12 mo
(n⫽453)
24 mo (n⫽317)
Combined Sample (n⫽770)
Female gender 90.8 92.4 91.9 86.5 88.9
Race/ethnicity
White 79.7 82.9 80.9 72.6 77.1
Hispanic/Latino 10.6 8.6 10.4 15.5 12.8
Multiracial 1.5 1.8 1.6 2.9 2.2
Asian/Pacific Islander 4.9 4.6 4.8 5.3 5.1
American Indian 1.7 0.7 1.3 1.3 1.2
Black 0.7 1.4 1.0 2.4 1.6
Education level
Less than high school 11.4 8.7 10.4 12.3 11.3
High school graduate 16.9 18.1 17.4 24.5 20.6
Some college/technical school 31.8 32.2 31.9 36.3 33.9
College graduate 39.9 41.0 40.3 26.9 34.2
Sociodemographic factors
Oregon Health Plan 39.0 27.3 34.3 44.4 38.2
Internet use 83.0 84.0 83.5 79.7 81.7
Requested ASQ help for completion 2.7 1.8 2.3 4.5 3.4
TABLE 3 ASQ Return Rates According to Sample Characteristics
Not Returned (N⫽658)
Returned (N⫽770)
tor 2a Respondent age, mean⫾SD, y 29.10⫾6.4 30.20⫾6.9 ⫺2.93b
Child age, mean⫾SD, mo 17.85⫾6.4 17.30⫾6.1 1.64 Female respondents,n(%) 544 (86.5) 632 (91.1) 7.01 Mother respondents,n(%) 532 (80.9) 614 (79.7) 0.28 Spanish speakers,n(%) 72 (10.9) 61 (7.9) 3.83 Minority respondents,n(%) 205 (31.2) 211 (27.4) 2.42 Minority children,n(%) 265 (40.3) 298 (38.7) 0.37 Oregon Health Plan,n(%) 283 (43.0) 243 (31.6) 20.0b
Minority language,n(%) 130 (19.8) 162 (21.0) 0.36
Premature,n(%) 26 (4.2) 39 (5.7) 1.61
Less than high school education,n(%) 74 (11.2) 71 (9.2) 1.60 Requested ASQ help,n(%) 28 (4.5) 16 (2.3) 4.83 Do not use Internet,n(%) 126 (20.3) 114 (16.5) 3.11
volume were correlated with observed changes in refer-ral rates. A 14.65% decrease in patient volume between the comparison year and the screening year was found, whereas no pediatrician or clinical nurse practitioner changes occurred between the comparison and screen-ing periods. The greatest referral increase was for 12-month-old patients (Fig 2). Physician focus on norma-tive development might have increased as a result of study participation; otherwise, there were no historical cohort reasons for referral increase. Total pediatrician referrals without the ASQ during the screening year were slightly higher at 12 months (from 5 to 7 referrals) and lower at 24 months (from 28 to 23 referrals), com-pared with the control/comparison year.
The probability of pediatrician referral was signifi-cantly elevated for children with physician-suspected communication delay (odds ratio: 136.50; 95% confi-dence interval: 45.83– 406.52) and gross motor delay (odds ratio: 58.80; 95% confidence interval: 9.48 –364.69). An adjusted BonferroniPvalue was used to control for chance findings (10 variables were entered into the model). Did physicians “miss” or use a “wait and see” approach with likely delayed children who went on to receive EI services? Thirty-eight percent of 12-month cases and 23% of 24-month cases were missed (consid-ered typical by doctors and eligible for services or mon-itoring by the part C agency). Thirteen percent of 12-month-old patients and 16% of 24-12-month-old patients were not referred when doctors indicated questionable or delayed development on the PDI. In summary, com-pared with wait and see delays, there were 3 times as many missed delays at 12 months and 1.43 times as many missed delays at 24 months, which resulted in more missed delays than wait and see delays at both times but a greater percentage of missed delays at the 12-month visit.
EI Assessment Algorithm
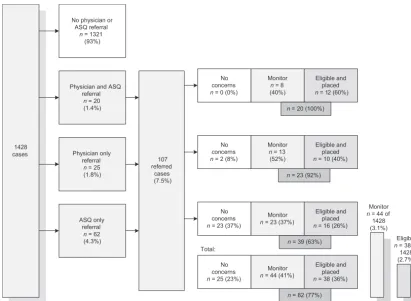
For the 107 combined pediatrician and ASQ referrals, 81 unique cases were identified, with 38 referred cases
(36%) meeting strict state IDEA eligibility requirements for part C special education services; 44 (41%) were scheduled for future screening because of suspect devel-opment that may lead to future eligibility. Twenty-five referred cases (23%) did not qualify for additional fol-low-up assessment (Fig 3).
By using the part C agency evaluation results as “true” developmental status, 25 cases were screened out, 44 patients were placed on an on-going monitoring list, and 38 patients were placed in services. Of those who were found to be not eligible, 67% had a delay in only 1 developmental area. All except 1 of the 12-month-old patients qualified in⬎1 domain, as well as communica-tion. Ninety-six percent of 24-month-old patients qual-ified in⬎1 domain, as well as communication. Eligible female subjects made up 43% of 12-month-old subjects and 32% of 24-month-old subjects.
PDI and ASQ Agreement
Of the 699 patients with ASQ and PDI data, pediatricians indicated that 89.4% (n⫽ 625) were developing typi-cally, 6.7% (n⫽47) had questionable development, and 3.9% (n ⫽ 27) had delayed development. The ASQ indicated that 78.4% (n⫽ 548) were developing typi-cally, 6.0% (n⫽42) had questionable development, and 15.6% (n⫽109) had delayed development. Seven cases were considered typical by the ASQ and delayed by the physician, with suspected communication delays indi-cated in all 7 cases, but a referral for additional EI eval-uation made for only 1 child.
Because of small cell sizes (n⬍5) in the2analysis, PDI and ASQ cases with questionable and delayed rat-ings were combined; results are presented in Table 4. A significant difference between ASQ and pediatrician de-velopmental impressions was found, with overall agree-ment at 81.8%. Of ASQ delayed cases, 67.5% (n⫽102) were not detected by pediatricians (considered typical). Conversely, 25 cases (33.8%) were of concern to physi-cians but the ASQ results did not indicate delayed de-velopment. 5 28 7 23 33 44 40 67 0 10 20 30 40 50 60 70 80
Age of child, y
N o . of r e fe rral s
Physician control year Physician screening year ASQ screening year All referrals screening year
1 2
FIGURE 2
DISCUSSION
This study’s focus was to investigate the impact of im-plementing a paper-based, parent-completed, develop-mental screening system in a busy office practice at the 12- and 24-month well-child visits. This in-office or at-home ASQ screening system took little time (⬍30 seconds) away from the nurse and pediatrician during the limited minutes of the well-child check. The system was low cost, at $1.61 to $2.43 per patient. Only 3.4% of parents requested help to complete the ASQ, with over-representation of Spanish-speaking, low-income partic-ipants. Referral rates in this practice increased 224% between the comparison and screening years, despite the 14.65% decline in patient volume. The increase in referrals at both 12 and 24 months, with a more-notable
increase for the 12-month-old group, suggests that phy-sicians may have greater difficulty identifying younger, potentially delayed children and children with question-able developmental status or may prefer to use a wait and see approach.
Thirty-eight (36%) of the 107 referred patients qual-ified for special education services, 44 (41%) required closer observation, and 25 (23%) did not qualify. With pediatrician referral for suspected delay, almost all pa-tients (96%) received some services after part C agency evaluation. Use of the ASQ more than doubled, from the comparison year to the study year, the number of chil-dren who were identified with delays and later became eligible for EI services (from 42 to 89 patients). Although 23% of the children (n⫽25) did not qualify for services immediately, the state’s stringent eligibility require-ments might be the reason. We know that long-term follow-up monitoring may result in eligibility of these children for services at a later time because of increased demands in the school environment, as well as broader IDEA eligibility guidelines beginning at 3 years.24In ad-dition, children and families that did not immediately qualify for part C services received needed resources that might improve child outcomes, such as referral for in-depth audiologic examinations and referral to day care settings with low child/adult ratios.
A disadvantage of this paper-based system was the FIGURE 3
Local part C agency screening and evaluation outcomes.
TABLE 4 Pediatrician-ASQ Agreement Contingency Table
ASQ Score,n(%)
Delayeda Typicala Totalb
Pediatrician score
Delayed 49 (7.0) 25 (3.6) 74 (10.6)
Typical 102 (14.6) 523 (74.8) 625 (89.4)
Total 151 (21.6) 548 (78.4) 699
Pediatrician and ASQ categories of questionable and delayed were collapsed (2⫽97.27;df⫽
1; 2-tailedP⫽.000; odds ratio: 10.05; 95% confidence interval: 5.94 –17.01).
54% return rate. Nonresponse might be explained in part through the theory of social exchange25in relation to participant-perceived study elements such as trust, costs, and benefits associated with participation. It is likely that some caregivers had no developmental con-cerns or simply were not interested in filling out the ASQ. It is also possible that other caregivers did not return the ASQ because of limited literacy. Although the moderate return rates could have led to selection bias, demographic analyses showed no statistically significant differences for the majority of demographic items (11 of 13 items) between those who did and did not return the ASQ. Notable statistically significant differences were present, however, for Medicaid (Oregon Health Plan) (P
⬍.000) and younger parents (P⬍.003). Although the 54% ASQ return rate was slightly below the 60% mean response rate for surveys published in medical journals,26 we considered it acceptable under “real-world” condi-tions. ASQ screening could increase caregiver concern about a potential delay. For this study, parental anxiety before and after screening was not a measured variable.
CONCLUSIONS
This study concurred with a previous study that reliance on clinical impressions or developmental milestone re-view alone leads to significantly fewer children receiving developmental services.11 Interestingly, when pediatri-cian appraisal using the PDI indicated abnormal findings, the child almost always qualified for EI services; pedia-tricians should trust their impressions but should realize their observational limitations, because 37 of the total of 82 EI-eligible or monitored children would have been missed on the basis of doctor impression alone (no ASQ). A larger PDI-ASQ discrepancy, a more-notable increase in referrals, and more missed delays were observed at 12 months, which suggests a more-dramatic impact with ASQ screening at this visit. Implementing this screening system fostered a more-collaborative partnership be-tween this local pediatric practice and the part C agency. The system was found to be feasible and low cost and did not impede office flow. However, quality improvement opportunities exist to overcome real-world obstacles by increasing return rates and designing a process that cor-rects for prematurity easily.
What is the future direction of developmental screen-ing in the office settscreen-ing? Because the waitscreen-ing room did not seem to be an ideal environment for parents to complete the ASQ thoughtfully with their children, we devised a system of “do it in the office or mail it from home.” As an alternative, an Internet-based ASQ ver-sion will soon be developed in multiple languages. An electronic system should reduce photocopying expenses, paper, and office staff time devoted to processing and scoring questionnaires. With an electronic system, it should be easier to correct for prematurity and to ad-minister the ASQ for the correct age interval when
per-forming surveillance and screening, as recommended by the American Academy of Pediatrics.1
Caregivers eventually should be able to complete the ASQ in their home before the office visit or at a kiosk in a quiet corner of the waiting room. Results would be scored automatically by the computer and handed to the doctor by office staff members at the beginning of the well-child check, for discussion. Internet-based systems could have additional advantages, such as the use of embedded video clips to illustrate targeted skills and voice synthesis capabilities to read questionnaires in the available language translations for those with limited reading ability. Periodic use of standardized screening tests, coupled with powerful Internet-based and video capabilities, should improve early identification of devel-opmental delays in young children.
ACKNOWLEDGMENTS
We thank Sandy Campbell, Kathy Clark, and Kimberly Murphy for careful data tracking and management; Judy Newman and Elizabeth Twombly for assistance with training and collaboration; Dr Igor Gladstone for valu-able input and foresight; and all of the young children and their participating parents who made this study possible.
REFERENCES
1. American Academy of Pediatrics, Council on Children with Disabilities, Section on Developmental Behavioral Pediatrics, Bright Futures Steering Committee, Medical Home Initiatives for Children With Special Needs Project Advisory Committee. Identifying infants and young children with developmental disorders in the medical home: an algorithm for developmental surveillance and screening.Pediatrics.2006;118:405– 420 2. American Academy of Pediatrics, Committee on Children with
Disabilities. Developmental surveillance and screening of in-fants and young children.Pediatrics.2001;108:192–196 3. McCormick MC, Brooks-Gunn J, Buka SL, et al. Infant health
and development program at 18 years of age.Pediatrics.2006; 117:771–786
4. Shonkoff JP. From neurons to neighborhoods: old and new challenges for developmental and behavioral pediatrics.J Dev Behav Pediatr.2003;24:70 –76
5. Guralnick MJ. Effectiveness of early intervention for vulnera-ble children: a developmental perspective.Am J Ment Retard.
1998;102:319 –345
6. Ramey CT, Landesman Ramey S. Effective early intervention.
Ment Retard.1992;30:337–345
7. Hamilton S. Screening for developmental delay: reliable, easy-to-use tools: win-win solutions for children at risk and busy practitioners.J Fam Pract.2006;55:415– 422
8. Squires J, Bricker D, Potter L. Ages and Stages Questionnaires User’s Guide.2nd ed. Baltimore, MD: Paul Brookes Publishing; 1999
9. Boyle CA, Decoufle P, Yeargin-Allsopp M. Prevalence and health impact of developmental disabilities in US children.
Pediatrics.1994;93:399 – 403
10. Bailey DB, Hebbeler K, Scarborough A, Spiker D, Mallik S. First experiences with early intervention: a national perspective.
11. Halfon N, Regalado M, Sareen H, et al. Assessing development in the pediatric office.Pediatrics.2004;113:1965–1972 12. Sand N, Silverstein M, Glascoe FP, Tonniges T, Gupta B,
O’Connor K. Pediatricians’ reported practices regarding devel-opmental screening: are guidelines used? Do they help? Pre-sented at: annual meetng of the Pediatric Academic Societies; May 1– 4, 2004; San Francisco, CA
13. Glascoe FP. Standards for screening test construction. Available at: www.dbpeds.org/articles/detail.cfm?TextID⫽%2029. Ac-cessed June 1, 2007
14. Bricker D, Squires J.Ages and Stages Questionnaires: A Parent-Completed, Child-Monitoring System (ASQ). Baltimore, MD: Brookes Publishing; 1995
15. Bricker D, Squires J.Ages and Stages Questionnaires: A Parent-Completed Child-Monitoring System. 2nd ed. Baltimore, MD: Brookes Publishing; 1999
16. Squires J, Potter L, Bricker D.ASQ User’s Guide. Baltimore, MD: Brookes Publishing; 1995
17. Squires J, Potter L, Bricker D, Lamorey S. Parent-completed developmental questionnaires: effectiveness with low and middle income parents.Early Child Res Q.1998;13:345–354 18. Filipek P, Accardo P, Baranek G, et al. The screening and
diagnosis of autistic spectrum disorders.J Autism Dev Dis.1999; 29:439 – 484
19. Filipek PA, Accardo P, Ashwal S, et al. Practice parameter: screening and diagnosis of autism: a report of the Quality
Standards Subcommittee of the American Academy of Neurol-ogy and the Child NeurolNeurol-ogy Society. Neurology. 2000;55: 468 – 479
20. Tucker M. MgSO4 does not raise disability risk in children:
follow-up study of Magpie Trial participants also shows no increased risk of death. OB/GYN News. December 15, 2004. Available at: http://findarticles.com/p/articles/mi_m0CYD/is_ 24_39/ai_n8697291. Accessed June 1, 2007
21. Skellern C, Rogers Y, O’Calliaghan M. A parent-completed developmental questionnaires: follow up of ex-premature in-fants.J Paediatr Child Health.2001;37:125–129
22. Williams DL, Gelijns AC, Moskowitz AJ, et al. Hypoplastic left heart syndrome: valuing the survival.J Thorac Cardiovasc Surg.
2000;119:720 –731
23. Shackelford J. State and Jurisdictional Eligibility Definitions for Infants and Toddlers With Disabilities Under IDEA. Chapel Hill, NC: University of North Carolina, FPG Child Development Institute, National Early Childhood Technical Assistance Center; 2006
24. Glascoe FP. Are overreferrals on developmental screening tests really a problem?Pediatr Adolesc Med.2001;155:54 – 65 25. Emerson R. Power-dependence relations.Am Soc Rev.1962;27:
31– 41
26. Asch DA, Jedrziewski MK, Christakis NA. Response rates to mail surveys published in medical journals.J Clin Epidemiol.
1997;50:1129 –1136
WHO PAYS FOR EFFICIENCY? THE PRICE FOR LOWERING THE COSTS OF CARE IS MORE SPENDING
“Saving money can be expensive. Indeed, the quest to save dollars in the nation’s $2.1 trillion annual health care bill is becoming a lucrative market of its own. Thousands of companies, large and small, are pitching cost-saving ideas that range from electronic patient records to new medical devices. . . . The experience of Dr Richard Baron, who practices with three other physi-cians in an office in Philadelphia, provides a glimpse into the predicament. In 2004, Dr Baron and his colleagues made the transition from ink and paper to computers and electronic health records. They were doing what health care reformers had been advocating for years. But the arithmetic of investing in health-information technology is daunting, especially for small practices like Dr Baron’s. His office spent $140 000 on personal computers, including tablet PCs, servers, software and installation. The office’s annual technology costs, he said, were about $50 000, including maintenance and technical support, and he plans to upgrade the three-year-old computers at a cost of $54 000. Those costs do not include the lost productivity in the first year, when the staff was learning to use the new technology. Dr Baron’s office has saved money—in transcribing medical reports, for example—and his practice now handles its 6000 patients with three fewer office employees. He described other benefits, mainly the ability to find information quickly for patients, hospitals, insurers and labs with a few keystrokes. The technology, Dr Baron said, has also helped make him become a more adept physician. But it has not yet paid off in dollars and cents: the savings in salaries is less than the costs entailed in computerization. ‘It is a high-risk venture,’ he said, ‘and you do it at your own financial peril.’”
DOI: 10.1542/peds.2006-3583
2007;120;381
Pediatrics
Hollie Hix-Small, Kevin Marks, Jane Squires and Robert Nickel
Pediatric Practice
Impact of Implementing Developmental Screening at 12 and 24 Months in a
Services
Updated Information &
http://pediatrics.aappublications.org/content/120/2/381
including high resolution figures, can be found at:
References
http://pediatrics.aappublications.org/content/120/2/381#BIBL
This article cites 18 articles, 6 of which you can access for free at:
Subspecialty Collections
milestones_sub
http://www.aappublications.org/cgi/collection/growth:development_ Growth/Development Milestones
al_issues_sub
http://www.aappublications.org/cgi/collection/development:behavior Developmental/Behavioral Pediatrics
following collection(s):
This article, along with others on similar topics, appears in the
Permissions & Licensing
http://www.aappublications.org/site/misc/Permissions.xhtml
in its entirety can be found online at:
Information about reproducing this article in parts (figures, tables) or
Reprints
http://www.aappublications.org/site/misc/reprints.xhtml
DOI: 10.1542/peds.2006-3583
2007;120;381
Pediatrics
Hollie Hix-Small, Kevin Marks, Jane Squires and Robert Nickel
Pediatric Practice
Impact of Implementing Developmental Screening at 12 and 24 Months in a
http://pediatrics.aappublications.org/content/120/2/381
located on the World Wide Web at:
The online version of this article, along with updated information and services, is
by the American Academy of Pediatrics. All rights reserved. Print ISSN: 1073-0397.