Letters to the Editor
Statements appearing here are those of the writers and do not represent the official position of the American Academy
of Pediatrics, Inc. or its Committees. Comments on any topic, including the contents ofPediatrics,are invited from all
members of the profession: those accepted for publication will not be subject to major editorial revision but generally must be no more than 400 words in length. The editors reserve the right to publish replies and may solicit responses from authors and others.
• • •
Letters should be submitted in duplicate in double-spaced typing on plain white paper with name and address of sender(s) on the letter. Send them to Jerold F. Lucey, MD, Editor, Pediatrics Editorial Office, University of Vermont College of Medicine, 89 Beaumont Ave, Given Building, Room D201, Burlington, VT 05405-0068.
Two Views of Developmental Testing
To the Editor.—
I am deeply perturbed by Dr Frankenburg’s commentary.1His
assertions are erroneous and troubling:
1. Developmental delays cannot be quantified.False! Every state,
un-der the Individuals With Disabilities Education Act, has care-fully generated definitions of developmental delays (eg, 40% delay in a single developmental area or 25% delays in 2 or more areas). Children who meet such criteria are eligible for special education services, preschool intervention programs, and an array of other assistance. Clearly, development can not only be quantified but quantified in a way that is meaningful and productive.
2. The Denver II is a developmental growth chart and not a screening
tool.If this were the case, why does the measure provide scores
such as “abnormal,” or “questionable.” Why does the Denver II remain the tool most frequently mentioned by pediatricians when asked how they detect developmental delays? More im-portantly, why does the Denver II manual and its authors not actively discourage use of the tool in screening? Finally, if the Denver II is a growth chart, why would we want to deploy it if such a process did not lead to detection of potential problems and to a proven intervention?
3. Psychometric support for the Denver II and the Prescreening
Devel-opmental Questionnaire (PDQ) is adequate.Also untrue. The
mea-sures were standardized only in Colorado and not throughout the United States. Thus, we do not know whether the test works well in diverse settings: New York City, Miami, or Bayou Goula, Louisiana. Even growth charts for height and weight were standardized on a sample that was geographically di-verse. Even more disturbing, the Denver II is not validated. The authors should have administered the test alongside a battery of criterion measures tapping the various developmental do-mains and then calibrated cutoff scores in relation to diagnostic results. Failure to do this is not only psychometrically un-sound2but also explains the Denver II’s limited sensitivity or
specificity.3The PDQ II, a subset of Denver II items, suffers
from similar psychometric and scoring weaknesses. A reviewer at the Buros Institute of Mental Measurement noted that “. . . the absence of reliability, validity, and comprehensive normative data, suggests the PDQ be used most cautiously, primarily as an
experi-mental or exploratory scale in research.”4
Problems with the accuracy of the Denver II were noted⬎10 years ago, and the authors were encouraged to remove the test from the market to pursue the necessary standardization and validation.2The tremendous influence of the Denver II on the field
of pediatrics, nationally and internationally, places heavy respon-sibility on its authors to market a quality instrument. School failure, worsening delays, unnecessarily expensive and intensive special education services all await a child with special needs who is unidentified because of an invalid screening test. Alternatively, poorly constructed measures waste precious diagnostic resources and professional time and may cause parents needless worry and expense.
Yet the responsibility of constructing a quality measure is not onerous. The principles of test construction are well-defined by a consortium of societies devoted to psychological and educational research.3Many other tests have been subjected to psychometric
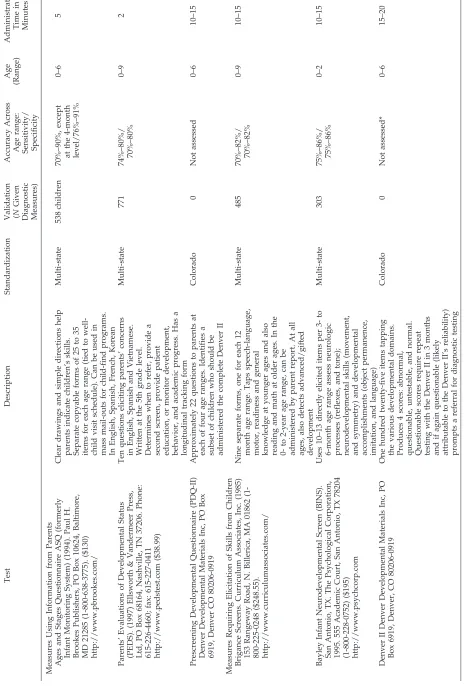
studies and, unlike the Denver II, found worthy of clinical appli-cation. Table 1 (see page 1182) illustrates the differences between the Denver II and several competing screening and surveillance measures. Providers are encouraged to select tools that enjoy nationally representative standardization, validation, and high levels of accuracy (ie, sensitivity in detecting delays/disabilities and specificity in detecting typical development⬎70%).5
Frances Page Glascoe, PhD East Berlin, PA 17316
REFERENCES
1. Frankenburg WK. Developmental surveillance and screening of infants and young children.Pediatrics.2002;109:144 –145
2. American Educational Research Association, American Psychological Association, National Council on Measurement in Education.Standards for Educational and Psychological Testing.5th ed. Washington, DC: Amer-ican Educational Research Association; 1999
3. Glascoe FP, Byrne KE, Chang B, Strickland B, Ashford L, Johnson K. Accuracy of the Denver II in developmental screening.Pediatrics.1992; 89(Suppl):1221–1225
4. Michael WB. Review of the Revised Denver Prescreening Developmen-tal Questionnaire. In: Conoley JC, Impara JC, eds.The Twelfth Mental Measurements Yearbook. Lincoln, NE: Buros Institute of Mental Measurements; 1995. (See Test Number 327.)
5. Squires J, Nickel RE, Eisert D. Early detection of developmental problems: strategies for monitoring young children in the practice set-ting.J Dev Behav Pediatr.1996;17:420 – 427
In Reply.—
Dr Glascoe’s response to my commentary1makes a variety of
surprising assertions and quotations showing that she misread the commentary in some cases and is not up-to-date in others. In addition, she raises so many issues that it is difficult to respond to all of them here.
1. She attributes to me the statement “developmental delay can-not be quantified.” That was can-not in my commentary. What was said was, “There is no single universally agreed upon definition of ‘developmental delay.’ ” Clinicians speaking of growth or developmental delays may have very different interpretations of the word “delay.” Although an education law may state specific percentages of delay that qualify for services, the di-versity of procedures used to determine these percentages pre-clude a universal reliable definition even among educators. 2. She implies that a developmental growth chart cannot be used
as a screening tool. Growth charts, questionnaires, and a variety of other procedures have been used as screening tools for decades. “Screening” as used in my commentary refers to the
PEDIATRICS Vol. 109 No. 6 June 2002 1181 at Viet Nam:AAP Sponsored on August 30, 2020
www.aappublications.org/news
TABLE 1. Comparison of Screening and Surveillance Tools Test Description Standardization
Validation (N
Given Diagnostic Measures) Accuracy Across Age range: Sensitivity/ Specificity Age (Range) Administration Time in Minutes Measures Using Information from Parents Ages and Stages Questionnaire ASQ (formerly Infant Monitoring System) (1994). Paul H. Brookes Publishers, PO Box 10624, Baltimore, MD 21285 (1-800-638-3775). ($130) http://www.pbrookes.com/ Clear drawings and simple directions help parents indicate children ’s skills. Separate copyable forms of 25 to 35 items for each age range (tied to well-child visit schedule). Can be used in mass mail-outs for child-find programs. In English, Spanish, French, Korean Multi-state 538 children 70% –90%, except at the 4-month level/76% –91% 0– 65 Parents ’ Evaluations of Developmental Status (PEDS). (1997) Ellsworth & Vandermeer Press, Ltd, PO Box 68164, Nashville, TN 37206. Phone: 615-226-4460; fax: 615-227-0411 http://www.pedstest.com ($38.99) Ten questions eliciting parents ’ concerns in English, Spanish and Vietnamese. Written at the 5th grade level. Determines when to refer, provide a second screen, provide patient education, or monitor development, behavior, and academic progress. Has a longitudinal tracking form Multi-state 771 74% –80%/ 70% –80% 0– 92 Prescreening Developmental Questionnaire (PDQ-II) Denver Developmental Materials Inc, PO Box 6919, Denver CO 80206-0919 Approximately 22 questions to parents at each of four age ranges. Identifies a subset of children who should be administered the complete Denver II Colorado 0 Not assessed 0– 61 0– 15 Measures Requiring Elicitation of Skills from Children Brigance Screens. Curriculum Associates, Inc. (1985) 153 Rangeway Road, N. Billerica, MA 01862 (1-800-225-0248 ($248.55). http://www.curriculumassociates.com/ Nine separate forms, one for each 12 month age range. Taps speech-language, motor, readiness and general knowledge at younger ages and also reading and math at older ages. In the 0-to 2-year age range, can be administered by parent report. At all ages, also detects advanced/gifted development Multi-state 485 70% –82%/ 70% –82% 0– 91 0– 15 Bayley Infant Neurodevelopmental Screen (BINS). San Antonio, TX. The Psychological Corporation, 1995. 555 Academic Court, San Antonio, TX 78204 (1-800-228-0752) ($195) http://www.psychcorp.com Uses 10 –13 directly elicited items per 3-to 6-month age range assess neurologic processes (reflexes, and tone); neurodevelopmental skills (movement, and symmetry) and developmental accomplishments (object permanence, imitation, and language) Multi-state 303 75% –86%/ 75% –86% 0– 21 0– 15 Denver II Denver Developmental Materials Inc, PO Box 6919, Denver, CO 80206-0919 One hundred twenty-five items tapping the various developmental domains. Produces 4 scores: abnormal, questionable, untestable, and normal. Questionable scores require repeat testing with the Denver II in 3 months and if again questionable (likely attributable to the Denver II ’s reliability) prompts a referral for diagnostic testing Colorado 0 Not assessed* 0– 61 5– 20 * A 1992 study found sensitivity of 80% if “questionable scores ” were included with abnormal scores but specificity of 46%. Alternatively, if “questionable scores ” were included with normal scores, sensitivity was 46% and specificity was 80% — in neither case a parsimonious scoring solution.
application of quick, simple procedures to examine a presump-tively normal population to ferret out those individuals who are likely to be harboring the problem in question. Screening procedures merely suggest the individual who should be fur-ther evaluated. They do not make a diagnosis. My commentary and our previous writings reflect this approach. The scoring she referred to in her text and her chart fail to reflect changes made 10 years ago.2
3. She questions whether the Denver II “works well in diverse settings.” My commentary stated, “When clinically significant developmental differences attributable to sex, ethnicity, mater-nal education or place of residence occurred, the differences were given in the Denver II Technical Manual.” This manual also documents that there is no clinically significant difference on the previously mentioned variables between the demo-graphics of the standardization population and the US 1980 census.
4. Her comments regarding the test’s validity, sensitivity, and specificity again suggest a lack of understanding of my com-mentary’s discussion of the Denver II’s validity. Because growth charts do not have sensitivity and specificity data, are they also not valid?
5. Her discussion reveals that she doesn’t know that the Denver II interpretation was revised as early as 1992, and its similarity to a growth curve was made at the time it first appeared. 6. She is correct in stating that PDQ II reliability data have not
been presented. The PDQ II is a simple, quick questionnaire to be used as a prescreen to identify children who should be further evaluated with the Denver II. It was developed using the norms of the Denver II standardization. This is similar to the way in which the PDQ and RPDQ were used in relation to the DDST by busy pediatricians.
7. Were it only as simple as Dr Glascoe suggests in Table 1 of her letter, each of the screening procedures, for which she gives sensitivity and specificity measures, would have equal sensi-tivities and specificities for every aspect of development. Per-haps, it is with the recognition, that no one developmental screening test can identify all developmental aberrations, that the AAP Committee on Children With Disabilities suggests the use of additional screens when the clinician suspects a problem such as a behavior disorder.
8. One must question the relevance of Table 1 in her letter which includes her test, the Parents Evaluation of Developmental Status (PEDS), as an example of an adequate screen. A recent scholarly review of the PEDS states that the test “suffers from some important psychometric limitations” (standardization sample, reliability, and validity data).3 In fact, the reviewer
says: “At a minimum those youngsters identified by significant concerns on the PEDS should be referred for a broad spectrum, validated screening test like the Battelle Developmental Inven-tory Screening Test or the Denver II.”3
The PDQ II followed, if necessary, by the Denver II is designed to serve the busy clinician with a brief overview of a child’s development in personal-social, fine motor-adaptive, language, and gross motor areas. As in the case of a growth curve, it is designed to serve as a quick screen of development and for developmental surveillance. In the end, the clinician has to decide for him/herself which test and which deviation are most relevant. There is no substitute for clinical judgment.
William K. Frankenburg, MD, MSPH University of Colorado School of Medicine Denver, CO
REFERENCES
1. Frankenburg WK. Developmental surveillance and screening of infants and young children.Pediatrics.2002;109:144 –145
2. Frankenburg WK, Dodds J, Archer P, et al. The Denver II Training Manual.Denver, CO: Denver Developmental Materials, Inc; 1992 3. Bischoff L. Review of the Parents’ Evaluation of Developmental Status.
In: Plake BS, Impara JC, eds.Fourteenth Mental Measurements Yearbook. Lincoln, NE: Buros Institute of Mental Measurements; 2001:897–900
2-Dose Hepatitis Vaccination Versus 3-Dose
Regimen
To the Editor.—
The recent paper by Levaux et al1that compares a 2-dose
hepatitis vaccination regimen against a 3-dose regimen makes some quantitative errors or assumptions that bias results in favor of the 2-dose hepatitis B regimen. First, the authors assume vac-cine seroprotection rates for completion of the 2- and 3-dose regimens are 99.2% and 98.3%, respectively. The sole study2on
which these rates are based indicates this difference has aPvalue of .62. In fact, had one fewer person in the 2-dose arm serocon-verted, the observed seroprotection rates would be both mathe-matically and statistically equivalent. It would have been more prudent to use the weighted average of the 2 seroprotection rates for both regimens when building economic models. Second, the authors presume that the probability of receiving the second dose among those receiving the first dose is equivalent in both the 2-dose and 3-dose vaccination regimens. This assumption seems implausible. The second dose of the 3-dose regimen is scheduled 1 month after the first, whereas the second in the 2-dose regimen is scheduled 4 to 6 months after the first. Surely the probability of receiving the second dose, among those who took the first, must be higher for the 3-dose series.
The fundamental problem with building a complex economic model that involves a number of assumptions is that it is difficult to access the effect individual assumptions have on the model. It is unclear how a revised analysis would change study results. It behooves model builders to include not just the assumptions that support their own beliefs, but also to consider those held by others that may not provide the same support.
David F. Cruess, PhD
Department of Preventive Medicine and Biometrics Uniformed Services University of the Health Sciences Bethesda, MD 20814-4799
REFERENCES
1. Levaux HP, Schonfeld WH, Pellissier JM, Cassidy WM, Sheriff SK, Fitzsimon C. Economic evaluation of a 2-dose hepatitis B vaccination regimen for adolescents.Pediatrics.2001;108:317–325
2. Cassidy WM, Watson B, Ioli VA, Williams K, Bird S, West DJ. A randomized trial of alternative two- and three-dose hepatitis B vacci-nation regimens in adolescents: antibody responses, safety, and immu-nologic memory.Pediatrics.2001;107:626 – 631
To the Editor.—
The study by Levaux et al1of adolescent hepatitis B
immuni-zation strategies has numerous limitations. First, their model as-cribes greater seroprotection at regimen completion for the 2-dose regimen, despite a lack of evidence that any such difference exists. Second, the authors assume adolescents are equally likely to re-ceive a second dose of the 2-dose regimen as a second dose of the 3-dose regimen. This is unlikely because the second dose of the 3-dose regimen is due only 4 weeks after the first, whereas the second of the 2-dose regimen is not due until 4 to 6 months after the first. Third, the assumed lifetime risk of 5% among persons age 11 to 15 years with no previous hepatitis B vaccination or hepatitis B exposure is overstated. Although they provide no reference for this estimate, all their hepatitis B clinical and economic effects derive from one previous cost-effectiveness analysis of the 3-dose regimen.2Importantly, that paper states a 4.16% risk for members
of a 1991 cohort who are at least 6 years old. Furthermore, the number of reported hepatitis B infections among persons at least 15 years old has decreased from 16 980 in 1991 (L. Finelli, Centers for Disease Control and Prevention, Division of Viral Hepatitis, Hepatitis Surveillance Branch, personal communication, August 17, 2001) to 7414 in 1998,3 or 56%. Using these data, a more
reasonable estimate of lifetime hepatitis B risk for this population is 1.83%, or 63% less than that used by the authors.
Assuming equivalent seroprotection at regimen completion and a more accurate hepatitis B risk estimate, the data used by Levaux et al results in the 3-dose regimen, not the 2-dose regimen, obtaining greater cost-effectiveness in each of the three analyses.
LETTERS TO THE EDITOR 1183
at Viet Nam:AAP Sponsored on August 30, 2020
www.aappublications.org/news
DOI: 10.1542/peds.109.6.1181
2002;109;1181
Pediatrics
Frances Page Glascoe
Two Views of Developmental Testing
Services
Updated Information &
http://pediatrics.aappublications.org/content/109/6/1181
including high resolution figures, can be found at:
References
http://pediatrics.aappublications.org/content/109/6/1181#BIBL
This article cites 4 articles, 2 of which you can access for free at:
Subspecialty Collections
l_issues_sub
http://www.aappublications.org/cgi/collection/development:behaviora
Developmental/Behavioral Pediatrics
following collection(s):
This article, along with others on similar topics, appears in the
Permissions & Licensing
http://www.aappublications.org/site/misc/Permissions.xhtml
in its entirety can be found online at:
Information about reproducing this article in parts (figures, tables) or
Reprints
http://www.aappublications.org/site/misc/reprints.xhtml
Information about ordering reprints can be found online:
at Viet Nam:AAP Sponsored on August 30, 2020
www.aappublications.org/news
DOI: 10.1542/peds.109.6.1181
2002;109;1181
Pediatrics
Frances Page Glascoe
Two Views of Developmental Testing
http://pediatrics.aappublications.org/content/109/6/1181
located on the World Wide Web at:
The online version of this article, along with updated information and services, is
by the American Academy of Pediatrics. All rights reserved. Print ISSN: 1073-0397.
the American Academy of Pediatrics, 345 Park Avenue, Itasca, Illinois, 60143. Copyright © 2002
has been published continuously since 1948. Pediatrics is owned, published, and trademarked by
Pediatrics is the official journal of the American Academy of Pediatrics. A monthly publication, it
at Viet Nam:AAP Sponsored on August 30, 2020
www.aappublications.org/news