Cost and Utilization Analysis of a Pediatric Emergency Department
Diversion Project
Cheng Wang, MS; Maria Elena Villar, MPH; Deborah A. Mulligan, MD; and Toran Hansen, MS
ABSTRACT. Objective. States are struggling to find effective means to decrease Medicaid costs. The objective of this pilot study was to compare emergency department (ED) cost and utilization by members who were enrolled in a pilot program (designed to reduce the use of hospital EDs) with the costs and utilization incurred by a control group.
Methods. A large, private, primary care pediatric practice launched a pilot ED diversion program that pro-vided extended office hours, multiple access locations, and care coordination. Participants in the program were Medicaid recipients who were younger than 18 years. Enrollment in the program was through either patient self-selection or mandatory assignment by the state Med-icaid agency. A total of 17 382 children who were en-rolled in the enhanced access program (intervention group) and 26 066 Medicaid-eligible children who re-ceived services from other local community primary care providers (control group) were included in the study. Children who had chronic health conditions and were receiving Supplemental Security Income benefits were excluded from this analysis. Regression analyses and t
tests were applied to analyze the medical claim data that were collected for this project. Three variables were used as dependent variables to measure different aspects of the ED cost and utilization: per member per month cost, per thousand member per month encounter frequency, and per encounter cost. These variables were used to compare the intervention group with the control group for ED claims, as well as for the overall cost of care during the study period.
Results. In the 12-month period subsequent to pro-gram initiation, the average per member per month cost for ED utilization of the intervention group was $1.36 less than that of the control group. However, there was no significant difference in terms of per-visit cost related to ED utilization. Therefore, the savings seemed to come as a result of a reduction in ED visits, not from reduced cost per visit. On average, children in the intervention group visited the ED approximately 8 fewer times per thousand members per month than the control group, yet there was no significant difference in the overall (ED and non-ED) cost of care between the intervention and con-trol groups.
Conclusion. Analysis from the first year of this pilot program demonstrates that by providing enhanced,
coor-dinated, primary care access to Medicaid children, the utilization of the ED was significantly lowered among healthy children, whereas the overall cost of care re-mained the same. Pediatrics 2005;116:1075–1079; case management, emergency department use, managed care, medicaid, primary care.
ABBREVIATIONS. ED, emergency department; AHCA, Agency for Health Care Administration; PMPM, per member per month; PMPE, per month per encounter; Penctr, per encounter cost.
I
n the face of sluggish economies and soaring Medicaid costs, states are looking for innovative ways to reduce health care spending,1,2 which continues to be 1 of the fastest growing sectors of state expenditures, despite a decrease in the rate of growth in recent years.3The decline in growth rates of Medicaid cost can be attributed to the wide variety of cost-containment strategies used by different states to address the problem.4 By 2003, virtually every state (49 states and the District of Columbia) had already taken Medicaid cost-containment ac-tions including the reduction of benefits, eligibility, and provider payments.5Use of the hospital emergency department (ED) for nonurgent care when primary care might be more appropriate has been identified as 1 of the causes contributing to increasing Medicaid costs,6 particu-larly as the rising number of uninsured people with limited access to primary care providers turn to EDs as a safety net for basic health care.7–10 There has been recent attention and controversy surrounding proposals for limiting access to emergency care for Medicaid populations as a cost-saving measure.11,12 Diverting patients away from EDs has also been attempted.13 Medicaid and related state agencies have attempted to deal with the problem of ED use for nonurgent care by introducing various gate-keeper strategies and other managed care approach-es.14–16
Continuity of care,17–19access to primary/preven-tive care,20–22 and increased parental education about handling childhood illnesses23 all have been associated with decreased ED utilization and/or hos-pitalization. A recent study found that enrollment in managed care was also associated with a reduction in ED utilization by children.24 The current study compared the ED utilization and cost of 2 groups of Medicaid eligible children: those who were enrolled in a pilot Pediatric ED Diversion Project; and those who received services from other providers.
From the Institute for Child Health Policy, Nova Southeastern University, Ft Lauderdale, Florida.
Accepted for publication Feb 2, 2005. doi:10.1542/peds.2004-2093 No conflict of interest declared.
Address correspondence to Deborah A. Mulligan, MD, Institute for Child Health Policy, Nova Southeastern University, 3200 South University Dr, Ste 1212, Ft Lauderdale, FL 33328. E-mail: [email protected]
METHODS Intervention
A large primary care pediatric health care provider in Broward County, Florida, was contracted by the Agency for Health Care Administration (AHCA) to launch a coordinated, case manage-ment program as a pilot to be evaluated for efficiency and cost-effectiveness. The case management program was designed to promote the use of primary care facilities among its members and decrease ED utilization. The pilot program for the intervention group included the following key changes:
• Case management for member counseling and case coordina-tion
• Mandatory second opinions that were made mandatory for all referrals
• Expanded after-hours care at select clinics with clinics open every day of the year until 9pm
• Walk-in services with no appointment necessary
• An after-hours, on-call registered nurse triage service
• Centralized records for all clinics
• A comprehensive web site to facilitate patient communication and provide access to health care information 24 hours per day
These services were communicated to the involved stakehold-ers, including members; local hospitals; local Medicaid offices; and the Women, Infants, and Children program. The intervention group members were also educated on the services available, on general health care, and on the importance of a medical home. Partnerships were established with health care partners to ensure that all necessary follow-up was received by the intervention group (case management) members.
Study Population
The study included Medicaid recipients who were 18 years and younger and living in Broward County. Because the study popu-lation was predetermined by the AHCA, it must be noted that the selection method was not completely randomized and interven-tion and control groups were based on needs determined by the health care system. Enrollment into the study population was generated by 1 of the following mechanisms:
• Member choice: member self-selection into the intervention group by choosing a pilot project physician as their primary care provider
• Health care agency choice: for members who did not select a primary care physician, mandatory assignment to the interven-tion group by the AHCA, the organizainterven-tion that handles Med-icaid programs
Results for the intervention group were compared with a con-trol population. The concon-trol population bore the same demo-graphic features as the intervention population. The only differ-ence was that the members in the control group had primary care providers who differed from that of the intervention group.
Data Sources
Data were transferred under a special arrangement through state rule authority with the AHCA of Florida and the Broward Regional Health Planning Council. The data analyzed were from patients who received services from April 1, 2002, through March 31, 2003. Only claims that were paid on or before December 31, 2003, were analyzed. The data were received in January 2004, at which time analysis of the data was undertaken. Data were grouped into 3 categories: (1) monthly member enrollment, (2) member demographics, and (3) paid claims. The overall cost was defined as all medical expenses that a member used in a month.
Outcome measures
The following 3 dependent variables were created from the data to understand the cost utilization of this program:
• Per member per month (PMPM): the total dollar amount paid for the cost of service being evaluated divided by the number of total eligible members in the month being evaluated
• Per thousand member per month per encounter (PMPE): the
divided by the total eligible members for the project in that month, multiplied by 1000
• Per encounter cost (Penctr): the total dollar amount for the cost being evaluated (ED cost, total cost) in the month being evalu-ated, divided by the total number of recipient encounters (ie, visits) occurring in that month
Comparisons were made between the intervention group and the control group using these 3 variables.
Statistical Analysis
Regression analyses were chosen as the best means to address the research questions, which looked at trends over time. Also,t tests were used to compare group means. Three individual regres-sion models were built for the 3 dependent variables described above. Each model explains 1 dimension of the cost-utilization analysis. By integrating the results from these statistical analyses, a comprehensive analysis of the cost utilization was obtained for ED claims and the overall cost data to address the following research questions:
1. Are there any savings with regard to variable PMPM in the intervention group as compared with the concurrent control group over a defined period?
2. If there are savings demonstrated in the intervention group as compared with the concurrent control group with regard to PMPM, then are the savings a result of fewer encounters/visits (judged by variable 1000*PMPE) or from a lower cost per encounter (judged by variable Penctr)?
3. Are there any trends detected over time in either the interven-tion group or the control group for any of the 3 dependent variables mentioned above?
RESULTS
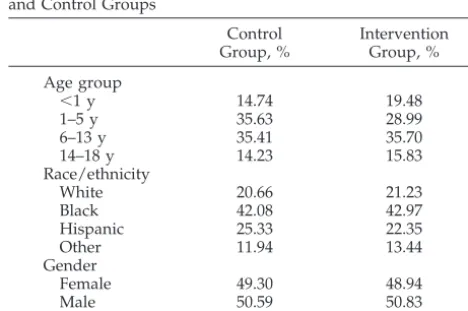
There were 17 382 children enrolled in the inter-vention program during the study period, and 26 066 children were included in the control group. The age, race/ethnicity, and gender distribution of the 2 groups were similar (Table 1). The2statistic was not used to compare the groups because given the large sample size, any small difference would be detected as statistically significant even if it was not practi-cally significant.
ED Regression Models
PMPM Model
No trends were detected over the period of the study in either the intervention or the control group when the PMPM variable was considered. A t test revealed that there was a statistically significant dif-ference in ED costs between the intervention and control groups during the study period (P⫽ .0298).
TABLE 1. Demographic Variable Comparison: Intervention and Control Groups
Control Group, %
Intervention Group, %
Age group
⬍1 y 14.74 19.48
1–5 y 35.63 28.99
6–13 y 35.41 35.70
14–18 y 14.23 15.83
Race/ethnicity
White 20.66 21.23
Black 42.08 42.97
Hispanic 25.33 22.35
Other 11.94 13.44
Gender
Female 49.30 48.94
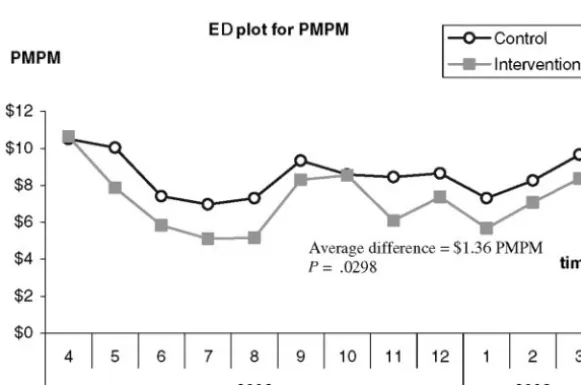
Figure 1 illustrates the monthly per member costs from April 2002 to March 2003. In the intervention group, ED costs were lowered by an average of $1.36 PMPM compared with the control group. An aver-age PMPM cost of $8.53 was found in the control group, whereas the intervention group had an aver-age PMPM cost of $7.17. This represents a compara-tive savings of 16%, as illustrated in Fig 1. This difference was sustained consistently throughout the 12 months of analysis.
PMPE ED Visits Model
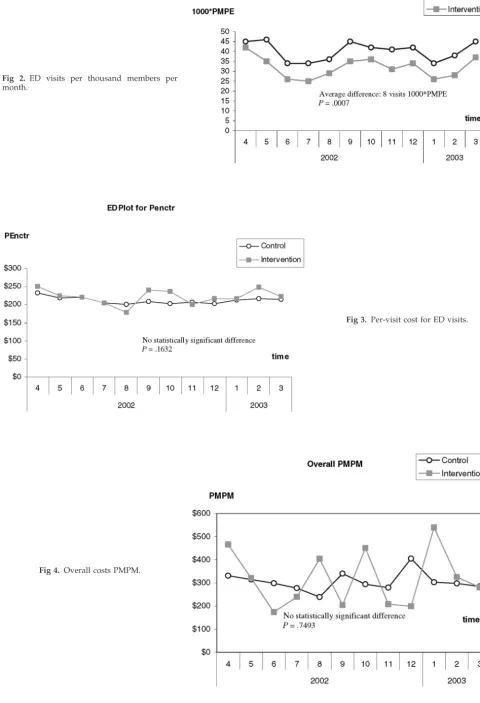
No trends were detected over the period of the study in either the intervention or the control group when the 1000*PMPE variable was considered. In terms of frequency of ED visits, there was a signifi-cant difference between the intervention and the con-trol group during the study period (P⫽ .0007). Fig-ure 2 illustrates the number of visits to the ED per month for each 1000 members. On average, the in-tervention group had 8.09 fewer ED visits per thou-sand members per month. Given that the average number of visits per thousand members per month in the control group was 40, this represents a 20% reduction in ED utilization for the intervention group when compared with the control group.
Penctr Model
No trends were detected over the period of the study in either the intervention or the control group when the Penctr was considered. Attest revealed no difference in the cost of individual ED visits between the intervention and control groups. Figure 3 illus-trates the monthly per visit cost for the 2 study groups during the study period.
Overall Cost PMPM Model
It is interesting to note that the overall cost, which includes inpatient/outpatient claims, pharmacy, and medical claims for the intervention group, were not significantly different from those of the control group, as evaluated by the PMPM variable (Fig 4). Possible reasons for this condition are discussed in the next section.
DISCUSSION
The PMPM cost for both the intervention group and the control group remained relatively constant over the 12-month period of this project (April 1, 2002, to March 31, 2003). There was no discernible trend of increasing or decreasing PMPM cost in ei-ther group.
However, when the intervention and the control group were compared, the intervention group, when averaged over the 12-month period, showed ED costs that were $1.36 lower PMPM than those of the control group. The pattern of cost fluctuation was parallel between the 2 groups throughout most of the study period.
When the intervention and control groups were compared over the period of this project, there was no significant difference in terms of ED per-visit cost (P⫽.1632, not significant). Therefore, it follows that the average saving ($1.36 PMPM) of the intervention group is related to a reduction in the number of ED visits, not from a decrease in ED per visit cost. Over the 12-month period, the intervention group had 8 fewer ED visits on average each month per thousand members than the control group, and this pattern held consistently over the study period.
This study found a decreased use of EDs among children who were enrolled in an ED diversion pro-gram, compared with their peers in other Medicaid programs in the same area. These results support the use of innovative programs to reduce Medicaid costs, which have risen out of control in many states. However, in interpreting these findings, the reader must consider certain caveats. First, it is important to consider the results only from a cost and utilization analysis as this study does not consider health care quality. For example, this study does not address issues of urgent versus nonurgent use of the ED. Quality indicators are part of a larger analysis and not part of the findings presented here. The authors are extremely aware that it is in no one’s best interest to reduce service utilization and cost if service qual-ity and, most important, patient services are not im-proved or at least maintained.
Fig 2. ED visits per thousand members per month.
Fig 3. Per-visit cost for ED visits.
Second, the cost decrease found between the inter-vention and control groups was $1.36 PMPM. Al-though this is a statistically significant difference that represents a comparative savings of 16%, longer term monitoring is needed to determine whether this sav-ings is sustained over time and whether it is of practical and meaningful significance to the system. In other words, longer term monitoring might deter-mine whether the costs are increased in another com-ponent of Medicaid expenditures.
Finally, this study included only relatively healthy children who were eligible for Medicaid. Children with special health care and mental health needs, classified as “SSI” (Supplemental Security Income) in the AHCA database, were excluded from the analy-sis presented here. These children have different needs that may require different interventions. All subgroups of children must be studied and a specific intervention design must be used for each, as part of a sound policy for Medicaid cost containment that does not sacrifice service accessibility, quality, and outcomes.
The usefulness of these results is promising for the development of strategies to reduce ED costs among healthy children, but there are also some outstanding questions that require additional study. For example, month-to-month fluctuation was noted in Fig 4, graphing overall costs for the intervention group. However, this fluctuation was found to be within a random fluctuation range, and no trend was detected for this year alone. However, if ongoing research found similar patterns over multiple study years, then a trend might be found in need of additional investigation. Also, it is not clear why the overall costs were not reduced. One explanation is that the savings in ED cost is obscured by the relatively large cost fluctuation of other expenditures, such as inpa-tient costs and medical costs. For the intervention group, the mean PMPM cost for the ED is $7.17, whereas the mean PMPM cost for the overall cost is $317.66, ⬃44 times that of the ED. Thus, the small savings in ED cost could easily be lost when a com-parison is made of the much higher overall cost.
CONCLUSION
This study demonstrates that in the first year of this pediatric diversion project, although cost savings and fewer visits were demonstrated in the ED of the intervention group, no overall cost savings was evi-dent. It is unclear whether the cost savings were absorbed by increased pharmaceutical costs, medical costs, or other preventive costs. However, it is im-portant to note that these results focus only on the first year of the project, and it is possible that, over time, a different cost utilization pattern would emerge. Despite the limitations of this study and the additional questions outlined in this discussion, we are confident that the findings presented here add to the growing body of knowledge that will be used to assess the potential effectiveness and benefits of ED diversion as a means of containing soaring Medicaid costs while promoting better health care through
expanded use of primary health care professionals and facilities.
REFERENCES
1. Weiner M. State initiatives to control Medicaid drug costs.N Engl J Med. 2004;350:1912
2. Wheeler L. States want control over Medicaid costs. Gannett News Service.February 8, 2002
3. Kaiser Commission for Medicaid and the Uninsured, Kaiser Family Foundation.State Fiscal Conditions and Medicaid;2004. Available at: www.kff.org/medicaid/4087-03.cfm. Accessed December 12, 2004 4. Smith V, Gifford K, Ramesh R.Medicaid Spending Growth: A 50 State
Update for FY 2003. Washington, DC: Kaiser Commission on Medicaid and the Uninsured; 2003:4082
5. Holahan J, Wiener JM, Bovbjerg RR, Ormond BA, Zuckerman S.The State Fiscal Crisis and Medicaid: Will Health Programs Be Major Budget Targets? Overview. Washington, DC: Kaiser Commission on Medicaid and the Uninsured; 2003:4073
6. Cunningham P, Clancy C, Cohen J, Wilets M. The use of hospital emergency departments for nonurgent health problems: a national per-spective.Med Care Res Rev.1995;52:453– 474
7. Brousseau DC, Dansereau LM, Linakis JG, Leddy T, Vivier PM. Pedi-atric emergency department utilization within a statewide medicaid managed care system.Acad Emerg Med.2002;9:296 –299
8. Newacheck PW, Halfon N. Preventive care use by school-aged children: differences by socioeconomic status.Pediatrics.1988;82:462– 468 9. Weissman JS, Gatsonis C, Epstein AM. Rates of avoidable
hospitaliza-tion by insurance status in Massachusetts and Maryland.JAMA.1992; 268:2388 –2394
10. Tyrance PH Jr, Himmelstein DU, Woolhandler S. US emergency depart-ment costs: no emergency.Am J Public Health.1996;86:1527–1531 11. CBS Washington, Medicaid May Restrict Emergency Care; 2003.
Avail-able at: www.cbsnews.com/stories/2003/01/17/national/main536916. shtml
12. Pear R. Bush rescinds health policy on Medicaid emergency care.New York Times.January 23, 2003
13. Gadomski AM, Perkis V, Horton L Cross S, Stanton B. Diverting man-aged care patients from pediatric emergency department use.Pediatrics. 1995;95:170 –178
14. Hurley RE, Freund DA, Taylor ED. Emergency room use and primary care case management: evidence from four Medicaid demonstration programs.Am J Public Health.1989;79:843– 846
15. Sisk JE, Gorman SA, Resinger AL, Glied SA, DuMouchel WH, Hynes MM. Evaluation of Medicaid managed care: satisfaction, access and use. JAMA.1996;276:50 –55
16. Grossman LK, Rich LN, Johnson C. Decreasing nonurgent emergency department utilization by Medicaid children.Pediatrics.1998;102:20 –24 17. Christakis DA, Mell L, Koepsell TD, Zimmerman FJ, Connell FA. As-sociation of lower continuity of care with greater risk of emergency department use and hospitalization in children.Pediatrics.2001;103: 524 –529
18. Christakis DA, Wright JA, Koepsell TD, Emerson S, Connell FA. Is greater continuity of care associated with less emergency department utilization?Pediatrics.1999;103:738 –742
19. Brousseau DC, Meurer JR, Isenberg ML, Kuhn EM, Gorelick MH. As-sociation between infant continuity of care and pediatric emergency department utilization.Pediatrics.2004;113:738 –741
20. Gadomski AM, Jenkins P, Nichols M. Impact of a Medicaid primary care provider and preventive care on pediatric hospitalization. Pediat-rics.1998;101(3). Available at: www.pediatrics.org/cgi/content/full/ 101/3/e1
21. Brousseau DC, Bergholte J, Gorelick MH. The effect of prior interactions with the primary care provider on nonurgent pediatric emergency department use.Arch Pediatr Adolesc Med.2004;158:78 – 82
22. Johnson WG, Rimsza ME. The effects of access to pediatric care and insurance coverage on emergency department utilization. Pediatrics. 2004;113:483– 487
23. UCLA News. UCLA study shows Medicaid costs can shrink signifi-cantly when Head Start parents are trained to handle kids’ common ailments; 2004. Available at: newsroom.ucla.edu/page.asp?RelNum⫽
5110. Accessed April 15, 2004
DOI: 10.1542/peds.2004-2093
2005;116;1075
Pediatrics
Cheng Wang, Maria Elena Villar, Deborah A. Mulligan and Toran Hansen
Project
Cost and Utilization Analysis of a Pediatric Emergency Department Diversion
Services
Updated Information &
http://pediatrics.aappublications.org/content/116/5/1075
including high resolution figures, can be found at:
References
http://pediatrics.aappublications.org/content/116/5/1075#BIBL
This article cites 16 articles, 6 of which you can access for free at:
Subspecialty Collections
_management_sub
http://www.aappublications.org/cgi/collection/administration:practice
Administration/Practice Management following collection(s):
This article, along with others on similar topics, appears in the
Permissions & Licensing
http://www.aappublications.org/site/misc/Permissions.xhtml
in its entirety can be found online at:
Information about reproducing this article in parts (figures, tables) or
Reprints
http://www.aappublications.org/site/misc/reprints.xhtml
DOI: 10.1542/peds.2004-2093
2005;116;1075
Pediatrics
Cheng Wang, Maria Elena Villar, Deborah A. Mulligan and Toran Hansen
Project
Cost and Utilization Analysis of a Pediatric Emergency Department Diversion
http://pediatrics.aappublications.org/content/116/5/1075
located on the World Wide Web at:
The online version of this article, along with updated information and services, is
by the American Academy of Pediatrics. All rights reserved. Print ISSN: 1073-0397.