A Performance Model for Network-on-Chip
Wormhole Routers
Youhui Zhang
Department of Computer Science and Technology, Tsinghua University, Beijng, 100084, China Email:[email protected]
Xiaoguo Dong and Siqing Gan
Department of Mathematical Science and Computing Technology, Central South University, Changsha, 410075, China
Weimin Zheng
Department of Computer Science and Technology, Tsinghua University, Beijng, 100084, China
Abstract—A generic analytical performance model of single-channel wormhole routers is presented using the M/D/1/B queuing theory. Compared with previous work, the flow-control feedback mechanism is studied in detail, and a computing method bases on Markov chain for the flow-control feedback probability is proposed. Compared with BookSim, a well-known cycle-accurate Network-on-Chip (NoC) simulator, this model presents accurate results on key metrics: the average relative error of flow-control feedback probability is about 7.87%. In addition, based on the model of single-channel routers, the asymmetric multi-channel and symmetric multi-channel structured routers are both modeled respectively.
Index Terms—Network-on-Chip; Markov chain; queuing theory; performance analysis
I. INTRODUCTION
Networks-on-Chip (NoC) [1][2] has been proposed as a solution for addressing the design challenges of high performance nano-scale architectures by separating the on-chip communication from computing and storage. Connecting components through an on-chip network has several advantages over dedicated wiring, potentially delivering high-bandwidth, low-latency, and low-power communication over a flexible, modular medium.
Wormhole-routing [3][4] is a system of simple flow control in NoC based on fixed links, which makes message latency almost independent of the inter-node distance in the absence of blocking. In wormhole routing, network packets are broken into small pieces called flits. The first flit, called the header flit holds information about this packet's route (namely the destination address) and sets up the routing behavior for all subsequent flits associated with the packet. The head flit is followed by zero or more body flits, containing the actual pay load of data. The final flit, called the tail flit, performs some bookkeeping to close the connection between the two
nodes. If the header is blocked, the data flits are blocked behind it occupying all the channels and buffers already taken [3].
Moreover, the routing algorithm defines how to transfer a message through a network path. A key issue for any routing algorithm is deadlock-free. Now deterministic routing for deadlock prevention is widely employed [3].
Currently, many NoC designs are based on the simulation method. However, simulation is a time-consuming procedure, especially within the large design space. Therefore, system designers have to choose limited assessment in the design space and then cannot get the optimized results usually.
Another approach is utilization of an analytical model of the system which is the most cost-effective tool for performance evaluation. Several analytical models of deterministic routing in wormhole-routed mesh-based networks, e.g. hypercube and tori, have been reported.
Ref.[5] introduces a probability model for wormhole network. Ref.[6] is restricted to the k-ary n-cubes topology while [7] is only adapted by the hypercube. Ref.[8] presents a performance model based on some queuing theory, but it only can apply to the switched network. Ref.[9] presents an analytical performance evaluation method for the general wormhole-routing NoC architectures. It analyses different reasons for blocking network packets in the router buffer, but does not consider the flow-control feedback mechanism, which is caused by the fullness of the input queue of the successive router. Ref.[10], based on the same assumptions of [9], provides a novel method: the numerical analysis and iterative computation is used to estimate the NoC performance.
Moreover, several models for adaptive wormhole routing have been introduced for the torus and hypercube [11][12][13].
This paper presents a generic analytical performance evaluation approach of NoC design. Different from the previous work, the flow-control feedback probability between adjacent routers is considered meticulously, which is the important indicator of the buffer utilization Supported by Chinese National Science Foundation under Grant
and network traffic. And how to extend the single-channel model to the model for multi-single-channel routers is also presented.
In summary, this paper gives the following contributions:
1) A general analytical model of wormhole routers with single channel is proposed, which supports arbitrary network topologies, the deterministic routing algorithm, arbitrary packet / buffer lengths, and so on.
Based on the router model, the computing method of flow-control feedback probability using the Markov chain is presented in detail.
2) Based on the performance model of the single-channel router, the asymmetric multi-single-channel and symmetric multi-channel structured routers are both modeled respectively. Multi-channel structures can improve the communication performance significantly.
3) The accuracy of this approach is validated through the comparisons with a well-known cycle-accurate simulator, BookSim [14].
The remaining of this paper is organized as follows. Section 2 introduces the related work on performance modeling. Section 3 gives our modeling assumptions. The model for single channel routers is presented in the next section and the multi-channel versions are presented in Section 5. Experimental results are given in Section 6; the conclusion and future work are introduced at last.
II.RELATED WORK
Ref. [5] develops a model of a single wormhole router, which is based on the probability analysis rather than queuing theory. The model is evaluated through a series of flit-level simulations. Moreover, how to extend the model to networks of routers is also discussed.
Ref. [6] analyzes communication networks of varying dimension under the assumption of constant wire bisection. Models of the latency, average throughput, and hot-spot throughput of k-ary n-cube networks are presented.
Ref. [7] proposes a general analytical model to predict message latency in wormhole-routed k-ary n-cubes with fully adaptive routing. The analysis focuses on a widely-accepted fully adaptive routing algorithm.
A system-level buffer planning algorithm is given in [8]. Using this algorithm, the buffer depth for each input channel in different routers across the chip can be derived to optimize the overall performance, given the traffic characteristics of the target application and the total budget of the available buffering space.
Ref. [9] presents a generalized router model and then utilizes this model for doing NoC performance analysis. The proposed model can be used not only to obtain fast and accurate performance estimates, but also to guide the NoC design process within an optimization loop.
Ref. [10] also presents a generic analytical method to estimate communication latencies and link-buffer utilizations for a given NoC architecture. The accuracy of this method is experimentally compared with the results obtained from Cycle-Accurate SystemC simulations. It is based on the same assumptions of [9], providing a novel
method: the numerical analysis and iterative computation is used to estimate the NoC performance.
III. ASSUMPTIONS OF ROUTER MODELING
A. NoC Router
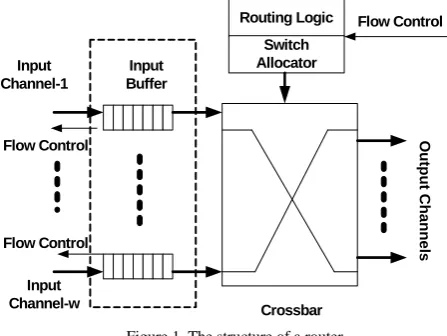
An illustration of the router structure is presented in Fig.1.
Figure 1. The structure of a router
We assume that a wormhole router contains w ports and adopts a deterministic routing algorithm (like X-Y routing). The local port is regarded as the same as others; each port is associated with a single input buffer (single channel; how to model the multi-channel structure is discussed in Section V). Input buffers are abstracted as groups of FIFO.
The crossbar switch can be configured to connect any input buffer of the router to any output channel, but under the constraints that each input is connected to at most one output, and each output is connected to at most one input. The tasks of resolving all the potential requests to the crossbar and other shared resources of the router fall onto the switch allocator.
Before transfer, data packets are divided into small pieces, called flits. The header flit holds destination information to set up the transfer channel for all subsequent flits of the same packet.
The router also implements flit-level flow control: the
TABLE I. PARAMETERS OF THE MODEL
Symbol Description
w Number of ports of a router B Length of the input buffer
T Service time of a packet, which does not include the waiting time in the queue
P Packet size (in flit)
s
H
Service time of the header flit, or the time of the header flit going through the router (without the waiting time). It is also the number of pipeline stages of a router because of Assumption 4.
(i, j) Port j (0 jw) at Router i.
Outp
ut
C
h
a
n
ne
ls
Crossbar Routing Logic
Switch Allocator Input
Buffer Input
Channel-1
Input Channel-w
Flow Control
Flow Control
input queue capacity is limited, so if any input queue of a router is full, its upstream router will stop transmitting. In the previous work, flow-control feedback is less involved or even ignored.
For the detailed workflow of a wormhole router, please refer to [15].
B. Modeling Parameters
As in [9][10], the router model introduces the following hypotheses.
1) Network traffic is generated from all nodes uniformly and follows the Poisson process, which implies that packet-arrival events occur continuously and independently of one another.
2) Packet destinations are equally distributed across the network nodes following a uniform traffic pattern.
3) Traffic sinks consume the incoming packets with the constant rate of one flit per cycle.
4) A pipeline stage of a router can deal with one flit per cycle, too.
5) Input buffers of any router have finite capacity. 6) When the system achieves asymptotic stability, the service time of packets is approximately equal to a constant value.
Some parameters of the model are listed in Table 1. Then, we have (1) because of Assumption 4.
T HsP (1)
IV. ANALYTICAL MODEL OF SINGLE-CHANNEL
ROUTERS
A. Analysis of waiting time in the input queue
This section focuses on modeling a single-channel router as a set of first-come first-serve buffers connected by a crossbar switch to analyze the average waiting time that an incoming packet spends in the queue.
j i
T
, denotes the average time in the queue of (i, j ). It is composed of the following three parts as described in [9]:1) Service time of the packets already waiting in the same buffer;
2) The residual service time seen by an incoming
packet;
3) The packets waiting in other buffers of the same router and served before the incoming packet.
As stated in [9], the traffic rate at (i, j),
i,j, can be computed by (2).
s dd s j
i,
x
,R
(
s
,
d
,
i
,
j
)
(2)Here
x
s,d represents the traffic rate from source router s to the destination d, and
s,d indicates the path from sto d. R is the indicator function that returns 1 if the path goes through (i, j), and returns 0 otherwise.
,
,
1, ( , )
( , , , )
0, ( , )
s d s di j
R s d i j
i j
(3)I. The first part
Suppose the average number of packets in the input buffers of router
i
is a vector, N.
N
N N
1,
2,...,
N
w
T. (4)Then, the average number of packets waiting in port j is
N
j . And the average waiting time for incoming packet isE
(
T
)
N
j, whereE
(
T
)
indicates the meanof service time. II. The second part
If incoming packet
p
m arrives at the top of the inputqueue while some other packet
p
nis being serviced, thenthe residual service time
R
m forp
m is the time left forthe packet
p
n to finish its service.To simplify the analysis, the concept of mean residual service time
R
(
i,j)
is used. It is the average value of service time for all packets, as well as a function of the traffic rate and service time. When the system reaches the asymptotic steady-state, the following equation represents its value:)
(
2
1
)
(
, ,E
T
2R
i j
i j
. (5) whereE
(
T
2)
is the second moment of service time. III. The third partIn [9][10], both Part 1 and 2 have been analyzed completely. But for Part 3, they do not consider the flow-control feedback. Therefore, we focus on this issue.
In detail, when a head flit intends to go to the specific output port, it has to compete with all other flits applying for the same direction. Moreover, another necessary condition for any winner to continue is that the input queue of the downstream router is not full, which is called the flow-control feedback.
Then, a packet transmitted from (i,j) to )
, 1
(i k consists of two processes: competition and flow-control.
Suppose Fi,j,k is the probability of the header flit
transmitted from (i,j)to (i1,k) , and
p
i1,k is the flow-control feedback probability produced from) , 1
(i k and fi,j,kis the competition probability of the header flit. Then we have:
) 1
( 1,
, , ,
,jk i jk i k
i f p
F . (6)
k j i, ,
is the traffic rate from (i, j)to (i1,k) and we get
w
l k l i
k j i k j i
f
1 , , , , , ,
. (7)
q j i
We haveci,j,q= 1 if j=q.
If 1 j,q pand
j
q
, we can get2 , 1 , , 1 , , , , 1 , , ,
, iqk(1 i k)
w k k j i k q i w k k j i q j
i F F f f p
c
(8)Therefore, the blocking delay caused by packet competitions and flow controls can be denoted by (9).
w j q q q q j i N c T E , 1 , , ) ( =
w j q q q k i k q i w k k ji f p N
f T E , 1 2 , 1 , , 1 ,
, (1 )
)
( . (9)
Summing up the three parts, we obtain the average waiting time of an incoming packet buffered in (i, j).
j i
T, =
(
)
2
1
)
(
T
N
,E
T
2E
j
i j
w j q q q k i k q i w k k ji
f
p
N
f
T
E
, 1 2 , 1 , , 1 ,,
(
1
)
)
(
(10)To calculate
T
i j, , it is necessary to computer the flow-control feedback probability,p
i1,k.
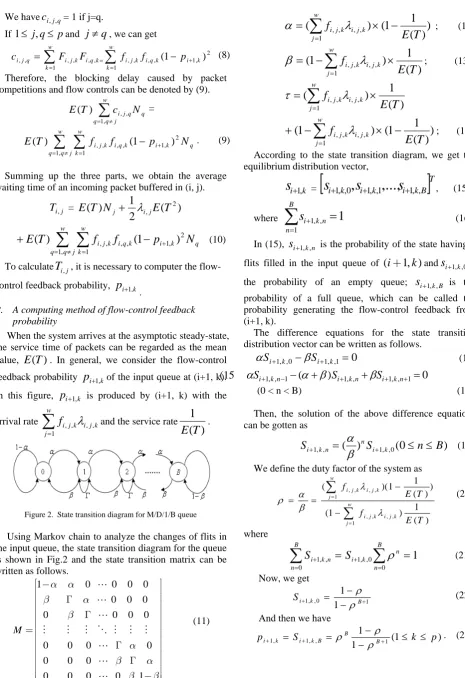
B. A computing method of flow-control feedback probability
When the system arrives at the asymptotic steady-state, the service time of packets can be regarded as the mean value,
E
(
T
)
. In general, we consider the flow-control feedback probabilityp
i1,kof the input queue at (i+1, k).In this figure,
p
i1,k is produced by (i+1, k) with thearrival rate i jk
w j
k j i
f
, , 1, ,
and the service rate
)
(
1
T
E
.Figure 2. State transition diagram for M/D/1/B queue
Using Markov chain to analyze the changes of flits in the input queue, the state transition diagram for the queue is shown in Fig.2 and the state transition matrix can be written as follows.
1 0 0 0 0
0 0 0
0 0 0 0
0 0 0 0
0 0 0
0 0 0 0 1
M a a b a b a b a b b é - ù ê ú
ê G ú
ê ú
ê G ú
ê ú
ê ú
= ê ú
ê G ú
ê ú
ê G ú
ê ú ê ú -ê ú ë û (11) where
)
)
(
1
1
(
)
(
, , 1 , ,T
E
f
i jkw j
k j
i
; (12))
(
1
)
1
(
, , 1 , ,T
E
f
i jk w j k j i
; (13))
(
1
)
(
, , 1 , ,T
E
f
i jk w j k j i
)
)
(
1
1
(
)
1
(
, , 1 , ,T
E
f
i jkw j
k j
i
; (14)According to the state transition diagram, we get the equilibrium distribution vector,
k i
s
1, =
T B k i k i k
i
s
s
s
1, ,0,
1, ,1,...,
1, , , (15)where
1
1 , , 1
B n n k is
(16)In (15),
s
i1,k,n is the probability of the state having n flits filled in the input queue of(
i
+
1, )
k
ands
i1,k,0is the probability of an empty queue;s
i1,k,B is the probability of a full queue, which can be called the probability generating the flow-control feedback from (i+1, k).The difference equations for the state transition distribution vector can be written as follows.
0
1 , , 1 0 , ,1
k i k
i
S
S
(17) (15
S
i1,k,n1
(
)
S
i1,k,n
S
i1,k,n1
0
(0 < n < B) (18)
Then, the solution of the above difference equations can be gotten as
)
0
(
)
(
1, ,0, ,
1
S
n
B
S
n i k nk
i
(19)
We define the duty factor of the system as
) ( 1 ) 1 ( ) ) ( 1 1 )( ( , , 1 , , , , 1 , , T E f T E f k j i w j k j i k j i w j k j i
(20)
where
B n n k i B n n k iS
S
0 0 , , 1 0 , ,1
1
(21)Now, we get 1 0 , , 1 1 1 B k i S
(22)
And then we have
) 1 ( 1 1 1 , , 1 ,
1 S k p
pi k i k B B B
V. ANALYTICAL MODEL FOR MULTI-CHANNEL STRUCTURES
As the increase of network traffic, the waiting time of packets in the input queue of single-channel routers increases, which results in longer transmission delay. To solve this problem, there are two ways: reduce the packet arrival rate and improve the service rate. At present, NoC routers usually adapt multi-channel architecture to achieve the two functions.
Ref. [16] has classified multi-channel routers into two categories: the asymmetric multi-channel and symmetric multi-channel structures. Both are modeled based on our above-mentioned work. In [16], the flow-control feedback possibility is computed based on the M/G/1 queue theory, while we calculate the possibility based on the M/D/1/B queue theory and the Markov chain. A. Two typical multi-channel NoC routers
(a) asymmetric multi-channel structure
(b) asymmetric multi-channel structure Figure 3. Multi-channel structure NoC rouetrs
Fig.3(a) shows the asymmetric multi-channel structure: each input port is associated with p channels which match different output ports respectively; in another word, each channel matches only one output port and different channels match different output ports respectively. Flits select output direction according to their own routing information. Then the traffic is divided into different channel queues for transmission, thus the arrival rate for each buffer is reduced and the service rate is also improved.
Fig.3(b) shows the symmetric multi-channel structure: each input port is also associated with p channels, and each has the same function. The incoming packet select virtual channel with the same probability 1/p. Different from the asymmetric, here each channel can match any one of output ports.
In the symmetric structure, the traffic is divided into several groups with same probability, and then each channel send the transmission request to the corresponding output port. If the current packet fails in the competition and is being blocked, the subsequent packets to the same output port can enter the other channels for transmission. The structure can also reduce the arrive rate and improve the service rate.
B. Analytical model for multi-channel structure
I. Analytical model for asymmetric multi-channel structure
Figure 4. Arbitration model of asymmetric multi-channel structure
Assuming each input port of an asymmetric multi-channel router is associated with p channels. For example, for the 2D-mesh topology, each input port has five channels and each is connected to one of the five different output directions; the traffic transmission is illustrated in Fig.4. In this structure, the flits in the queue only compete with the flits with the same transfer direction from other input ports. For example, the flits in channel
1 , 2
V
only compete with the flits from channel1 , 1
V
,1 , 3
V
,V
4,1, andV
5,1. Different from the single-channelstructure, the flow-control occurs only if all five channels of the corresponding downstream router are fulfilled.
, , , i j k k
l
represents the traffic rate from the channel k (1
£ £
k
p
) of (i, j), which can be computed by (24)., , , ,
( , , , , )
( , , , )
i j k k s ds d
x
R s d i j k
S s d k k
l
" "
=
åå
´
´
(24)
if and only if the flits in the channel k will be sent to output port k, otherwise it returns 0. Because the flits in each input channel k can only be sent to theoutput port k, we have
S s d k k
( , , , )
=
1
.The analysis of waiting time in the input queue k of (i, j) also includes three parts. The first and the second parts are similar with the single-channel structure. We focus on the third.
Suppose
F
i j k k, , , is the probability of the header flit transmitted from the channel k in (i,j) to (i1,k),
k i
p
1, is the flow-control feedback probability produced from (i1,k)andf
i j k k, , , is the competition probability of the header flit. We have, , , , , ,
(1
1,)
p i j k k i j k k i kF
=
f
´ -
p
+(25)
, , , , , ,
, , , 1 i j k k
p i j k k
i j l k l
f
l
l
=
=
å
(26)
, , , i j q k
c
denotes the competition probability of the header flits in the channel k of (i, j) and (i, q) transmitting to the same input port of router (i+1).We have
c
i j q k, , , = 1 if j=q.If 1 j,q pand
j
q
, we can get, , , , , , , , ,
2 , , , , , , 1,
1
(
)
(1
)
(1
,
;
)
i j q k i j k k i q k k
p i j k k i q k k i k
c
F
F
j
q
f
f
p
+j q
p j
p
=
⋅
ì
=
ïï
=í
ï
-
£
£
¹
ïî
(27) Therefore, the blocking delay caused by packet competitions and flow controls happened in the two channels of (i, j) and (i, q) can be denoted by (28).
, , , , 1,
2 , , , , , , 1, , 1,
( )
( )
(1
)
p
i j q k q k q q j
p
p
i j k k i q k k i k q k q q j
E T
c
N
E T
f
f
p
N
= ¹
+ = ¹
=
-å
å
(28) Summing up the three parts, the average waiting time of an incoming packet buffered in channel k of (i, j) is:
2
, , , , ,
2 , , , , , , 1, , 1,
1
( ) ( )
2
( ) (1 )
i j k j k i j k
p
p i j k k i q k k i k q k q q j
E T N E T
E T f f p N
t l
+ = ¹
= +
+
å
(29) where
N
q k,(1
£
q k
,
£
p
)
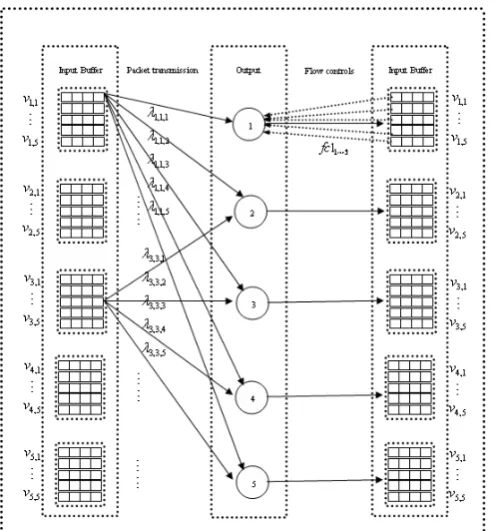
stands for the average number of flits in the channel k of (i, q).II. Analytical model for symmetric multi-channel structure
Routers can also adopt symmetric multi-channel structure. Each input port is associated with p channels. The incoming packet selects any virtual channel with the same probability, 1/p. Still taking the 2D-mesh topology as the example, each input port has five channels, the flits select a virtual channel with the probability of 0.2, and each channel can send flits to arbitrary output port. It means that any output port can receive the flits from all 25 channels.
The traffic transmission is shown in Fig.5. Compared with the asymmetric structure, the transfer principle is the same, but the flow-control probability is different.
Figure 5. Arbitration model of symmetric multi-channel structure
l
i j k h, , , presents the traffic rate from channel k of( , )
i j
to output porth
(1
£ £
h
p
)
, then we have, , , ,
( , , , , ) ( , , , )
i j k h s d
s d
R s d i j k S s d k h
x
p
l
" "
=
åå
´
(30) Here, R is the indicator function owing the same meaning of the asymmetric version. Function S returns 1 if and only if the flits in the channel k will be sent to output port h, otherwise it returns 0.
The analysis of waiting time in the input queue k of (i, j) still includes three parts. The first and second parts are the same with the asymmetric multi-channel structure. We also focus on the third part and we have
, , , , , ,
(1
1,)
p i j k h i j k h i hF
=
f
´ -
p
+(31)
, , , , , ,
, , , 1 1 i j k h
p p i j k h
i j l h j l
f
l
l
= =
=
åå
Here F, f, and p have the same meanings of the asymmetric model.
Similarly,
c
i j q k, , , denotes the competition probability of the header flits in the channel k of (i, j) and (i, q) transmitting to the same input port of Router (i+1).If
j
=
q
, we have2 , , , , , , , , , , , , , , , , 1,
1 1
(1
)
p p
p i j q k n i j k h i q n h i j k h i q n h i h
h h
c
F
F
f
f
p
+= =
=
å
=
å
-(33) If
j
¹
q
, we have2 , , , , , , , , , , , , , , , , 1,
1 1
(1
)
p p
p i j q k m i j k h i q m h i j k h i q m h i h
h h
c
F
F
f
f
p
+= =
=
å
=
å
-(34) Then, the blocking delay caused by packet competitions and flow controls can be denoted by (35):
, , , , , , , , , ,
1, 1 1,
2 , , , , , , 1, ,
1, 1 1
2 , , , , , , 1, , 1, 1
( )(
)
( )
(1
)
( )
(1
)
p p p
i j q k m q m i j j k n j n
q q j m n n k
p p p
p
i j k h i q m h i h q m q q j m h
p p
p
i j k h i j n h i h j n n n k h
E T
c
N
c
N
E T
f
f
p
N
E T
f
f
p
N
= ¹ = = ¹
+
= ¹ = =
+
= ¹ =
+
=
-+
-å -å
å
å åå
å å
(35) And the average waiting time is,
2
, , , , , , , , 1, ,
1, 1 1
2 , , , , , , 1, , 1, 1
2 , , ,
( )
(1
)
( )
(1
)
1
( )
( )
2
p p p
p
i j k i j k h i q m h i h q m q q j m h
p p
p i j k h i j n h i h j n n n k h
j h i j k
E T
f
f
p
N
E T
f
f
p
N
E T N
E T
t
l
+
= ¹ = =
+ = ¹ =
=
-+
-+
+
å åå
å å
(36)
VI.EXPERIMENT RESULTS
A. Test method
A well-known, third-party NoC simulator, BookSim, is used to validate the accuracy of the proposed single-channel model. Originally developed for and introduced by the Principles and Practices of Interconnection Networks book [15]. BookSim’s functionality has been continuously extended. We use BookSim 2.0, which supports a wide range of topologies, provides diverse routing algorithms and includes numerous options for customizing the router’s micro-architecture.
BookSim cannot provide the flow-control feedback probability as a result directly; therefore we employ the following method:
At each simulation cycle, we record the flit number of any input queue; when an input queue is full, the flow control signal is regarded as issued till there is some free space. Then, the probability can be computed.
In this experiment, we adopt the XY deterministic routing and a 5x5 2D-mesh network. The observed results are obtained by simulating
2
10
7cycles after a warm-up phase of2
10
7 cycles, and then compared with analysis results. The performance of our model is analyzed under uniform traffic patterns, where any node transfers packets towards the destinations with equal probability.The injection rate is specified in packets per cycle. For example, the injection rate is 0.25, which means each node injects a new packet every four cycles.
The error between the analytical results
V
test and simulation resultsV
sim is calculated by the following equation.100%
sim testsim
V
V
Err
V
B. Accuracy validation for the computing method of flow-control feedback probability
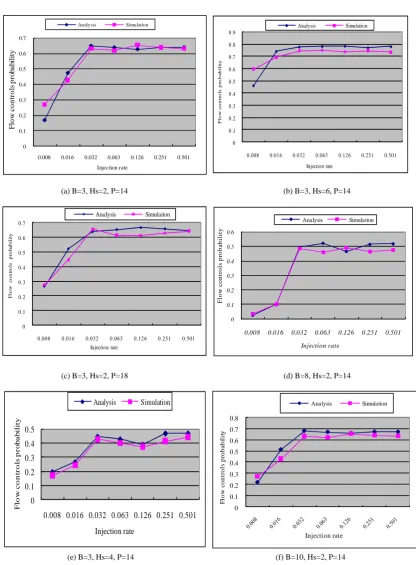
In this section, we focus on the influence of input buffer size (B), number of pipeline stages (Hs ) and packet size (P) on the flow-control feedback probability. Simulation results in Fig.6 reveal that for the different design parameters, the trend of flow-control feedback probability is roughly similar: increasing slowly, increasing rapidly and tends to balance with the increased injection rates.
Our proposed analysis model tallies closely with the simulation results. When the injection rate increases to a certain extent, the traffic rates are much higher and buffers become full frequently. Therefore, the flow-control feedback probability increases significantly. If the rate increases continually, the network will be gradually saturated and lead to the equilibrium of flow-control feedback probability.
In detail, as Fig.6(a) shows, when the injection rate lies between 0.008 and 0.032, the probability changes sharply; as the injection rate continues to increase, the probability remains steady. The analysis results track the simulated closely and the mean error is 8.65%.
Comparing Fig.6(b) with 6(a), we can see that, when the rate is 0.016, the probability reaches steady. The mean error is 7.83%.
With the different packet size, the probability of flow-control feedback slightly changes, but the saturation point and the overall trend are similar, as shown in Fig.6(a) and 3(c). In Fig.6(c), the mean error is 6.22%.
In summary, the computing method achieves a mean error of 7.87%, compared with the cycle-based simulation.
VII. CONCLUSION
A router model for NoC performance analysis is presented, which uses the M/D/1/B queuing theory to analyze various packet blocking-conditions. In addition, considering the effect of flow control to increase the blocking possibilities, a computing method of the flow control probability is proposed.
Experimental results show that the average error of the computing method for flow-control feedback probability is 7.87%.
In addition, we give the extended models for routers with multi-channel structure. Future work will refine the models and give their validation.
ACKNOWLEDGMENT
0 0.1 0.2 0.3 0.4 0.5 0.6 0.7
0.008 0.016 0.032 0.063 0.126 0.251 0.501
F
lo
w
c
o
n
tr
o
ls
p
ro
b
a
b
ili
ty
Injection rate
Analysis Simulation
0 0.1 0.2 0.3 0.4 0.5 0.6 0.7 0.8 0.9
0.008 0.016 0.032 0.063 0.126 0.251 0.501
F
lo
w
c
o
n
tr
o
ls
p
ro
b
a
b
ility
Injection rate
Analysis Simulation
(a) B=3, Hs=2, P=14 (b) B=3, Hs=6, P=14
0 0.1 0.2 0.3 0.4 0.5 0.6 0.7
0.008 0.016 0.032 0.063 0.126 0.251 0.501
F
low
c
o
nt
rol
s
pr
ob
a
bi
li
ty
Injection rate
Analysis Simulation
0 0.1 0.2 0.3 0.4 0.5 0.6
0.008 0.016 0.032 0.063 0.126 0.251 0.501
F
low c
ont
rols pr
oba
bili
ty
Injection rate
Analysis Simulation
(c) B=3, Hs=2, P=18 (d) B=8, Hs=2, P=14
0 0.1 0.2 0.3 0.4 0.5
0.008 0.016 0.032 0.063 0.126 0.251 0.501
F
lo
w
c
o
n
tr
o
ls
p
r
o
b
a
b
ilit
y
Injection rate
Analysis Simulation
0 0.1 0.2 0.3 0.4 0.5 0.6 0.7 0.8
F
low c
ontr
o
ls pr
oba
bi
li
ty
Injection rate
Analysis Simulation
(e) B=3, Hs=4, P=14 (f) B=10, Hs=2, P=14
This research is supported by Chinese National Science Foundation under Grant 60773147, and Chinese National 863 High Technology Programs under Grant 2008AA01A204.
REFERENCES
[1] W. J. Dally and B. Towles, “Route packets, not wires: on-chip interconnection network”, DAC, 2001, pp. 684– 689. [2] M. Sgroi, M. Sheets, A. Mihal, K. Keutzer, S. Malik, J.
Rabaey and A. Sangiovanni-Vincentelli, “Addressing the System-on-a-Chip Interconnect Woes Through Communication-Based Design”, DAC 2001, pp. 667 –672. [3] J. Duato, S. Yalamanchili, L. Ni, “Interconnection
Networks: An Engineering Approach”, Morgan Kaufmann, 2002.
[4] J. Kim, C.R. Das, “Hypercube communication delay with wormhole routing”, IEEE Transactions on Computers C-43 (7) (1994) 806–814.
[5] O. Lysne, “Towards a generic analytical model of wormhole routing networks”, Microprocessors and Microsystems 21(7-8), 1998, 491– 498.
[6] W. J. Dally, “Performance analysis of k-ary n-cube interconnection networks”, IEEE Transactions on Computers, vol. 39, pp. 775-785, 1990.
[7] A. Khonsari, M. Ould-Khaoua and J. Ferguson, “A General Analytical Model of Adaptive Wormhole Routing in k-Ary n-Cube Interconnection Networks”, SIMULATION SERIES, vol. 35, pp. 547-554, 2003.
[8] J. Hu, U.Y. Ogras and R. Marculescu, “System-level buffer allocation for application-specific Networks-on-Chip router design”, IEEE Transactions on Computer-Aided Design of Integrated Circuits and Systems 25(12), 2006, 2919-2933.
[9] Y.U. Ogras and R. Marculescu, “Analytical router modeling for networks-on-chip performance analysis”, In: Proceedings of Design, Automation and Test in Europe Conference (DATE’07), Acropolis, 2007, 1096-1101. [10]S. Foroutan, Y. Thonnart, R. Hersemeule and A. Jerraya,
“An analytic method for evaluating network-on-chip performance”, In: Proceedings of Design, Automation and Test in Europe Conference (DATE’10), Dresden, 2010, 1629-1632.
[11]H. Sarbazi-Azad, M. Ould-Khaoua, L.M. Mackenzie, “An accurate analytical model of adaptive wormhole routing in k-ary n-cube interconnection networks”, Performance Evaluation 43 (2,3) (2001) 165–179.
[12]H. Sarbazi-Azad, M. Ould-Khaoua, L.M. Mackenzie, “On the performance of adaptive wormhole routing in the bi-directional torus network: A hotspot analysis”, Microprocessors and Microsystems 25 (6) (2001) 277–285. [13]H. Sarbazi-Azad, M. Ould-Khaoua, L.M. Mackenzie,
“Analytical modeling of wormhole-routed k-ary n-cubes in the presence of matrix-transpose traffic”, Journal of Parallel and Distributed Computing 63 (2003) 396–409. [14]http://nocs.stanford.edu/cgibin/trac.cgi/wiki/Resources/B
ookSim.
[15]W.J. Dally and B. Towles, “Principles and Practices of Interconnection Networks”, Morgan Kaufmann, San Francisco, 2004.
[16]Ming-che Lai, Lei Gao, Nong Xiao, Zhiying Wang. “An accurate and efficient performance analysis approach based on queuing model for network on chip”. Proceedings of International Conference on Computer Aided Design, pp. 563-570, 2009.
Youhui Zhang received the BSc and PhD degrees in computer science from Tsinghua University, China, in 1998 and 2002 respectively. He is currently an associate professor in the Department of Computer Science at Tsinghua University. His research interests include computer architecture, storage systems and high-performance computing. He is a member of the IEEE and the IEEE Computer Society.
Xiaoguo Dong is a graduate student in the Department of Mathematical Science and Computing Technology, Central South University, China. His research interests include mathematical modeling and analysis.
Siqing Gan is a professor and Chair in the Department of Mathematical Science and Computing Technology, Central South University, China. His research interests include numerical solution of differential equations, and scientific and engineering computing.