Performance Measurement of Service Oriented
Enterprise: An EVA-Based Approach
Weiran Wang, Yushun Fan
Department of Automation, Tsinghua University, Beijing, P.R.China Email: [email protected], [email protected]
Abstract—Service Oriented Enterprise (SOE) has brought up requirement for performance measurement of the novel business model in its dynamic and flexible business environment. To solve the problem, conception of SOE is discussed from business perspective firstly, and an operation architecture of SOE is proposed and analyzed. The Service Oriented Economic Value Added (SO-EVA) performance measurement model is then presented. The model structure of SO-EVA, construction and calculation of indicators, as well as application are given and discussed in this paper. The SO-EVA model is based on the Economic Value Added (EVA) method, extends EVA into multiple levels and introduces Independent Performance Factors (IPF), to focus on value creation and attain comprehensive performance measurement of SOE, with agility and flexibility. A case study is also given, indicating that the presented model not only better reflects the performance of business operation compared to traditional models, but also supports the business model of SOE more effectively.
Index Terms—performnce measurement, service oriented enterprise, operation architecture, economic value added, independent performance factor
I. INTRODUCTION
Your goal is to simulate the usual appearance of papers in a Journal of the Academy Publisher. We are requesting that you follow these guidelines as closely as possible.
The conception of the Service Oriented Enterprise (SOE) roots in applications of Service Oriented Architecture (SOA), service oriented infrastructure (SOI), business process and other areas of applied and theoretical research[1]. The SOE extends beyond the technical scopes[2][3], considers services at business level apart from IT level, and focuses on the new characteristics of strategy, operation and management. SOE offers kinds of benefits, such as improving efficiency, reducing cost and risk, creating flexibility and enabling reuse[4]. While much progress has been achieved in research on SOE from IT perspective, the development and application of SOE is still confronted with some challenges of business perspective. Among the business issues that need to be further researched, performance measurement is an important aspect to study operation and management of SOE, and thus becomes an essential
topic.
Quality of Service (QoS) has been developed and widely used to measure performance of services and to assist in service selection and optimization[5]. However, more attention has been paid to web services than to business services, and there lacks an overall model on business aspect. Traditional measurement models, such as Key Performance Indicators, Balanced Scorecard and Activity Based Costing, are presented from business perspective[6][7], but are process oriented, unadapted for the business mode of SOE and regardless of the conceptions of services, and meet with difficulties when applied in the loosely-coupled, dynamic and flexible environment of SOE. A performance evaluation model for service oriented workflow is presented in [8], but still lacks consideration of business operation in SOE.
The financial analysis method of Economic Value Added (EVA) has become a most talked-about topic[9]. EVA reduces distortions caused in accounting activities and produces more accurate information, and is viewed as a better estimation of a company’s true economic profit compared to traditional performance measurement[10]-[12]. Moreover, as EVA concentrates on creation of value, the adoption and extension of EVA measurement also has the advantage of supporting diversity and flexibility in business operation, and thus offers an approach for performance measurement in SOE. In this paper, the Service Oriented Economic Value Added (SO-EVA) model is presented upon analyzing the operation of SOE, and its applications are discussed. The SO-EVA model extends EVA to multiple levels, converting the financial measurement of EVA into structured business operation measurement, and utilizes Independent Performance Factors (IPF) to form comprehensive evaluation.
The remainder of the paper is organized as below. Section II discusses conception of SOE, presents an operation architecture and analyzes the requirements for performance measurement of SOE. Section III proposes the SO-EVA model, including performance measurement structure, and calculation and construction of EVA indicators and IPFs. Section IV discusses application of SO-EVA. Section V analyzes the case of a trust company to illustrate the approach. Conclusion and future work is provided finally.
A. Definition and Conception
The emerging conceptualizations of the Service-Oriented Enterprise (SOE) are impelled by the complexities, costs and brittleness of current information architectures in enterprises[1]. Although conception of SOE has attracted great research interest in recent years, there is no uniform definition. Ref [13] defines SOE as enterprise that implements and exposes its business processes through an SOA and that provides frameworks for managing its business processes across an SOA landscape. Ref [3] views SOE as an organizational arrangement consisting of service requesters and providers. Ref [2] considers SOEs to be enterprises that are virtual, adaptable, extensible, on demand and web service based. In this paper, we consider SOE as a business model, and an explanative definition of SOE is given from business perspective as below.
Service Oriented Enterprise (SOE) is a novel
business model that operates by providing services, which constructs business units into business components offering various services, cooperates by means of service provision and consumption throughout the value net, manages quality of services by promissory service level agreements, and responds to demands changes rapidly and flexibly, to obtain maximal profits for the enterprise and the value net.
To specify the conception of SOE presented above, some discussion of SOE should be made according to the definition.
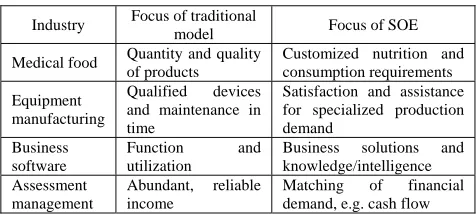
Firstly, SOE is a holistic operation model of enterprise, rather than a single kind of architecture (e.g. IT architecture or organizational structure) supporting it. SOE aims at providing available solutions, to more precisely satisfy customers’ requirements, rather than providing products with certain function alone. This makes an essential difference between SOE and traditional business model. Although it should be noticed that not all enterprises are fit for evolvement to SOE, it should also be appointed that the novel business model should not be restricted to service industries, or even to modern service industries. Some examples of contrasts are given in Table I to illustrate different focuses of the two business models.
Secondly, the way of business operation is different in SOE. SOE develops business capacities into business components, and these business components, rather than the whole enterprise, become the providers of business
TABLE I.
CONTRASTS OF BUSINESS MODEL FOCUSES
Industry Focus of traditional
model Focus of SOE Medical food Quantity and quality
of products
Customized nutrition and consumption requirements Equipment
manufacturing
Qualified devices and maintenance in time
Satisfaction and assistance for specialized production demand
Business software
Function and utilization
Business solutions and knowledge/intelligence Assessment
management
Abundant, reliable income
Matching of financial demand, e.g. cash flow
services. On that basis, business operates by way of and consuming services, and central business factors during operation turn to be services and service oriented business processes. Since cooperation is realized by invoking services across enterprises, achievement, implementation and management of service level agreements in terms of business becomes more important than before. Totally speaking, SOE attains flexibility through dynamic configuration and combination of services, and benefits from rapid response to market demands and changes as well as abilities of providing specialized solutions.
Meanwhile, organization mechanism of SOE has been changed accordingly. Service centers consists of organized supportive business factors such as various kinds of resources and IT applications, and become profit and cost centers instead of traditional departments. Therefore, a series of management adjustments should be made upon that basis.
B. Operation Architecture
An operation architecture of SOE is presented accordingly, as shown in Fig. 1. The hierarchical architecture is made up of six levels.
The strategy level utilizes strategic analysis to determine business strategy and constitution, and to direct overall construction and operation of business.
The service center level consists of three types of service centers, where supportive service centers accomplish supportive functions inside the enterprise, business service centers achieve realization of business operation, and management service centers take charge of management among different service centers. Service centers manage business processes to achieve business tasks, cooperate with each other by way of providing and consuming services, and implement service coordination in terms of service level agreements.
Strategy Level
Human Resource Elementary
Service
Business Process
Level
Business Service
Level Service
Center Level
Support Level
……
Enterprise Infrastructure IT Service Component
IT Service
Level
Service Center
Service Oriented Business Process
Outsourced Service Composite
Service
IT Application Physical
Resource
At the business process level, various business processes are implemented according to demanded logics of business operation, by means of selecting, matching and orchestrating business activities and business services. The services invoked by business processes may be inner ones or outsourced.
The business service level consists of all business services in the enterprise, providing business functions in form of services for internal and external consumers with the support of IT service components and different resources. Business services are organized into different business components according to the functionality divide (omitted in Fig. 1, see the example of Figure 4 for reference). A business service can be an elementary service that realizes certain function independently, or a composite service that implements a business process for realization. The business processes implemented during realization of business services are defined as dependent business processes, while the others directly implemented by service centers are independent business processes.
The IT service level comprises IT service components that are developed independently or inherit from legacy IT systems, and provides services for business services, and provides services such as data transaction, computation, manipulation and reposition for business services.
The support level includes different types of business elements constructing foundational capacities for business operation, including human resources, physical resources, IT applications, and documents and so on.
The enterprise infrastructure constructs environmental foundation for business operation. The enterprise service bus provides environmental support for connection among services. The service coordination and management system harmonizes between different services and service centers, and carries out life-cycle management of them.
It should be noted that an SOE may be a virtual enterprise. In that case, the levels of strategy, services center, IT service and support as well as enterprise infrastructures are distributed, while levels of business process and business service are integrated by means of service bus and service management.
C. Requirements for Performance Measurement of SOE
As discussed above, SOE is a novel business model, and performance measurement is among the main management issues from business perspective. Thus, SOE has raised some requirements for performance measurement, as below.
Match the business model. SOE essentially concentrates on value creation and profit maximization, so performance measurement should also take that as its central concentration, and reflect the abilities and effects of value creation SOE’s during operation. At the same time, since SOE is a holistic business model, the performance measurement should also be able to provide comprehensive evaluation of the overall enterprise.
Fit characteristics of business operation. In SOE, business is operated in a highly dynamic manner, and diversity and flexibility of business is prominent.
Services can be configured to achieve attributive diversity, and the loosely coupled way of business process implementation and service composition leads to structural diversity and business flexibility. Furthermore, as services and business processes can be created during implementation upon demands of (potential) service consumers, the business logic may be constructed at run-time rather than design-run-time, and is much more harder to predict, which makes the business operation more complicated. Therefore, traditional measurement methods are confronted with difficulties of agility when utilized to evaluate performance of SOE, and a more adaptive and flexible model is required.
Support management decisions. The importance of performance measurement partly roots in its utilization to support management decisions of different ranges. Performance management in SOE should meet with the requirement from two aspects. On the one hand, it should be able to be deployed or decomposed along the hierarchical architecture, and covers different management levels of the enterprise. On the other, it needs not only to evaluate the present status of business operation through performance generated during the last period, but also to estimate predictable potentials of business development at the state.
The method of EVA focuses on value created, and is considered to be better reflection of value increment. Apart from that, it can be applied neatly and can be developed in service oriented environment. So the adoption and extension of EVA in SOE offers an approach to solution. Upon that thought, the novel performance measurement model of SO-EVA is proposed in Section III.
III. THE SO-EVAPERFORMANCE MEASUREMENT MODEL A. Economic Value Added
The financial analysis method of Economic Value Added (EVA) is viewed as an effective measure reflecting the value of company and the interest of shareholders[11]. Many researches have shown that EVA better reflects the company’s real economic profit than traditional performance measurement[12]. As a financial index that is appropriate to measure a company’s real value, EVA of an enterprise is defined as:
eva nopat coc nopat tc wacc= − = − × . (1)
Where:
nopat is net operation profit after tax;
coc is cost of capital;
tc is total capital;
wacc is weighted average cost of capital.
for the measurement of economic returns, using a single financial measure that links all decision making with a common goal to improve EVA[9]. Because of the natures above, and the fact that the adoption and extension of EVA measurement has the advantage of supporting diversity and flexibility in business operation, the EVA measurement offers an approach for performance measurement in SOE.
B. Performance Measurement Structure
The Service Oriented Economic Value Added (SO-EVA) model utilizes the idea of EVA to measure business performance in SOE, as its focus on value creation matches the business model of SOE essentially. However, there are several problems to solve to construct neat, comprehensive and management-supportive measurement. Above all, EVA is traditionally a financial method, and lacks consideration of other business terms. Secondly, EVA is mainly used at strategy level, with a relatively long time-lag when applied, and thus is not well prepared to measure operational performance. Finally, EVA reflects bypast performance but doesn’t provide evaluation of business development potentials, so predictive measurement is needed as complement to form an integrated model.
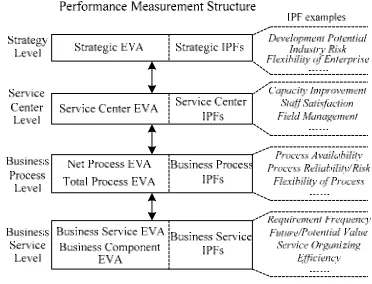
The SO-EVA model solves the problems by extending EVA to multiple levels and introducing predictive performance factors. On the one hand, SO-EVA extends EVA into multiple levels, and in that way, converts the financial measurement of EVA into structured business operation measurement with rapid response. On the other, predictive indicators expressed by Independent Performance Factors (IPFs) are adopted and added into performance measurement to form comprehensive evaluation. The model structure is shown in Fig. 2.
The model is divided into two sub-systems, EVA measurement that reflects operation performance at the time and IPF measurement that reflects performance potential. EVA indicators have advantages over traditional financial ones for the consideration of opportunity costs and occupation of resources, and thus better reflect realistic performance. However, EVA indicators are mainly financial reflection, illustrating more bypast performance than business development and potential. So IPFs, i.e. factors independent of EVA, need to be introduced, to acquire more comprehensive and more effective measurement.
The model contains four different levels, related to corresponding business levels in SOE. Strategic EVA and IPFs are defined at strategy level. Service center EVA and IPFs are used to evaluate service centers. As service centers are cost centers and business partitions in SOE, the indicators are reflecting ones from organization perspective. At process level, together with process IPFs, net process EVA and total process EVA are both utilized, where the former demonstrates value creation of process besides invoked services, measuring performance of process management and service orchestration, and the latter demonstrates value creation of the whole process including invoked services. Business service EVA,
Figure 2. Performance measurement structure of SO-EVA.
business component EVA and business service IPFs are used to measure performance of business services and business components.
By doing so, EVA is introduced into multiple levels of the overall business operation of SOE, and a comprehensive model is formed with the supplementary of IPFs. Calculation of EVA indicators and construction of IPF measurement are central tasks in application of the model, and are to be discussed in the following two subsections.
C. Calculation of EVA Indicators
EVA indicators at different levels can be calculated given the information derived from operation of SOE, as below. The calculations follow the essence of EVA method that value added equals profit minus costs and capital costs.
• Strategic EVA
eva(e), represents the overall value created of an enterprise e.
( ) ( )
eva e =nopat coc e− =nopat tc wacc− × . (2)
The calculation is the same as the definition of EVA, and nopat, coc,tc and wacc are available from financial data and financial analysis.
• Service Center EVA
eva(sc), represents the value created by service center
sc.
( ) ( )
( ) ( )
( )
( ) ( ) ( ) ( )
( ) ( )
( ) ( , )
bp BP sc es ES sc
s OS sc r R sc
ca ca CA sc
eva sc rev sc c sc coc sc
ep bp ps es
ps s c sc r
v wacc
∈ ∈
∈ ∈
∈
= − −
= +
− −
− ×
∑
∑
∑
∑
∑
. (3)
Where:
( ) ( ) ( )
( ) ( ) ( ) ( )
bp BP sc es ES sc s OS sc
rev sc ep bp ps es ps s
∈ ∈ ∈
=
∑
+∑
−∑
acquired upon related contracts and other information;
ES(sc) is the set of elementary services provided by sc;
ps(es) is price of es; OS(sc) is the set of invoked services outside sc; ps(s) is the price of service s determined during operation;
( )
( ) ( , )
r R sc c sc c sc r
∈
=
∑
is the cost of sc; R(sc) is the set of resources belonging to sc, including human resources, physical resources and so on; c(sc,r) is the cost of resource r in sc;( )
( ) ca
ca CA sc
coc sc v wacc ∈
=
∑
× is the capital cost of sc;CA(sc) is the set of capital occupied by sc, the occupied capital may be asset, storage, currency or of other kind;
vca is the value of capital ca at the beginning of the
calculation period. • Net Process EVA
neva(bp), represents the value created by business process bp besides that of invoked services. Assuming bp is provided by service center sc,
( ) ( ) ( ) ( , , ) ( ) ( ) ( ) ( ) ( ) ( ) ( , ) ( , ) ( , , ) / ( ) ca
s S bp r R bp
r R sc
ca bp v t IO
neva bp rev bp c bp coc bp
ep bp ps s cp bp r csc sc r cdp sc bp r
v wacc t t ca
∈ ∈ ∈ ∈ = − − = − − − × − × ×
∑
∑
∑
∑
. (4) Where:ep(bp), ps(s)and R(sc) are of the same meanings as in (3);
( )
( ) ( ) ( )
s S bp rev bp ep bp ps s
∈
= −
∑
is the revenue of bp;( ) ( ) ( )
( ) ( ) ( , ) [ ( , ) ( ,
s S bp r R bp r R sc
c bp ps s cp bp r csc sc r cdp sc
∈ ∈ ∈
=
∑
+∑
+∑
×, )]
bp r is the cost of bp; S(bp) is the set of services invoked by bp; R(bp) is the set of resources used by bp;
cp(bp,r) is the process based cost of resource r in bp, sc is the service center providing bp, csc(sc,r) is the service center based cost of r, and cdp(sc,bp,r) is the cost driver of r from sc to bp (the concepts are illustrated below);
( , , )
( ) / ( )
ca ca bp v t IO
coc bp v wacc t t ca ∈
=
∑
× × is the capitalcost of bp; IO={(bp, vca, t)} is the set of capital
occupation time, (bp, vca, t) means that capital ca, whose
value is vca at the beginning of the calculation, is
occupied by bp for a period of t; t(ca) is the standard occupation time of capital ca during the calculation.
Process based cost and service center based cost are the two kinds of costs in service centers besides purchasing services. The former means cost consumed by a specific process, and the latter means cost consumed by the service center and benefits multiple processes. Cost driver is the multiplier expressing the extent to which a process benefits from a service center based cost item. The two kinds of costs can be derived from operation, and cost drivers can be determined by cost allocation methods[14].
• Total Process EVA
teva(bp), represents the total value created by business process bp.
(
)
(
)
( ) ( ) ( ) ( ) ( ) ( ) ( ) ( ) ( ) ( ) ( , ) ( , ) ( , , ) ( ) ( ) ( )s OS bp
s IS bp r R bp
r R sc
s IS bp teva bp ep bp ps s
c s coc s cp bp r csc sc r cdp sc bp r coc bp
neva bp eva s
∈ ∈ ∈ ∈ ∈ = − − + − − × − = +
∑
∑
∑
∑
∑
. (5)
Where:
IS(bp) is the set of internal services invoked by bp, while OS(bp) is the set of outsourced services invoked by
bp, and IS(bp)UOS(bp)=S(bp);
c(s) is the cost of service s;
coc(s) is the capital cost of service s;
The other expressions are of the same meaning as in (4).
• Business Service EVA
eva(s), represents the value created of service s.
( ) ( ( )),
eva s =neva bp s s CS∈ , (6.1)
( ) ( ) ( , , ) ( ) ( ) ( ) ( ) ( ) ( , ) ( , ) ( , , ) / ( ), ca
r R s
r R sc
ca s v t IO
eva s ps s c s coc s ps s cs s r
csc sc r cds sc s r v wacc t t ca s ES
∈ ∈ ∈ = − − = − − × − × × ∈
∑
∑
∑
. (6.2)
Where:
In (6.1), CS is the set of composite services, and on that occasion, s is a composite service; neva(bp(s)) is the net process EVA of bp, the business process that realizes
s;
In (6.2), ES is the set of elementary services, and on that occasion, s is an elementary service;
( ) ( )
( ) ( , ) ( , ) ( , , )
r R s r R sc
c s cs s r csc sc r cds sc s r
∈ ∈
=
∑
+∑
× isthe cost of s;
( , , )
( ) / ( )
ca ca s v t IO
coc s v wacc t t ca ∈
=
∑
× × is the capitalcost of s;
c(s) and coc(s) are calculated similarly to (4). • Business Component EVA
eva(bc), represents the value created by business component bc, reflecting value creation in a certain function domain of services.
( )
( ) ( )
s S bc eva bc eva s
∈
=
∑
. (7)Where:
S(bc) is the set of services divide into bc;
D. Construction of IPF Measurement
Construction of IPF measurement is also important to performance measurement in SOE. IPFs are predictive indicators, similar to key performance indicators in form, and defined at different levels to cover aspects which cannot be reflected by EVA indicators such as non-financial performance, potential, development and risk. Formal presentation of IPF measurement is proposed as follows:
IPF measurement is defined as MS=(IPF;F,W). Where:
IPF is the set of independent performance factors;
IPF={ipfi(t,l)}, ipfi(t,l) is an IPF with time t and level l, l
∈{ST,SC,BP,BS} corresponding to the four levels of IPFs;
F is the set of function relationship among IPFs;
F={f|ipfn=f(ipf1,ipf2,...,ipfk),(ipfn,ipfi) ∈ IPF × IPF, i=
1…k};
W is the set of correlation between IPFs; W={w(ipfi,
ipfj)| (ipfi, ipfj) ∈IPF×IPF}, w(ipfi, ipfj)∈[0,1] and
k
∑w(ipfi, ipfk)=1.
Considering the signification of IPF, principles below are to be followed when selecting IPF indicators and determining the set of IPF:
1) Prediction and independence from EVA. IPFs should be predictive indicators instead of illustrating realized financial performance of operation. Specially, indicators which are measured in EVA should not be included. In that way, IPFs are independent of EVA indicators.
2) Loosely bound to concrete processes. As IPFs are utilized in the dynamic and flexible environment, they should be connected to types of business processes (if necessary) instead of concrete processes.
3) The “SMART” principle. The principle of specific, measurable, attainable, realistic and time bound in KPI methodology is also appropriate for determination of IPFs in the model.
IPFs can also be organized adopting certain structured methods such as Balanced Scorecard. Some possible IPFs are listed in Fig. 2. After the determination of IPF, the function set F can be given according to the logical relationship among IPFs. For example, “reliability of process means the probability that neither system failure nor process failure happens” is expressed in F as
ipfrp(t,BP)=f(ipfsf, ipfpf)=1-ipfsf(t,BP) -ipfpf(t,BP), where
ipfrp, ipfsf and ipfpf represent reliability of process, system
failure rate and process failure rate. The correlation set W can be achieved upon the methods of AHP (Analytic Hierarchy Process) or ANP (Analytic Network Process), as illustrated in [15].
IV. APPLICATION OF SO-EVA
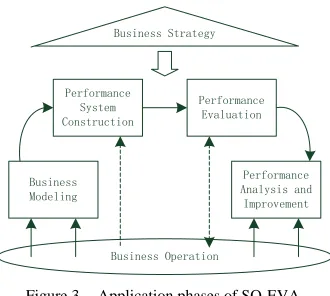
This section discusses the application process and method of the SO-EVA measurement. When the model is utilized to measure performance of SOE, the application can be divided into four phases including business modeling, performance system construction, performance evaluation and performance analysis and improvement. The four phases interact with business operation and form
Business Operation Business
Modeling Performance
System Construction
Performance Evaluation
Performance Analysis and
Improvement Business Strategy
Figure 3. Application phases of SO-EVA.
a closed loop of business performance management, and the overall application process is under the guidance of business strategy, as shown in Fig. 3.
At the business modeling phase, business of SOE is modeled using enterprise modeling methods accordingly to the operation architecture presented above, forming the foundation of performance management. By doing so, integrated description of SOE is made, where business services, service oriented business processes and other relevant business objects occupy a central role.
At a second phase, performance measurement system is constructed on the basis of business operation and enterprise model. The construction can be divided into two subsystems of EVA indicators and IPF measurement. The former can be derived directly from business objects at different levels, and the latter is attained through certain methodologies and principles presented in III. The construction should be achieved considering the business strategy and features of business operation.
Performance evaluation is made at the third phase. EVA indicators at different are calculated by (2)-(7), and IPFs are evaluated according to pre-defined measurement structure. EVA measurement can be implemented more efficiently the existence of IT applications supporting business data, events, processes and operations, while acquisition of evaluation data for IPFs may be a bit more complicated, as they may be obtained directly from business operation, upon statistics of business implementation, or by way of subjective estimation. The interaction between the evaluation and business operation is bi-directional, as although the evaluation mainly reflects operation performance, it has the ability to direct some operation decisions in a real-time manner because of its agility of utilization.
Upon the above steps, performance analysis can be carried out at the last phase, which leads to business decisions to develop and improve the business of SOE. Furthermore, apart from multiple analysis and improvement methods that can be applied synthetically, the SO-EVA measurement can be utilized directly as guidance of business improvement decisions, as discussed below.
decisions. Strategic EVA reflects the overall state of value creation of SOE, and service center EVA reveals ability of attaining values of service centers as well as business domains. Because service centers are organization units as profit center and cost center in SOE as mentioned above, the service center EVA measurement may lead to organizational management adjustments. For instance, if a service center gains positive profit but has a negative EVA, it should be examined and improvement decisions should be made. Net process EVA and Total process EVA are two kinds of indicators evaluating value creation of business processes. The indicators can be used to find out possible inefficiencies in business process design and/or implementations. Especially, if net process EVA is acceptable but total process EVA is not satisfying, there may be problems with matching and implementation of services, or there may be some notable characteristics of the profit model, and if the opposite, the business logic and the implementation of process should be noticed and further analyzed. At business service level, while business service EVA can be applied to judge whether a service implementation has created value, it’s more important to tell the performance of a business component of gaining value added.
It’s also very helpful to combine EVA indictors and IPFs to make analysis of business operation. For example, when analyzing business components, EVA measurement that reflects the profit ability and IPFs that predict development potentials can be used together, and one possible analysis method is similar to the BCG matrix analysis. If a business component has an unsatisfying or negative EVA but with remarkable estimation of development insight (e.g. much improvement possibility and excellent industry opportunities), it should be paid more attention on improvement and actions should be taken to make it more developed, but if both measurements are not satisfying, it may be better to consider constricting the business area, or even discarding and selling out corresponding business assets to meliorate cash flow situation or to support business components of better competence.
Moreover, timely operation decisions can also be made upon the measurement. For instance, if it’s decided to outsource certain services, EVA can be applied in selecting candidate services, e.g. to balance the choice between cost and execution time, and can be used to directing service level agreement negotiations aware of business performance.
V. ACASE STUDY A. Case Description
The SO-EVA model is able to take effect in business analysis and improvement in SOE. The case of S is given for illustration. S is a trust company that previously operated determinate trust products for bounded customers, and gained management profit. To improve its competitiveness, S has switched its strategy to offering individualized investment services, such as asset
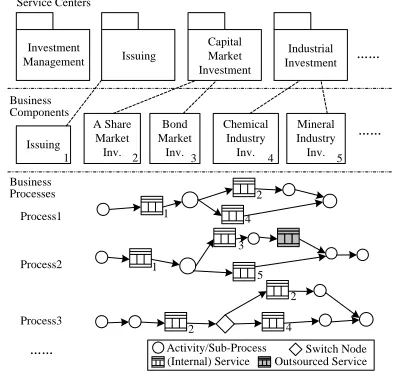
allocation and cash flow matching, and its business mode refers to SOE, as shown in Fig. 4. The subscripts of services in the figure mean the business components providing them.
In S, business capacities are developed into business components, exposed as business services and managed in service centers. Customers are not bounded to specific product, but are supplied with abundant customized business processes that orchestrate required business services. The processes are highly diverse and dynamic in structure, and the orchestrations of services are flexible in execution, so traditional process oriented performance measurement models meet with difficulties in designing index system and performance standards in such environment. SO-EVA solves the problem by the application of the agile EVA indicators and the predictive IPFs in operation.
Table II shows the strategic information of S, and Table III shows demanded information of engaged service centers (unit: million RMB yuan). They are listed from financial statements and operation data. The occupied capital value is converted to average during the measurement period.
B. Performance Measurement Using SO-EVA
The application of SO-EVA in S is discussed below, where EVA and IPF indicators are constructed and measured. Information needed for EVA calculation is listed in Table II-IV.
Service Centers
Issuing Investment
Management
Capital Market Investment
……
Industrial Investment
Business Components
Issuing
A Share Market
Inv.
Bond Market Inv.
Chemical Industry Inv.
Mineral Industry Inv.
……
Business Processes
Process1
Process2
Process3
Activity/Sub-Process (Internal) Service
Switch Node
……
1
1
4 2
5 3
4 2
1
4 3
2 5
2
Outsourced Service
Figure 4. A case of SOE operation..
TABLE II.
STRATEGIC INFORMATION
nopat tc wacc
458 1,200 16%
TABLE III.
SERVICE CENTER INFORMATION
Service center Total cost
Total revenue
Occupied capital value Investment management 2.96 74.54 65.24
Issuing 3.18 8.26 86.79
TABLE IV.
EVALUATION,COST AND CAPITAL COST INFORMATION
Process/ Service
Evaluat ion Cost
Shared Cost
Occupied capital value Process 1 622.12 4.11 0.45 97.82 Process 2 346.49 3.54 0.32 75.62 Process 3 364.72 3.07 0.33 70.26
S1 in P11 12.25 4.62 0.52 116.78 S2 in P1 369.68 10.2 3.37 1,204.64 S4 in P1 120.14 4.26 0.55 327.44 S1 in P2 8.03 2.87 0.34 76.42 S3 in P2 132.37 4.31 1.48 548.29 S5 in P2 91.72 2.65 0.22 213.51 Outsourced
Service in P2 108.85
- - - S2 in P3 (1st) 124.59 3.75 1.14 338.56 S2 in P3 (2nd) 142.85 3.21 0.97 387.72 S4 in P3 -(not operated)
Table IV records evaluation cost and capital occupation information of processes and services (unit: thousand RMB yuan). Revenue of service centers can be calculated with all evaluation data of processes and services as illustrated in (3). The listed costs and shared costs are total amounts calculated with initial operation data, as illustrated in (4). The calculations are omitted because of space limit. The occupied capital value is of the same meaning as in Table III. In Process 3, “A share market investment” was invoked twice, and “chemical industry investment” wasn’t executed.
EVA indicators can be calculated upon these data. Strategic EVA of S eva(S) is calculated according to (2):
eva(S)=nopat-tc×wacc=458-1200×16%=266 (million) . Service center EVA is calculated according to (3). For example, EVA of the service center of “investment management” is:
eva(sc1)=74.540-2.96-65.24×16%=61.14(million). Net process EVA calculation refers to (4), the example of calculation of Process 1 is as below:
neva(bp1 )=622.12-(12.25+369.68+120.14)-(4.11+0.45)-97.82×16%=99.84(thousand).
EVA of services in the case are calculated by (6.2), EVA of Service 1 in Process 1:
eva(s1_p1)= 12.25 - (4.62+0.52) - 116.78×16%=-11.57 (thousand).
Then, total EVA of business processes and EVA of business components (restricted to the listed services) can be calculated, corresponding to (5) and (7). Here are the examples:
teva(bp1)=neva(bp1)+eva(s1_p1)+eva(s2_p1)+eva(s4_
p1)=99.84+(-11.57)+163.37+62.94=314.58(thousand).
eva(bc2)=eva(s2_p1)+eva(s2_p3_1)+eva(s2_p3_1)=16 3.37+65.53+76.63=305.53(thousand).
The calculation results are listed in Table V.
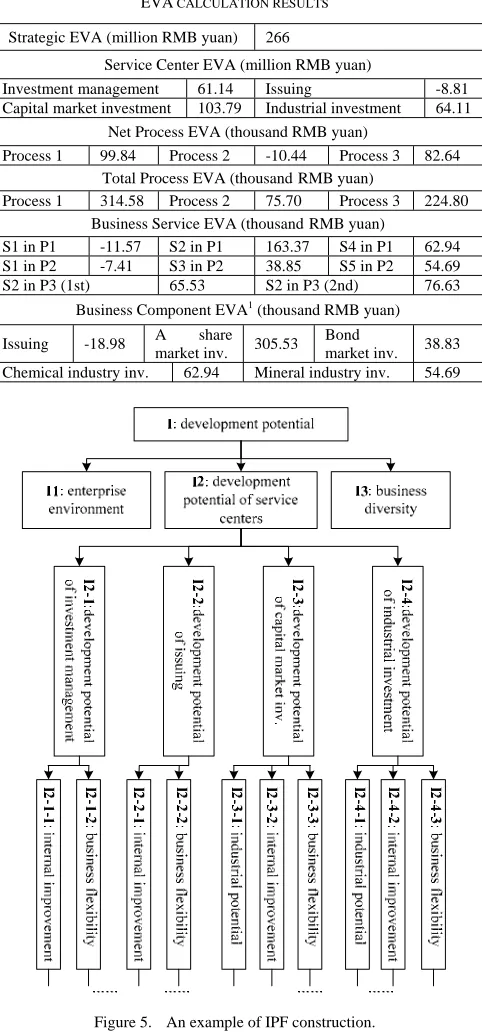
An example of IPF construction in S is illustrated in Fig. 4.The indicator “development potential” (I) is one of the IPFs. It is reflected in three other indicators “enterprise environment”, “development potential of service centers” and “business diversity” (I1-I3), and I2 is explained by the indices of development potential of each service center, and so forth.
TABLE V.
EVA CALCULATION RESULTS
Strategic EVA (million RMB yuan) 266
Service Center EVA (million RMB yuan)
Investment management 61.14 Issuing -8.81 Capital market investment 103.79 Industrial investment 64.11
Net Process EVA (thousand RMB yuan)
Process 1 99.84 Process 2 -10.44 Process 3 82.64 Total Process EVA (thousandRMB yuan)
Process 1 314.58 Process 2 75.70 Process 3 224.80 Business Service EVA (thousandRMB yuan)
S1 in P1 -11.57 S2 in P1 163.37 S4 in P1 62.94 S1 in P2 -7.41 S3 in P2 38.85 S5 in P2 54.69 S2 in P3 (1st) 65.53 S2 in P3 (2nd) 76.63
Business Component EVA1 (thousand RMB yuan) Issuing -18.98 A share
market inv. 305.53 Bond
market inv. 38.83 Chemical industry inv. 62.94 Mineral industry inv. 54.69
Figure 5. An example of IPF construction.
The weights of decompositions are calculated by judgment matrix using AHP method. Table VI shows the weight calculation of decompositions, where W are the normalized eigenvectors, λ max are the maximal
eigenvalues. The judgment matrixes all satisfy the consistent condition of C.R. < 0.1. Calculation below the level shown in the figure is omitted.
Table VII shows normalized results of IPF measurement. Quantitive estimations at lower levels are achieved by benchmarking(in italics in the table), and upon that, estimations of IPFs at higher levels are made.
TABLE VI.
CALCULATION OF JUDGMENT MATRIXES
Judgment matrix W λmax C.I. C.R.
I
1 1/ 4 1/ 2
4 1 3
2 1/ 3 1
⎡ ⎤ ⎢ ⎥ ⎢ ⎥ ⎢ ⎥ ⎣ ⎦ 0.137 0.625 0.238 ⎡ ⎤ ⎢ ⎥ ⎢ ⎥ ⎢ ⎥ ⎣ ⎦
3.018 0.009 0.016
I2
1 4 1/ 2 2 1/ 4 1 1/ 6 1/ 2
2 6 1 2
1/ 2 2 1/ 2 1
⎡ ⎤ ⎢ ⎥ ⎢ ⎥ ⎢ ⎥ ⎢ ⎥ ⎣ ⎦ 0.291 0.078 0.458 0.174 ⎡ ⎤ ⎢ ⎥ ⎢ ⎥ ⎢ ⎥ ⎢ ⎥ ⎣ ⎦
4.046 0.015 0.017
I2-1 1 1/ 3
3 1 ⎡ ⎤ ⎢ ⎥ ⎣ ⎦ 0.25 0.75 ⎡ ⎤ ⎢ ⎥
⎣ ⎦ 2 0 -
I2-2 ⎡⎢1/ 2 11 2⎤⎥
⎣ ⎦
0.667 0.333
⎡ ⎤
⎢ ⎥
⎣ ⎦ 2 0 -
I2-3
1 1/ 3 2
3 1 5
1/ 2 1/ 5 1
⎡ ⎤ ⎢ ⎥ ⎢ ⎥ ⎢ ⎥ ⎣ ⎦ 0.230 0.648 0.122 ⎡ ⎤ ⎢ ⎥ ⎢ ⎥ ⎢ ⎥ ⎣ ⎦
3.004 0.002 0.003
I2-4
1 1/ 2 2
2 1 3
1/ 2 1/ 3 1
⎡ ⎤ ⎢ ⎥ ⎢ ⎥ ⎢ ⎥ ⎣ ⎦ 0.297 0.540 0.163 ⎡ ⎤ ⎢ ⎥ ⎢ ⎥ ⎢ ⎥ ⎣ ⎦
3.099 0.046 0.079
TABLE VII.
NORMALIZED RESULTS OF IPF MEASUREMENT
I2-1-1 0.717
I2-1-2 0.921
I2-2-1 0.806
I2-2-2 0.873 I2-1 0.870 I2-2 0.828
I2-3-1 0.843
I2-3-2 0.812
I2-3-3 0.915 I2-3 0.832
I2-4-1 0.882
I2-4-2 0.803
I2-4-3 0.891 I2-4 0.841 I1 0.825 I2 0.845 I3 0.874 I 0.849
C. Analysis
The SO-EVA model is loosely bounded to concrete processes, and can be applied neatly in the operation of SOE. Upon the measurement, business can be analyzed and improved.
The service center of “issuing” has a negative EVA of -8.81 million, although its profit is positive: rev(sc) - c(sc) = 5.08 million. It’s because the services provided by the service center occupy certain amount of capital but produce no benefit, and the occupied capital issues capital cost. There are two possible ways to improve that. The one is to make investment with the capital during occupation if possible. The other is to outsource the issuing services, which may lead to higher cost but much lower capital cost. As meanwhile the development potential of the service center is below average according to the IPF measurement, it may be better to outsource the services. Another problem that should be noticed is that Process 2 produces a negative net EVA despite of its positive total EVA. That means the process creates even less value added than the invoked services themselves. Possible reasons include unexpected loss in execution and mistake(s) in negotiation of service level agreements. Thus it can be seen that SO-EVA reflects the practical situation problems better than traditional models, and guides to analysis and improvement of business performance.
Other analysis can also be made. For example, the business component of “investment management” gains notable EVA with relatively low cost and low capital cost,
and also has a good mark of development potential, so its development should be paid more attention. On the other hand, “A share market investment” has been main business on aspects of both scale and profit, but is evaluated relatively ordinary in development potential, so necessary investigation and consideration need to take place.
The case shows that SO-EVA is more suitable for the dynamic, diversified and flexible operation of SOE compared to traditional models. The analysis also shows that EVA indicators focus on value creation and provide better reflection of true values, while IPFs are supplementary to form predictive estimation. The model is efficient in performance measurement of SOE, and is effective in its business improvement and decisions.
VI. CONCLUSION AND FUTURE WORK
In this paper, we consider SOE as a novel business model, and discuss operation architecture and performance measurement of SOE from business perspective. Upon the conception of SOE along with its operation architecture and new features, requirements for performance measurement is discussed, where traditional measurement methods meet with difficulties in application. Thus, the performance measurement model of SO-EVA is proposed based on the EVA method, which focuses on value creation and has the potential to be utilized neatly and flexibly. SO-EVA utilizes and extends EVA at multiple levels, converting the financial measurement to structured business operation measurement, and introduces IPFs as predictive measurement, so as to form comprehensive evaluation. The SO-EVA model fits the SOE operation, satisfies the requirement of flexibility with high agility and short time lag, offers better reflections of business operation, and can be applied in business analysis and improvement as well as to support management decisions. The application is discussed, and a case study is also given in this paper, to better illustrate the structure, evaluation and application of the model.
Performance management of service oriented enterprise remains an open topic, and there’s still much work to do in future research. Upon the presented performance measurement method, performance analysis and optimization at various levels can be further studied, to fulfill the overall requirement for business performance management of SOE. The service level agreement mechanism based on the model is also a meaningful issue to research operation of SOE from business aspect. Besides, model driven architecture supporting operation and performance management of SOE can also be studied.
ACKNOWLEDGMENT
The work was granted by National Science & Technology Pillar Program of China (2009AA010308) and China-Euro Cooperation Project (0917).
[1] H. Demirkan, M. Goul, and D. Morse, “Introduction to the service oriented enterprise minitrack,” Proceedings of the 41st Annual Hawaii International Conference on System Sciences (HICSS 2008), 2008, pp. 94, doi: 10.1109/HICSS.2008.249.
[2] L. Cherbakov, G. Galambos, R. Harishankar, S. Kalyana, and G. Rackham, “Impact of service orientation at the business level,” IBM Systems Journal, vol. 44, 2005, pp. 653-668.
[3] M Janssen, “Exploring the service-oriented enterprise: drawing lessons from a case study,” Proceedings of the 41st Annual Hawaii International Conference on System Sciences (HICSS 2008), 2008, pp. 101-110, doi: 10.1109/HICSS.2008.166.
[4] M. P. Papazoglou and D. Georgakopoulos, “Service-oriented computing: an introduction,” Communications of the ACM, vol. 46, June, 2003, pp. 24-28,doi: 10.1145/944217.944233.
[5] D. A. Menasce, “QoS issues in web services,” IEEE Internet Computing, vol. 6, 2002, pp. 72-75, doi: 10.1109/MIC.2002.1067740.
[6] R. S. Kaplan, and P. David, “The balanced scorecard— measures that drive performance,” Harvard Business Review, vol. 70, Jan-Feb, 1992, pp. 71-79.
[7] A. Neely, Business Performance Measurement Theory and
Practice. Cambridge, Britain: Cambridge University Press, 2002.
[8] B. Liu, and Y. Fan, “A new performance evaluation model and AHP-based analysis method in service-oriented workflow,” 6th international conference on grid and cooperative computing 2007 (GCC 2007), 2007, pp. 685-692, doi: 10.1109/GCC.2007.20.
[9] J. Yin, and Z. Yang, “A study on the product profitability model based on activity-based costing and economic value added”, 4th International Conference on Wireless
Communications, Networking and Mobile Computing 2008 (WiCOM ’08), 2008, pp. 1-4, doi: 10.1109/WiCom.2008.1388.
[10]R. I. Lokanandha, and R. Raghunatha, “Performance evaluation, economic value Added and managerial behaviour,” PES business review, vol.1, 2006, pp.1-7. [11]L. Chen, and Z. Qiao, “Improvement of EVA on traditional
performance measurement: an application of neural network,” 4th International Conference on Natural Computation 2008 (ICNC ’08), 2008, pp. 424-428, doi: 10.1109/ICNC.2008.52.
[12]G. B. Stewart. “EVA: fact and fantasy,” Journal of Applied Corporate Finance, vol. 7, 1994, pp. 71–84.
[13]G. BROWN, CARPENTER R. Successful application of service-oriented architecture across the enterprise and beyond. Intel Technology Journal, 2004, 8(4): 345-359. [14]M. Butler and H. P. Williams, “The allocation of shared
fixed costs,” European Journal of Operational Research, vol.2, 2006, pp. 391-397, doi:10.1016/j.ejor.2004.07.046. [15]Q. Jiang, Mathematical Model. Beijing: Higher Education
Press, 1993.