Packialkshmi N et al., J. Sci. Res. Phar. 2014, 3(3), 76-80
J
ournal of
S
cientific
R
esearch in
P
harmacy
Research Article
Available online through
ISSN: 2277-9469
www.jsrponl
ine.com
Fourier Transform Infrared Spectroscopy Analysis of Anisomeles malabarica (Linn.)
Packialakshmi N* and Nilofer Nisha HM
PG and Research Department of Microbiology, Jamal Mohamed College (Autonomous), Tiruchirappalli – 620020, Tamilnadu, India.
Received on: 11-07-2014; Revised and Accepted on: 17-08-2014
ABSTRACT
A
nisomeles malabarica (Linn.) R.Br. is a traditional medicinal plant of lamiaceae family distributed throughout India. The plant hasbeen used as a folk medicine to treat amentia, anorexia, fevers, swelling and rheumatism. The main objective of the study is to observe the salient features exhibited by the Fourier Transform Infrared Spectroscopy the vibrational assignments, intensities and wave number of dominant peak were obtained from absorption spectra. Various functional groups like halogen, alkanes , carboxylic acid, aldehydes etc were identified by the Anisomeles malabarica samples (leaf, stem, flower and boiled leaf ) separated from the column chromatography. This article attempts to reveal the use of Fourier Transform Infrared Spectroscopy and at the same time creating interest among the prospective researcher in herbal analysis and this study creates a platform to screen many bio active components to treat various diseases.
Key Words: Anisomelesmalabarica, Column chromatography, IR-Spectrum analysis.
INTRODUCTION
M
edicinal plants have been identified and used throughout human history. Plants have the ability to synthesize a wide variety of chemical compounds that are used to perform important biological functions [1]. The use of plants as medicinespredates written human history. Ethnobotany (the study of traditional human uses of plants) is recognized as an effective way to discover future medicines. In 2001, researchers identified 122 compounds used in modern medicine which were derived from "ethnomedical" plant sources; 80% of these have had an ethnomedical use identical or related to the current use of the active elements of the plant. Many of the pharmaceuticals currently available to physicians have a long history of use as herbal remedies, including aspirin, digitalis, quinine, and opium.
Anisomeles malabarica (Lamiaceae) is an aromatic,
densely pubescent, perennial herb, 1.2-2m in height. It is commonly found in Western Ghats from Maharashtra to karnataka, Andhra pradesh, Kerala and Tamilnadu in India [2]. The plant is reported to possess antiperiodic, disphoretic, emmenagogue properties [3].
Ethanobotanically, the leaves of Anisomeles malabarica are used against convulsions, dyspepsia, intermittent fever, colic, tetanus[4].
Anisomeles malabarica R. BR.is an erect shrub commonly known as
Malabrcatmint distributed throughout south India. In the traditional medicinal the infusion of the leaf is used for fever, epilepsy and the fever arising from teething in children .The decotion of the leaf and essential oil are used externally in rheumatic arthritis [5].The plant
also reported for the presence of anisomelic acid, ovatodiolide, anisomelyl acetate and betulinic acid. It also has antileishmanial activity.
Taxonomical Classification of Anisomeles malabarica:
Kingdom Planate Phylum Trachophyta Class Magnoliposide Order Lamiales Family Lamiaceae Genus Anisomeles
Species malabarica (L)
Tradtional Name Peruthumbai
*Corresponding author:
Dr.N.PackialakshmiPG and Research Department of Microbiology,
Jamal Mohamed College (Autonomous), Tiruchirappalli – 620020. *E-Mail: [email protected]
In the present study deals with the functional groups present in these chemical constituents of plants are usually identified by FTIR. This helps in structure elucidation with other methods and gained importance to identify medicines. Initially, FTIR was used to elucidate the structure of isolated compounds. Identification and comparison of biomolecules of Anisomeles
malabarica were done by using FTIR. This study creates a platform
to screen many bio active components to treat various diseases.
MATERIALS AND METHODS
Collection of Plant Materials:
Fresh young plant of Anisomeles malabarica L were collected from Thekamalai near Vaiyampatti, dry rocky region of Trichy district in Tamilnadu. The leaves were separated from the collected plant. Then it was air dried in shade for 15 days and then pulverized to fine powder for further analysis.
Chromatography:
Column chromatography is used to purify liquids by separating an organic solvent from a mixture of solvent.
Preparation of Leaf Extract:
The leaf extract (5mg) was prepared by grinding the mixture in mortar pistol containing 22 ml of acetone, 3 ml petroleum ether and calcium carbonate. The extract was filtered and mixed with 20 ml petroleum ether and 20 ml of 10% aqueous sodium chloride solution. The separating funnel was shaken carefully and the lower layer was allowed to drain in to the beaker.
Preparation of Column:
A plug of cotton is placed to the bottom of the column so that silica and soil won’t fall out. Slurry of silica was prepared and poured in to the column carefully. It is allowed to settle and sand is added.
Loading of Sample:
Packialkshmi N et al., J. Sci. Res. Phar. 2014, 3(3), 76-80
IR Spectrum Analysis:
FTIR relies on the fact that the most molecules absorb light in the infra red region of the electromagnetic spectrum. This absorption corresponds specifically to the bonds present in the molecule. The frequency ranges are measured as wave numbers typically over the range 4000-600 cm-1. The compounds were analyzed using shimaze IR affinity I instrument.
RESULT
T
he present study showed that different compounds were separated from Anisomeles malabarica by using columnchromatography. The eluted sample is allowed to dry in air. These eluted compounds were subjected to FTIR analysis. The FTIR spectrum was used to identify the functional group of the active components based on the peak value in the region of infrared radiation. The results of FTIR peak values and functional groups were represented in table 1, 2, 3 & 4. The presence of various functional groups of different compounds was found. FTIR spectroscopy is proved to be a reliable and sensitive method for detection of bimolecular composition.
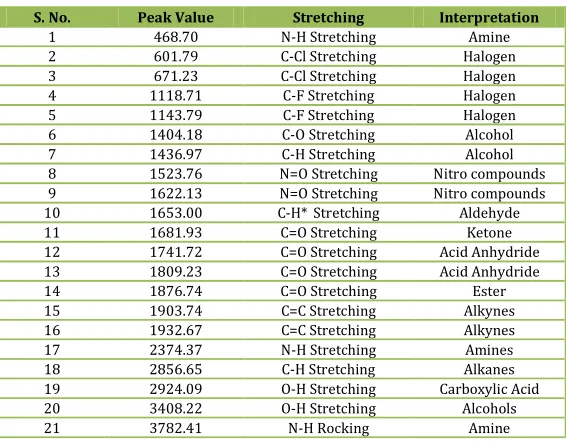
Table No. 1: Infra Red Spectrum analysis by Anisomeles Malabarica Leaf powder
S. No. Peak Value Stretching Interpretation
1 468.70 N-H Stretching Amine
2 601.79 C-Cl Stretching Halogen
3 671.23 C-Cl Stretching Halogen
4 1118.71 C-F Stretching Halogen
5 1143.79 C-F Stretching Halogen
6 1404.18 C-O Stretching Alcohol
7 1436.97 C-H Stretching Alcohol
8 1523.76 N=O Stretching Nitro compounds
9 1622.13 N=O Stretching Nitro compounds
10 1653.00 C-H* Stretching Aldehyde
11 1681.93 C=O Stretching Ketone
12 1741.72 C=O Stretching Acid Anhydride
13 1809.23 C=O Stretching Acid Anhydride
14 1876.74 C=O Stretching Ester
15 1903.74 C=C Stretching Alkynes
16 1932.67 C=C Stretching Alkynes
17 2374.37 N-H Stretching Amines
18 2856.65 C-H Stretching Alkanes
19 2924.09 O-H Stretching Carboxylic Acid
20 3408.22 O-H Stretching Alcohols
21 3782.41 N-H Rocking Amine
Table No. 2: Infra Red Spectrum analysis by Anisomeles Malabarica Flower powder
S. No. Peak Value Stretching Interpretation
1 514.99 CuBa Stretching Halogen
2 673.16 C-Cl Stretching Halogen
3 1035.77 C-F Stretching Halogen
4 1095.57 C-F Stretching Halogen
5 1411.89 C-H Stretching Alkanes
6 1521.84 C-H* Stretching Aldehyde
7 1647.21 C-O Stretching Alkanes
8 1732.08 C=O Stretching Acid Anhydride
9 1799.59 C=O Stretching Acid Anhydride
10 2191.13 C=C Stretching Alkynes
11 2276.00 C=C Stretching Alkynes
12 2856.58 O-H Stretching Carboxylic Acid
13 2922.16 O-H Stretching Carboxylic Acid
14 3421.72 N-H Rocking Amine
15 3707.18 N-H Rocking Amine
16 3772.72 N-H Rocking Amine
Table No. 3: Infra Red Spectrum analysis by Anisomeles Malabarica Stem powder
S. No. Peak Value Stretching Interpretation
1 516.92 C-Br Stretching Halogen
2 623.01 C-Cl Stretching Halogen
3 869.90 C-H Def Aromatic rings
4 929.69 C-C Stretching Alkanes
5 1078.21 C-F Stretching Halogen
6 1120.64 C-F Stretching Halogen
7 1192.01 C-F Stretching Halogen
Packialkshmi N et al., J. Sci. Res. Phar. 2014, 3(3), 76-80
Table No. 4: Infra Red Spectrum analysis by Anisomeles Malabarica Boiled Leaf
S. No. Peak Value Stretching Interpretation
1 601.79 C-Cl Stretching Halogen
2 669.30 C-Cl Stretching Chlorine
3 1101.35 C-F Stretching Halogen
4 1433.11 C-H Def Alkane
5 1525.69 -C-C- Stretching Aromatic rings
6 1562.34 C=O Stretching Carboxylic Acid
7 1635.64 C=C Stretching Alkanes
8 1745.58 C=O Stretching Acid anhydride
9 2272.15 O-H Stretching Alcohol
10 2376.30 -C=C Stretching Alkynes
11 2924.09 -C-H Stretching Alkynes
12 3421.72 -N-H Rocking Amine
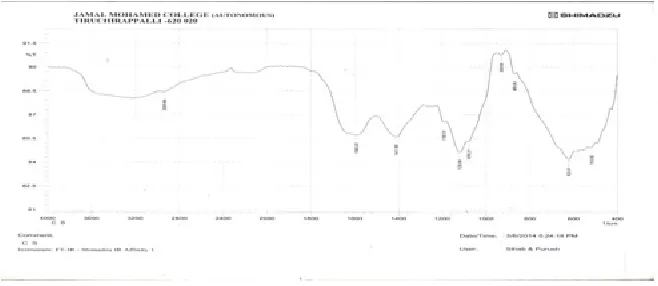
The absorption spectra of sample in leaf are show in fig.1. The dominant band in case of leaf was observed at 601.79, 671.23, 1118.71 and 1143.79 cm-1 represents halogens compound. The band
at 468.70, 2374.37 and 3782.41 cm-1 was due to amines compound.
The band at 1523.76 and 1622.13 cm-1 representing nitro
compounds. The peak at 1741.72 and 1809.23 cm-1 represents acid
anhydride. The peak at 3408.23 and 1404.18 cm-1 indicated alcohol
group. The band at 1903.74 and 1932.67 cm-1 was due to the
presence of alkynes. The peak at 2854.64 cm-1and 1436.97 cm-1
indicates alkanes. The band at 2924.09 shows carboxylic acid. The peak at 1876.74 cm-1 shows c=o stretching (ester compound). The
band at 1653.00 cm-1 show C-H*stretching and 1681.93 represent
the presence of ketone compound.
The absorption spectra of the flower sample are shown in fig.2. The strong band was observed at 514.99, 673.16, 1035.77 and 1095.57 cm-1 was attributed to halogens group. The band at
3421.72, 3707.18 and 3772.76 cm-1 was due to N-H stretching of
amines. The band at 2856.58 and 2922.16 cm-1 revealed the presence of O-H stretching carboxylic acid. The band at 2191.13 and 2276.00 cm-1 was attributed to C=C stretching of alkynes. The band
at 1732.08 and 1799.59 cm-1 was due to acid anhydride. Alkanes presence was determined by the presence of band at 1411.89 and 1647.21 cm-1. The band at 1521.84 cm-1 represents aldehyde.
The absorption spectra of stem sample are shown in fig.3. The strong bands at 516.92, 623.01, 10728.21, 1120.64 and 1192.01 cm-1 were attributed to halogens. The bands at 929.69, 1411.89 and
2935.66 cm-1 correspond to alkanes group. The band at 1593.20 cm -1 was due to aldehyde. The peak at 869.90 cm-1 resulted from
presence of aromatic rings.
The absorption spectra of the boiled leaf sample are shown in fig.4. The band at 601.79 and 1101.35 cm-1 attributed to
halogens group. The band at 669.30 cm-1 represents chlorine. The
absorption band at 1433.11 and 2924.09 cm-1 represent alkanes.
The peak at 1525.69 indicates -C-C- stretching of aromatic rings. C=O stretching was found to be present due to the appearance of absorption peak at 1562.34. The band at 1635.64 cm-1 was due to
alkenes. The band at 2272.15 cm-1 represents alcohol. The peak at
2272.15 cm-1 indicates alcohol. The band at 2376.30 cm-1 represents
alkynes. The band at 3721.72 cm-1 revealed the presence of -N-H
stretching of amines. Significant changes have been recorded in the functional groups of different parts of plant in Anisomeles
malabarica subjecting the sample for FTIR. This includes the
presence of amine group present in leaf, flower and boiled leaf. But in stem sample the amine group is absent. The presence of alkane group present in both four samples.
Fig. 1: Infrared spectrum analysis compound obtained by column chromatography in Anisomeles malabarica Leaf
Packialkshmi N et al., J. Sci. Res. Phar. 2014, 3(3), 76-80
Fig. 3: Infrared spectrum analysis compound obtained by column chromatography in Anisomeles malabarica Stem
Fig. 4: Infrared spectrum analysis compound obtained by column chromatography in Anisomeles malabarica Boiled leaf
DISCUSSION
I
n the earlier study foundthat Anisomeles malabarica (L). and Nepta malabarica L., (Family Lamiaceae) is a medicinal plant, has been used as a folkloric medicine to treat amentia, anorexia, fever, swelling and rheumatism [6]. In earlier studies reported thatAnisomeles malabarica has antileishmanial activity of acetone and methanol extract to possess antispasmodic, antiperiodic properties and used in Rheumatoid arthritis[7].It is used for the traditional
treatment of snake bite [8]. The plant leaves are used as carminative,
astringent, stomach ache rheumatism and disphoretic in coimbatore district [9]and used as dentrifrice to cure various dental problems [10].
The plant Anisomeles malabarica is used traditionally in the treatment of intermittent fever, colic, dyspepsia and catarrh affections[11].The paste of stem is mixed with coconut oil and used
for curing wounds[12]. In the present investigation halogens and
alkanes functional groups have been observed in the entire four samples. Amine group present in leaf, flower and boiled leaf but absent in stem sample. Chlorine functional group present in boiled leaf sample but absent in other three samples. Aromatic rings present in stem and boiled leaf and absent in leaf and flower sample. The significant changes observed in fresh leaf, flower, stem and boiled leaf of Anisomeles malabarica offer the scope for research in bio prospection of this plant. The present work identifies the functional groups and these groups do the wonderful role against the pathogens.
CONCLUSION
A
n attempt has been made in this work to study the functional derivatives of the sample. By observing the position and relative intensities of the band in FTIR. The spectral analysis indicated that the specific functional groups. FTIR spectroscopy technique showed that the presence of functional groups which can be isolated and further screened for different kind of biologicaldifferent analytical method such as NMR and Mass spectrophotometer.
REFERENCES:
1. Fabricant DS, Farnsworth NR. "The value of plants used in traditional medicine for drug discovery".Environ. Health Perspective,2001;109: 69-75.
2. Gupta AK, Tandon N. Revon. Ind. Med. plants ICMR, 2004; 343-349.
3. Ramachandran KA dictionary of Ind. Raw. Mat. and Industrial products. CSIR, 1985; 278.
4. Apparananthem T, Chelladurai V, Subramanian V. Bull. Mad. Ethnobot. Res., 1982; 3: 173-177.
5. Reddy MB, Reddy JR, Reddy MN. I. J. Pharmacog., 1991; 29: 273-280.
6. Chopra RN, Nayar SL and Chopra K. Glossary of Indian Medicinal plants. Counsil of scientific and Industrial Research, New Delhi, 1956; 19.
7. Nadkarnrni KM. Indian materia medica. 3rd Edition, Popular
Prakashan Pvt Ltd, Mumbai. 1996; 114-115.
8. Perumalsamy R, Maung Thwin M, Gopalakrishnakone P and Ignacimuthu S Ethnobotanical survey of folk plants for the treatment of snake bites in Southern part of Tamilnadu, India. Journal of Ethopharmacology, 2008; 115(2): 302-3012. 9. Kalyani K, Lakshmanan KK and Viswanathan MB,
Medicobotanical Survey of plants in Marudhamalai Hills of coimbatore district, Tamilnadu. Journal of the Swamy. Botanical. Club., 1989; (3&4): 89-96.
10. Ganesan S. Traditional oral care medicinal plants survey of Tamilnadu. Natural product Radiance, 2008; 7(2): 166-172. 11. 11. Tripathi YC, Prabhu, Pal RS and Mishra RN. Medicinal
plants of Rajasthan in India system of medicine. Ancient science of life, 1996; 3: 190-212.
Packialkshmi N et al., J. Sci. Res. Phar. 2014, 3(3), 76-80
How to cite this article:
Packialakshmi N and Nilofer Nisha HM: Fourier Transform Infrared Spectroscopy Analysis of Anisomeles malabarica (Linn.). J. Sci. Res. Phar, 2014; 3(3): 76-80.
Conflict of interest: The authors have declared that no conflict of interest exists.