EAI Endorsed Transactions
on
Cognitive
Communications
Research Article
Energy-Based
Cooperative
Spectrum
Sensing
of
SC-FDMA
Systems
Fucheng
Yang
and
Lie-Liang
Yang
*
School of Electronics and Computer Science, University of Southampton, SO17 1BJ, UK
Abstract
In this paper, we propose a frequency-hopping M-ary frequency-shift keying spectrum sensing network (FH/MFSK SSN) for identifying the on/offstates of the users supported by a single-carrier frequency-division multiple assess (SC-FDMA) primary radio (PR) system. Specifically, the spectrums of an uplink interleaved frequency-division multiple access (IFDMA) PR system are monitored by a number of cognitive radio sensing nodes (CRSNs). These CRSNs distributedly detect the on/offstates of users based on one of the three energy detection schemes. After the local spectrum sensing, the CRSNs transmit their detected states to a fusion centre (FC) with the aid of FH/MFSK techniques. At the FC, the on/off states of the users supported the IFDMA PR system are finally classified according to either the conventional equal-gain combining (EGC) scheme or the novel erasure-supported EGC (ES-EGC) scheme. In this way, the on/offinformation about the spectrums occupied by an IFDMA PR system can be obtained, so that they can be exploited by a cognitive radio (CR) system. For local spectrum sensing, in this paper, we consider four synchronisation scenarios concerning the synchronisation between the received IFDMA signals and the CRSNs. The performance of the FH/MFSK SSN associated with various schemes is investigated by simulations. Our studies show that the FH/MFSK SSN constitutes one of the highly reliable spectrum sensing schemes, which are capable of exploiting both the space diversity provided by local CRSNs and the frequency diversity provided by the subcarriers of IFDMA system.
Received on 17 October 2013; accepted on 31 March 2013; published on 14 July 2014
Keywords: Spectrum sensing, cognitive radio, cooperative, energy-based detection, frequency-hopping, M-ary
frequency-shift keying, equal-gain combining, erasure-supported equal-gain combining, noncoherent detection, multiple-access.
Copyright © 2014 F. Yang and L.-L. Yang, licensed to ICST. This is an open access article distributed under the terms of
the Creative Commons Attribution license (http://creativecommons.org/licenses/by/3.0/), which permits unlimited
use, distribution and reproduction in any medium so long as the original work is properly cited. doi:10.4108/cogcom.1.1.e2
1. Introduction
In wireless communications, the need for high data rate services is increasing as a result of the transition from voice-only communications to multimedia appli-cations [1]. Given the limit of natural frequency spec-trum, it has been recognised that the current static fre-quency allocation schemes are unable to accommodate the increasing number of high data rate devices. Cogni-tive radio with the capability to sense and exploit unoc-cupied channels or frequencies has therefore become a promising candidate for mitigating the problem of spectrum shortage [2]. According to Federal Communi-cation Commission (FCC) [3], cognitive radio is defined
∗Corresponding author. Email:[email protected]
as a radio or system that can sense its operational electromagnetic environment and can dynamically and autonomously adjust its radio operating parameters to modify system operation, such as maximise through-put, mitigate interference, facilitate interoperability, access secondary markets.
In cognitive radio terminology, primary radios (PRs) have higher priority or legacy rights on the usage of specific parts of spectrum allocated to them, while cognitive radios (CRs) can access these spectrums in a way that they do not cause interference on the PRs or degrade the performance of the PRs. The studies show that the efficiency of CR systems depends mainly on
the CRs’ capability to sense the PR users’ states (on/off)
and to respond correspondingly and quickly. Hence, it
EAI
European Alliancefor Innovation 1
is critical that CR systems can make quick and reliable decisions during spectrum sensing [4].
Depending on the knowledge available to the CRs, a range of spectrum sensing methods have been proposed and studied. As some examples, energy detection has been considered in [1, 5–7], matched filter (MF) detection in [5, 8], cyclostationary feature detection in [5, 8–10], etc. Each of these spectrum sensing techniques has some unique advantages and disadvantages, as detailed as follows. First, energy detection, also known as radiometry or periodogram, is the first way of spectrum sensing coming to our mind, owing to its low computation and implementation complexities [1]. In principle, an energy detector simply treats PR signals as noise and decides about their presence or absence based on the energy levels of the observed signals. Since it does not require anya-priori knowledge of PR signals, energy detection is viewed as a type of blind detection method. In energy detection, if the noise power is unable to be accurately estimated, its performance may significantly degrade. Furthermore, the noise-uncertainty in energy detection may lead to the so-called SNR wall phenomena [11]. Unlike the energy detector, MF detector and cyclostationary feature detector rely on the a-priori knowledge of PR signals’ parameters, such as, waveforms, which is impractical for certain applications [4]. In a little more detail, MF detector makes coherent detection based on thea-prioriknowledge of modulation type and carrier frequency of the PR signals. By contrast, cyclostationary feature detection belongs to a noncoherent spectrum sensing approach, which may distinguish various modulation signals. However, cyclostationary feature detector requires some parameters of PR signals, such as, symbol rate. In comparison with the above three types of spectrum sensing approaches, eigenvalue detection [2–4,12–16] does not depend on thea-priori information as well as noise power, and it has the advantage of simultaneously achieving a high detection probability and a low false-alarm probability. However, the eigenvalue detection is highly dependent on the correlation of PR signals, it becomes less efficient when
PR signals become less correlated.
In this paper, we propose and study a spectrum sensing network (SSN) for CR systems, where a number of cognitive radio sensing nodes (CRSNs) distributedly sense a PR system with multiple PR users. We assume that the PR system is the interleaved frequency-division multiple access (IFDMA) system for the LTE [17], which supports a number of synchronous PR users. To attain fast and low-complexity spectrum sensing, energy detection is employed by the CRSNs. Specifically, local decisions for the presence of multiple PR users are made by the CRSNs separately based on one of the three types of energy detection schemes considered, under the constraints of one of thefour synchronisation
scenarios assumed between the PR signals and the CRSNs. By this way, every CRSN obtains a binary local decision vector, which is sent to the FC with the aid of frequency-hopping (FH) and M-ary frequency-shift keying (MFSK). Therefore, the SSN is referred to as the FH/MFSK SSN. Note that, in our SSN, we choose MFSK instead of other modulations, such as binary phase-shift keying (BPSK) and quadrature amplitude modulation (QAM), because of the following considerations. Firstly, it is well known that MFSK is an energy efficient modulation scheme, while the
BPSK and QAM are bandwidth efficient, but not
energy efficient modulation schemes. We prefer the
energy-efficient scheme, in order to attain a low
power spectral density, so that our SSN imposes little interference on the other wireless systems. Secondly, MFSK signals can be detected noncoherently without requiring channel estimation, which is suitable for operation in FH systems. By contrast, BPSK/QAM require the coherent detection that demands very accurate channel estimation. Explicitly, they are not suitable for operation in the FH systems, where the hopping rate is relatively high. In this paper, two types of noncoherent fusion detection rules are employed by the FC for making the final decision, which include a conventional equal-gain combining (EGC) fusion rule and a low-complexity erasure-supported EGC (ES-EGC) fusion rule [18]. The performance of the FH/MFSK SSN with EGC or ES-EGC fusion rule is investigated via simulation, under the assumptions that the channels from PR users to CRSNs and the channels from CRSNs to FC experience independent Rayleigh fading. Our studies and performance results show that our proposed FH/MFSK SSN constitutes a highly reliable spectrum sensing scheme, which is capable of exploiting the space diversity provided by CRSNs as well as the frequency diversity provided by the subcarriers of IFDMA system. Additionally, in comparison with the conventional EGC fusion rule, the novel ES-EGC fusion rule is robust to the errors made by CRSNs, yielding better detection performance.
The reminder of this paper is organised as follows. In Section 2, we provide the details of the proposed FH/MFSK SSN. Section3considers the fusion detection with either EGC or ES-EGC fusion rule. Section 4
demonstrates the simulation results for the detection performance. Finally, in Section 5, conclusions of this paper are derived.
2. System Model
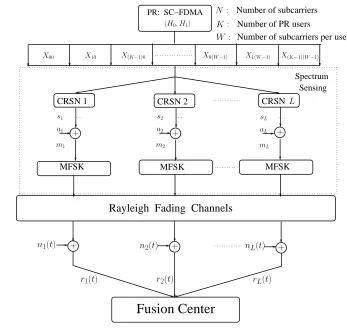
The framework for our FH/MFSK SSN is shown as Fig. 1. We assume that the PR system is a LTE/LTE-A uplink SC-FDMA system, which supports K PR users. Each of the K PR users has two states: H0 (off) and
H1(on). We assume that the SC-FDMA system employs
EAI
European Alliancefor Innovation 2
Rayleigh Fading Channels
CRSN 1 CRSN 2 CRSN
Number of PR users
Number of subcarriers per user Number of subcarriers
MFSK
MFSK MFSK
Fusion Center
PR: SC−FDMA
Spectrum Sensing
rL(t)
+ + +
+ + +
X(K−1)(W−1)
X1(W−1)
X0(W−1)
X(K−1)0
X10
X00
K:
W:
N:
r1(t) r2(t)
n1(t) n2(t) nL(t)
m1
a1
s1
m2
a2
s2
mL
aL
sL
(H0, H1)
L
Figure 1. System model for the FH/MFSK SSN sensing an IFDMA PR system.
N subcarriers. As shown in reference [19], there are typically two strategies for allocation ofN subcarriers to K users, yielding the so-called interleaved FDMA (IFDMA) and localised FDMA (LFDMA). In this paper, we consider only the IFDMA scheme. For convenience of our description, we assume that theNsubcarriers are equally assigned to theK PR users. Hence, each of the
K PR users occupiesW =N /K interleaved subcarriers. When the kth, k= 1,2, . . . , K, PR user is present to communicate, it occupies all theWsubcarriers assigned to it. As the subcarriers are orthogonal with each other, we assume that every CRSN is capable of simultaneously sensing all the N subcarriers without inter-carrier interference. Furthermore, we assume that the CRSNs are operated in the strong SNR region and they are capable of acquiring some knowledge about the IFDMA PR system via its pilot signals.
In this contribution, energy sensing (detection) is employed by the L CRSNs, as seen in Fig. 1, to sense which PR user(s) is on/off or which subcarriers are
available for the CR system. After the local sensing, each of the CRSNs obtains a binary vector of lengthK, indicating the on/off states of the K PR users. Then,
the K-length binary vector is conveyed to an M-ary number and transmitted to the FC in the principles of
FH/MFSK. We assume that the number of frequency bands, expressed asM, used for FH/MFSK is equal to or larger than 2K. Finally, at the FC, the on/off states of theK PR users are noncoherently classified based on the signals received from the L CRSNs. In this paper, two types of fusion detection schemes are considered, which are based on the conventional EGC [20] and the novel ES-EGC [18], respectively. Below, we provide the details about the operations carried out at the CRSNs and FC.
2.1. Spectrum Sensing at CRSNs
For convenience, the main parameters used in this paper are summarised as follows.
• N: number of subcarriers of SC-FDMA PR system; • K: number of uplink PR users;
• W =N /K: number of subcarriers per PR user; • L: number of CRSNs;
• M: number of frequency bands used by
FH/MFSK;
• U+ 1: number of multipaths of communications channels.
EAI
European Alliancefor Innovation 3 EAI Endorsed Transactions on
DFT (FFT)
Subcarrier Mapping
IDFT (IFFT)
Add CP
Low−pass Filter Time−Domain Frequency−Domain
Time−Domain
xk0,· · ·, xk(W−1)
Xk0,· · ·, Xk(W−1)
n
˜
Xk0,· · ·,X˜k(N−1)
o ˜
xk0,· · ·,x˜k(N−1)
s(t)
˜
xk(N−Nc),x˜k(N−Nc−1),· · ·,x˜k(N−1),˜xk0,· · ·,˜xk(N−1)
Figure 2. Transmitter schematic for the kth user supported by
the SC-FDMA uplink.
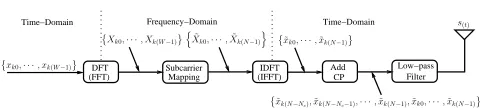
The transmitter schematic of the SC-FDMA uplink is shown in Fig.2. Let theW symbols transmitted by the
kth PR user in time-domain be expressed as
xxxk=[xk0, xk1,· · ·, xk(W−1)]T,
k= 0, 1,· · ·, K−1 (1)
As shown in Fig. 2, first, xxxk is transformed to the frequency-domain with the aid of the W-point DFT, yielding the W-length vectorXXXk, which can be expressed as
XXXk =FFFWxxxk = [Xk0, Xk1,· · ·, Xk(W−1)]T (2) whereFFFW denotes anW-point FFT matrix [19]. More specifically, theW entries in the vectorXXXkare given by
Xkl = 1
√
W
W−1 X
w=0
xkwexp −j 2πlw
W
!
,
l= 0,1,· · ·, W−1 (3)
Following the DFT operation, theWelements inXXXkare mapped toWout of theN =W Ksubcarriers, according to the principles of IFDMA [19]. After the subcarrier mapping, theW-length vectorXXXk is extended to anN -length vector ˜XXXk, which can be represented as
˜
X X
Xk = [ ˜Xk0, X˜k1,· · · ,X˜k(N−1)]T (4)
In more detail, under the IFDMA strategy for mapping, the elements of ˜XXXkare given by
˜
Xkn =Xkw, ifn=wK+k ˜
Xkv= 0,otherwise (5)
where w= 0, 1,· · ·, W−1; k= 0, 1,· · ·, K−1. After the subcarrier mapping, as shown in Fig. 2, ˜XXXk is transformed to the time-domain by carrying out the IDFT operation, yielding anN-length vector
˜
xxxk =FFFHNXXX˜k (6) whereFFFNdenotes theN-point FFT matrix.
According to [19], upon submitting (3) and (5) into (6), the vth, v = 0, 1,· · ·, N−1, element of ˜xxxk can be expressed as
˜
xk(v=qW+i)= 1
√
N
N−1 X
n=0 ˜
Xknexp
j2πvn N
=√1
Kexp
"
j2π(qW+i)k N
#
xki (7)
where the values of q, q= 0, 1,· · · , K−1, and i, i=
0, 1,· · ·, W −1, are uniquely determined by the value
of v. From (7) we can see that theW symbols ofxxxk of the kth PR user are repeatedly transmitted on thekth subcarrier, and all the W symbols are transmitted K
times within one IFDMA symbol duration [19].
Following the N-point IDFT operation, as shown in Fig. 2, a cyclic prefix (CP) is added in the front of ˜xxxk in order to eliminate inter-symbol interference (ISI). Explicitly, the Nc -length CP for ˜xxxk is
h ˜
xk(−Nc), x˜k(−Nc+1),· · ·x˜k(−1)
i = h
˜
xk(N−Nc), x˜k(N−Nc−1),· · ·x˜k(N−1)
i
, which consists of the last Nc elements of vector ˜xxxk. Let us express the time-domain vector after the CP as ˜xxx′k, which is
˜
xxx′k=hx˜k(−Nc),· · ·,x˜k(−1),x˜k0,· · ·,x˜k(N−1)
i
=hx˜k(N−Nc),· · ·,x˜k(N−1),x˜k0,· · ·,x˜k(N−1)
i (8)
Based on (8), finally, as shown in Fig.2, we can form the complex baseband equivalent signal transmitted by thekth PR user, which is
sk(t) = N+Nc−1
X
v=0
√
2Px˜′kvψ(t−vTc) (9)
whereP is the transmission power per dimension, ˜x′kv
is thevth element of ˜xxx′k andψ(t) is a unit-power chip-waveform impulse defined in (0, Tc], where Tc is the chip duration, determined by the bandwidth used by the SC-FDMA system.
In our proposed SSN, each of the CRSNs is capable of simultaneously sensing all the K PR users. In this case, when theK uplink PR users’ signals in the form of (9) are transmitted through wireless channels, the received complex baseband equivalent signal at thelth (0< l≤L) CRSN can be written as
Rl(t) = K−1 X
k=0
sk(t)∗hkl(t) +nl(t) (10)
where hkl(t) denotes the channel impulse response (CIR) between thelth CRSN and thekth PR user, while
nl(t) is the Gaussian noise process presenting at thelth CRSN, with zero mean and single-sided power-spectral density (PSD) ofN0per dimension.
At thelth,l= 1, . . . , L−1, CRSN, the received signal
Rl(t) is first sent to a filter matched to the chip waveform ψ(t). Then, the filter’s output signal is sampled at the chip rate of 1/Tc. After the normalisation using 1/√2PTc, it can be shown that thevth, (0≤v ≤
EAI
European Alliancefor Innovation 4 EAI Endorsed Transactions on
N+Nc−1), sample can be expressed as
˜
yl,v′ = √ 1 2PTc
Z (v+1)Tc
vTc
Rl(t)ψ(t−vTc)dt
= K−1 X
k=0
(hl,kv∗x˜′kv) + ˜nl,v
= K−1 X
k=0 U X
u=0
hl,ku×x˜′k(v−Nc−u)+ ˜nl,v (11)
where we assumed that the CIR has (U+ 1) taps, i.e.,hhhkl =hl,k0,· · ·, hl,kUT. In the above equation, the Gaussian noise sample ˜nl,v is expressed as
˜
nl,v = 1
√
2PTc
Z (v+1)Tc
vTc
nl(t)ψ(t−vTc)dt (12)
which has zero mean and a variance 2σ2=N0/Ec with
Ec=PTcrepresenting the chip energy.
From the outputs of ˜yl,v′ , we can form an N-length vector ˜yyyl at the lth CRSN. Furthermore, in the cases when the CRSNs do not know the beginning of an IFDMA symbol, they have to use an N-length vector having a random starting point. In this case, the N
samples may span two consecutive IFDMA symbols. In order to consider this scenario, we use the superscript ‘0’ to indicate the current IFDMA symbol, while the superscript ‘−1’ to indicate the previous IFDMA symbol. In this contribution, four scenarios will be addressed. In the first scenario, namely, synchronous sensing, we consider the case of perfect synchronisation between the PR users and CRSNs. In the second and the third scenarios, we assume qusi-synchronisation between the PR users and the CRSNs, where the N
samples used by a CRSN all come from one IFDMA symbol. However, we assume that there is no inter-(IFDMA) symbol interference in the second scenario, but there is in the third scenario. Correspondingly they are referred to as the quai-synchronous sensing without ISI and quai-synchronous sensing with small ISI, respectively. Finally, in the context of the fourth scenario, we assume that the N samples used by one CRSN are contributed by two consecutive IFDMA symbols, hence, it is an asynchronous scenario, giving the name of asynchronous sensing. Below we detail the representations corresponding to these operational scenarios.
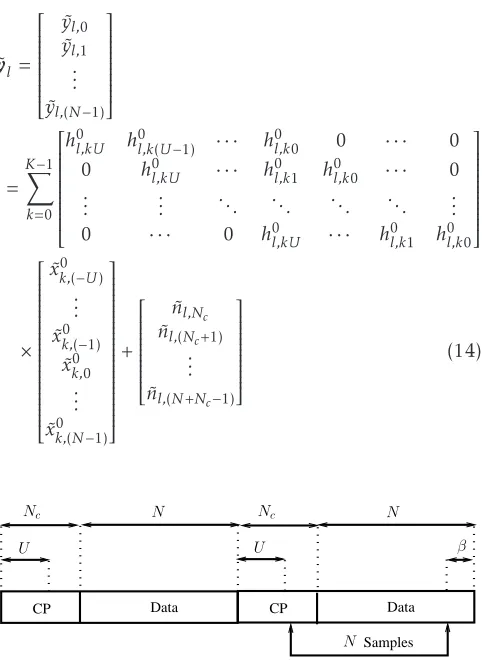
Synchronous Sensing. When a CRSN perfectly synchro-nises with the incoming IFDMA signal, the CP added in the transmitted signals can be removed, yielding anN -length vector ˜yyyl, as seen in Fig.3. The value of thenth element of ˜yyyl is given by
˜
yl,n= ˜yl,′(n+Nc), n= 0, 1,· · · , N−1 (13)
CP Data CP Data
Samples
N
Nc N Nc N
U U
Figure 3. Illustration for the scenario of synchronous sensing.
Furthermore, it can be shown that ˜yyyl can be expressed based on matrix representation as
˜
yyyl = ˜
yl,0 ˜
yl,1
.. .
˜
yl,(N−1) = K−1 X k=0
h0l,kU h0l,k(U−1) · · · h0l,k0 0 · · · 0
0 h0l,kU · · · h0l,k1 h0l,k0 · · · 0
..
. ... . .. . .. . .. . .. ...
0 · · · 0 h0l,kU · · · h0l,k1 h0l,k0
× ˜
x0k,(−U) .. .
˜
x0k,(−1)
˜
x0k,0 .. .
˜
x0k,(N−1)
+ ˜
nl,Nc
˜
nl,(Nc+1)
.. .
˜
nl,(N+Nc−1)
(14)
CP Data CP Data
Samples
N
Nc N Nc N
U
U β
Figure 4. Illustration for the scenario of quai-synchronous
sensing without ISI, where0≤β≤Nc−U.
Quai-Synchronous Sensing without ISI. As an example, Fig. 4 shows a case corresponding to the scenario of quai-synchronous sensing without ISI. In this scenario, the sampling of a CRSN starts β chips before the first symbol ˜xk00, where β∈(0, Nc−U). From Fig. 4 we can see that, when β∈(0, Nc−U), there is no interference from the previous IFDMA symbol on the current IFDMA symbol. Furthermore, from Fig. 4, we can readily know that thenth element of ˜yyyl is given by
˜
yl,n = ˜yl,′(n+Nc−β), n= 0, 1,· · · , N−1 (15)
EAI
European AllianceWhen expressed in matrix form, we have
˜
yyyl = ˜
yl,0 ˜
yl,1
.. .
˜
yl,(N−1) = K−1 X k=0
h0l,kU h0l,k(U−1) · · · h0l,k0 0 · · · 0
0 h0l,kU · · · h0l,k1 h0l,k0 · · · 0
..
. ... . .. . .. . .. . .. ...
0 · · · 0 h0l,kU · · · h0l,k1 h0l,k0
× ˜
x0k,(−U−β) .. .
˜
xk,0(−1)
˜
x0k,0 .. .
˜
xk,0(N−1−β)
+ ˜
nl,(Nc−β)
˜
nl,(Nc+1−β)
.. .
˜
nl,(N+Nc−β−1)
(16)
CP Data CP Data
Samples
N
β
Nc N Nc N
U U
Figure 5. Illustration for the scenario of quai-synchronous
sensing with small ISI, whereNc−U ≤β ≤Nc.
Quai-Synchronous Sensing with Small ISI. The scenario considered is similar as the one considered in Section2.1, except that now (Nc−U ≤β≤Nc). In this case, the samples used for sensing are affected by both
the−1st IFDMA symbol and the 0th IFDMA symbol, as seen in Fig.5.
From Fig.5, we can know that thenth element of ˜yyyl
is given by
˜
yl,n= ˜yl,′(n+Nc−β), n= 0, 1,· · ·, N−1 (17)
Furthermore, it can be shown that ˜yyyl can be expressed in matrix form as
˜
yyyl = ˜
yl,0 ˜
yl,1
.. .
˜
yl,(N−1) = K−1 X k=0
h−l,kU1 h−l,k1(U−1) · · · h−l,k10 0 · · · 0 0 h−l,kU1 · · · hl,k−11 h−l,k10 · · · 0
..
. ... . .. . .. . .. . .. ...
0 · · · 0 h0l,kU · · · h0l,k1 h0l,k0
×
x−N1+N
c−U−β
.. . x−N1−1
x0−Nc .. . x00
.. . x0N−1−β
+ ˜
nl,(Nc−β)
˜
nl,(Nc+1−β)
.. .
˜
nl,(N+Nc−β−1)
(18)
CP Data CP Data
Samples
N
β
Nc N Nc N
U U
Figure 6. Illustration for the scenario of asynchronous sensing,
whereNc≤β < N.
Asynchronous Sensing. Finally, for the scenario of asynchronous sensing, the situation can be seen in Fig. 6, whereNc≤β < N. Hence, the samples used for spectrum sensing depend on two consecutive IFDMA symbols. Thenth entry of ˜yyylcan be expressed as
˜
yl,n = ˜yl,′(n+Nc−β), n= 0, 1,· · · , N−1 (19)
EAI
European Alliancefor Innovation 6 EAI Endorsed Transactions on
which, when in matrix form, can be represented as
˜
yyyl = ˜
yl,0 ˜
yl,1
.. .
˜
yl,(N−1) = K−1 X k=0
h−l,kU1 h−l,k1(U−1) · · · h−l,k10 0 · · · 0 0 h−l,kU1 · · · hl,k−11 h−l,k10 · · · 0
..
. ... . .. . .. . .. . .. ...
0 · · · 0 h0l,kU · · · h0l,k1 h0l,k0
×
xN−1+N
c−U−β
.. . xN−1−1 x0−N
c
.. . x00
.. . xN0−1−β
+ ˜
nl,(Nc−β) ˜
nl,(Nc+1−β)
.. .
˜
nl,(N+Nc−β−1)
(20)
which has the same form as (18). However, we should note that in (18),Nc−U ≤β≤Nc, while in (20)Nc≤
β < N.
After obtaining theNobservation samples, as shown in (14), (16), (18) or (20), the DFT operation is carried out to transform the time-domain observations ˜yyylto the frequency-domain, yielding anN-length vector
˜
Y Y
Yl =FFFNyyy˜l = [ ˜Yl,0, Y˜l,1,· · ·,Y˜l,(N−1)],
l= 1,2, . . . , L (21) where the vth (0≤v ≤N−1) element of ˜YYYl can be expressed as
˜
Yl,v = 1
√
N
N−1 X
n=0 ˜
yl,nexp
−j2πvn N
= √1
N
N−1 X
n=0 ˜
yl,′(n+N
c)exp
−j2πvn N
(22)
In correspondence to the subcarrier mapping oper-ated at the transmitter side, at the CRSN, subcarrier de-mapping is carried out to execute the inverse operation of (5). The corresponding outputs for the kth PR user can be collected into anW-length vector as
˜
Y
YY(lk)= [ ˜Yl,(0k), Y˜l,(k1),· · ·,Y˜l,(k(W) −1)] (23)
in which thewth (0≤w≤W−1) element is ˜
Yl,w(k)= ˜Yl,(wK+k) (24) With the aid of (23), a CRSN can now detect the on/off state of a PR user occupying a certain set of
subcarriers. As, for the purpose of CR sensing, a CR system only needs to know which subcarriers are active or inactive, low-complexity noncoherent detection can be employed. In this contribution, noncoherent energy detection is employed to detect theK PR users’ states. Specifically, three types of local detection rules are investigated, which are referred to as theaverage power assisted detection (APD), majority vote assisted detection (MVD) and the maximum selection assisted detection (MSD). Their details are as follows.
In the context of the APD, the decision rule for detection of the kth PR user by thelth CRSN is given by
δ(l,k)= 1
W
W−1 X
w=0
|Y˜l,w(k)|2H≶0 H1
λAP (25)
whereλAP is a preset threshold for the APD, which is chosen to satisfy a fixed false alarm probability ofPf.
When the MVD is employed, we first set a threshold
λmv>0. By comparing with this threshold, whenever an element ˜Yl,w(k)in ˜YYY(lk)exceedsλmv, the corresponding entry of a newly formed vector ˜YYY′l(k) is flagged by a logical one. Otherwise, it gives a logical zero. Based on ˜YYY′l(k), the local detection is made in the principles of MVD. Specifically, if the number of ones is equal to or more than λMV of the preset threshold, the CRSN renders that the corresponding PR user is on (H1). Otherwise, it decides that the PR is off (H0). In
summary, the decision rule is described as
δ(l,k)= W−1 X
w=0
|Y˜l,w′(k)|2H≶0 H1
λMV (26)
whereλMV is an integer threshold for the MVD. Finally, when MSD is employed, the largest one of ˜YYY(lk) is chosen for making the local decision. The decision rule can be expressed as
δ(l,k)= max{|Y˜ (k) l,0|
2,
|Y˜l,(k1)|2,· · · ,|Y˜l,(k(W) −1)|2}H≶0 H1
λMS (27)
where λMS is the threshold for the MSD, which is chosen for satisfying a fixed false alarm probabilityPf.
After the on/off states of all the K PR users are
detected, the lth CRSN obtains an K-length binary vector holding the on/offstates of theKPR users, which
is expressed assss(lB)= [s(l,B0), sl,(B1),· · ·, sl,(B(K)−1)]. This vector is then mapped to anM-ary number expressed ass(lM), which is transmitted in the FH/MFSK principles, as shown in Fig.1and detailed in the next subsection.
2.2. Signal Processing and Transmission at CRSNs
Let the estimated states by the L CRSNs are collected into a vector sss(M)= [s(M)
1 , s (M) 2 ,· · ·, s
(M)
L ], where s (M) l ∈
EAI
European Alliancefor Innovation 7 EAI Endorsed Transactions on
[0, M−1]. Following the local spectrum sensing, the
L CRSNs convey their local detected states to the FC with the aid of the FH/MFSK techniques. Let the total transmission time of sss(M) to the FC be Ts seconds, which is referred to as the symbol duration. This symbol duration is equally divided into L potions referred to astime-slotshaving the durationTh=Ts/L. Each CRSN uses one time-slot to send its detected states to the FC. As previously mentioned, the FH/MFSK scheme has M orthogonal sub-frequency bands, their centre frequencies are represented by FFF={f0, f1, . . . , fM−1}. These M frequencies are used for both FH and MFSK modulation, which are implemented as follows. Letaaa= [a1, a2,· · ·, aL] be a FH address used for FH operation, where al∈ {0,1,· · · , M−1}, l= 1,2, . . . , L. With the aid the FH operation, different CRSNs may convey
their signals on different sub-frequency bands. The
operation enhances the diversity capability for final signal detection at the FC, expecially, when some of the CRSNs are close to each other, resulting in correlation in the space domain.
After processing sss(M) using the FH address aaa, we obtain
mmm= [m1, m2,· · ·, mL] =sss(M)⊕aaa =
s(1M)⊕a1, s (M)
2 ⊕a2,· · ·, s (M) L ⊕aL
(28)
where ⊕ represents the addition operation in the Galois field of GF(M). Therefore, the value of ml (l = 1,2, . . . , L) is within [0, M−1] and is suitable for MFSK modulation. Following the FH operation, as shown in Fig. 1, the components of mmm are mapped to the MFSK’s sub-frequencies FFFm={fm1, fm2, . . . , fml}, where
fml ∈FFF. Finally, the MFSK signals of theL CRSNs are
transmitted one-by-one to the FC in a time-division fashion using L time-slots of duration Th. Specifically, the signal transmitted by thelth CRSN duringiTs< t ≤ (i+ 1)Tscan be expressed in complex form as
sl(t) =
√
PψTh[t−iTs−(l−1)Th]
×exp[j2π(fc+fml)t+jφl], l= 1,2, . . . , L (29)
where P denotes the transmission power, which is assumed the same for all theL CRSNs, fc is the main carrier frequency andφl is the initial phase introduced by carrier modulation. In (29), ψTh(t) is the
pulse-shaped signalling waveform, which is defined over the interval [0, Th) and satisfies the normalisation of RTh
0 ψ
2(t)dt=T h.
Assuming that the signals as shown in (29) are transmitted via flat Rayleigh fading channels to the FC, the received signal duringiTs< t≤(i+ 1)Tscan then be
expressed as
rl(t) =hlsl(t) +nl(t)
=√PhlψTh[t−iTs−(l−1)Th] ×exp[j2π(fc+fml)t+jφl] +n(t),
l= 1,2, . . . , L, (30) where hl =αlexp(jθl) denotes the channel gain with respect to the lth CRSN, which is assumed constant over one symbol-duration. In (29),n(t) is the Gaussian noise process presenting at the FC, which has zero mean and single-sided power-spectral density (PSD) ofN0per dimension.
3. Fusion Processing
When the FC receives the signal rl(t), l = 1,2,· · ·, L, final decision is made with the aid of one of the two noncoherent fusion rules, namely the conventional EGC fusion rule and the ES-EGC fusion rules, which are detailed as follows.
First, for both the fusion rules,M decision variables are formed for every of theLCRSNs, which are
Rml =
1
√
ΩPTh
Z iTs+(l+1)Th
iTs+lTh
rl(t)ψ∗Th[t−iTs−(l−1)Th]
×exp[−j2π(fc+fm)t]dt 2
,
m= 0,1, . . . , M−1; l= 1,2, . . . , L (31)
whereΩ=E[|hl|2] denotes the average channel power.
Since the M sub-frequency bands used for FH/MFSK are assumed to be orthogonal to each other, there is no interference between any two sub-frequency bands. Consequently, upon substituting (30) into (31) and absorbing the carrier phaseφlintohl, we obtain
Rml =
µmmlhl √
Ω +Nml
2
, m=0,1, . . . , M−1;
l=1,2, . . . , L (32) where, by definition, µmm = 1, while µmml = 0, if m,
ml. In (32), Nml is a complex Gaussian noise sample collected from themth sub-frequency band during the
lth time-slot, which is given by
Nml = 1
√
ΩPTh
Z iTs+(l+1)Th
iTs+lTh
n(t)ψ∗Th[t−iTs−(l−1)Th]
×exp[−j2π(fc+fm)t]dt (33)
It can be shown thatNml has mean zero and a variance of LN0/(ΩEs) =L/γ¯s, where Es =PTs represents the total energy with each CRSN’s transmitted energy per symbol beingEh=Es/L, while ¯γs =ΩEs/N0denotes the average SNR per symbol.
EAI
European Alliancefor Innovation 8
Using the ML values shown in (32), we can form a time-frequency matrixRRRof (M×L), where each column holdsMdecision variables in the form of (32). Based on
RRR, the FC carries out the final detection in the principles of EGC or ES-EGC fusion rule.
3.1. EGC Fusion Rule
In the context of the EGC fusion rule, the FC makes the final decision based on the time-frequency matrix as follows.
1. Frequency de-hopping to form a detection
matrix:
D
DD=RRR⊟(111⊗aaaT) (34) where 111 denotes an all-one column vector of
M-length and ⊗ denotes the Kronecker product operation between two matrices [19]. In (34), the operation ofAAA⊟BBBshifts the elements inAAAbased on the values provided by BBB1. Specifically, after the operation in (34), a detection matrix DDD is formed as
D(m⊖al)l =Rml, m=0,1, . . . , M−1;
l =1,2, . . . , L (35) where ⊖ denotes the subtraction operation in the Galois field ofGF(M). The operation in (35) means that the element indexed by m in RRR is changed to the one indexed bym′=m⊖al inDDD.
2. EGC detection: Based on the detection matrixDDD,
M decision variables for final spectrum sensing are formed under the EGC principles [19] as
Dm= L X
l=1
Dml, m= 0,1, . . . , M−1 (36)
Finally, the largest one of {D0, D1,· · ·, DM−1} is selected and its index is mapped to an integer in the range [0, M−1], which represents theM-ary estimation of theK PR users’ on/offstates. Then,
theM-ary integer is converted to a binary vector of K-length, whose K elements give the on/off
states of theK PR users.
3.2. ES-EGC Fusion Rule
In our SSN, there are mainly two sources resulting in that the FC makes erroneous decisions. The first one is the incorrect detection made by the CRSNs. In this case,
1Note that, the element-shift operations do not change the values of
the elements inAAA. Instead, the locations of the elements in matrix A
A
A are shifted to the other locations based on the values of the corresponding elements inBBB.
the CRSNs directly send the FC incorrect information. Secondly, the wireless channels between CRSNs and FC are non-ideal, which also introduce errors. Statistically, when an element in the detection matrix DDD contains both signal and noise, its energy will be higher than that of the element containing only noise. This implies that, if an element in the undesired rows (the rows not matching to the states of the PR users) has high energy, it might be an erroneous element introduced by what the above-mentioned. Straightforwardly, this type of elements in the undesired rows may significantly degrade the detection performance of the FC.
Based on the above observation, in this contribution, the ES-EGC fusion rule is employed. When operated under this fusion rule, in each of the M rows of the detection matrix DDD, a given number of entries with the highest values are removed before forming the
M decision variables based on the EGC principles. As a result, the errors transmitted by the CRSNs might be removed, especially, when the signal-to-noise ratio (SNR) is relatively high. As our performance results in Section4show, this error-erasing process will significantly enhance the detection performance of the FC.
In detail, the ES-EGC fusion rule is operated as follows.
1. Frequency de-hopping to form the detection
matrixDDD, which is the same as that done by the
EGC fusion rule.
2. Erasure operation: After obtaining DDD, the
ES-EGC fusion rule carries out the erasure opera-tions. In each of the M rows of DDD, I (0≤I < L) elements corresponding to theI largest values are replaced by the value of zero, which results in a new matrix ¯DDD.
3. EGC detection: M decision variables are formed
based on the matrix ¯DDDin EGC principles [19] as
¯
Dm= L X
l=1 ¯
Dml, m= 0,1, . . . , M−1 (37)
Finally, the largest of {D¯0,D¯1,· · ·,D¯(M−1)} is selected and its index value in terms ofm repre-sents theM-ary estimation of value conveyed by the CRSNs. Furthermore, after mapping theM -ary value to the bin-ary representation, the on/off
states of theKPR users can be estimated.
4. Spectrum Sensing Performance
In this section, both the local spectrum sensing at CRSNs and the overall detection performance at the FC are investigated via simulations. Specifically, we consider the local missing probability, Pm, of the
EAI
European Alliancefor Innovation 9
sensing at CRSNs and the overall missing probability,
PM, of the detection at the FC. At the CRSNs, we assume that the signals received from the PR users experience multipath Rayleigh fading. We compare the local missing probability of different detection
approaches and show the influence of the thresholds applied for detection. At the FC, the overall spectrum sensing performance is investigated, when assuming that random FH addresses are used for transmitting the local decisions made by the CRSNs to the FC, and that the wireless channels from the CRSNs to the FC experience independent Rayleigh fading.
Note that, the parameters used in our simulations for each of the figures are detailed associated with the figure. In the figures, the ‘Observation SNR at each CRSN’ is the average SNR per PR user received at a CRSN. The false-alarm probability of all the CRSNs is assumed the same, which is expressed as Pf. The ‘Channel SNR per bit’ is the average received SNR at the FC per bit given by ¯γb= ¯γs/b, where b= log2M denotes the number of bits required to represent aM -ary number.
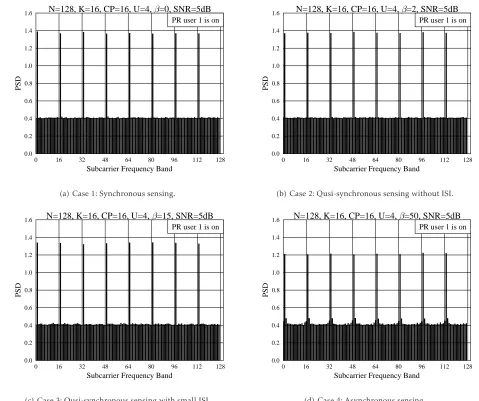
Fig. 7 shows the impacts of the four scenarios, as shown in Section 2.1, which address the synchronisa-tion between the received signals from PR users and the sensing, on the PSDs of the received signals. As shown on the top of the figure, we consider an IFDMA PR system, which employsN = 128 subcarriers to support maximum K = 16 uplink users. Hence, each PR user occupiesW = 8 subcarriers evenly distributed over the 128 subcarriers, as indicated by the eight dominant spectral lines in each of the four figures. We assume that, in the PR system, only user 1 is on, while all the other PR users are idle. Signals received by CRSNs from the PR users are assumed to experience multipath Rayleigh fading having (U + 1) = 5 time-domain resolv-able paths. As shown in Section 2.1, the value of the parameterβreflects the synchronisation level between the PR signals and the local sensing. Specifically, we set β = 0, 2, 15 and 50, respectively, for the scenar-ios of synchronous sensing, qusi-synchronous sensing without ISI, qusi-synchronous sensing with small ISI and asynchronous sensing. From the results shown in the figures, we can clearly see that, when the sens-ing becomes more asynchronous with the arrival PR signals, inter-carrier interference increases, i.e., more power leaks from the activated subcarriers to their neighbouring subcarriers. However, at 5 dB of the SNR, the activated subcarriers stand out explicitly and have significantly higher power than the other idle subcarri-ers.
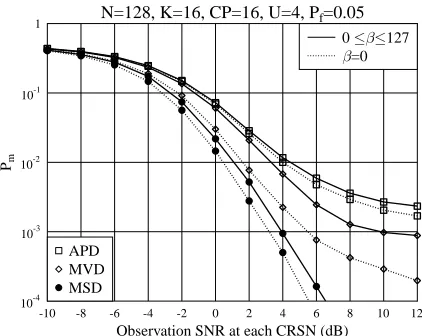
In Fig. 8, we investigate the performance of the three types of energy-based detection schemes, namely, the APD, MVD and the MSD, when the false-alarm probability of local CRSNs is set as Pf = 0.05. In the figure, β= 0 stands for the scenario of
10-4 10-3 10-2 10-1 1
Pm
-10 -8 -6 -4 -2 0 2 4 6 8 10 12
Observation SNR at each CRSN (dB)
N=128, K=16, CP=16, U=4, Pf=0.05
APD MVD MSD
0 127
=0
Figure 8. Missing probability of the local CRSNs sensing the
spectrum of an IFDMA system using 128 subcarriers to support maximum16users, when communicating over multipath Rayleigh fading channels having 5time-domain resolvable paths.
synchronous sensing. By contrast, 0≤β≤127 means that β is a random variable taking integer values uniformly in [0,127], which provides the average performance achieved by the four synchronisation scenarios considered. From Fig. 8, first, we can see that the MVD outperforms the APD, and that the MSD achieves the best sensing performance among the three local detection schemes. Second, the synchronous sensing results in the best local sensing performance, as there is no inter-carrier interference.
10-4 10-3 10-2 10-1 1
Pm
-10 -8 -6 -4 -2 0 2 4 6 8 10 12
Observation SNR at each CRSN (dB)
N=128, K=16, CP=16, U=4, Pf=0.05
MV=2 MV=3 MV=4 MV=5
0 127
=0
Figure 9. Missing probability of the local CRSNs sensing the
spectrum of an IFDMA system with 128 subcarriers to support maximum16users, when the MVD associated with various values forλMV is employed.
In Fig.9, we illustrate the local sensing performance of the CRSNs employing MVD, when the thresholds areλMV = 2, 3, 4 and 5. Similarly to Fig.8, in Fig. 9
EAI
European Alliance0.0 0.2 0.4 0.6 0.8 1.0 1.2 1.4 1.6
PSD
0 16 32 48 64 80 96 112 128
Subcarrier Frequency Band
N=128, K=16, CP=16, U=4, =0, SNR=5dB
PR user 1 is on
(a) Case 1: Synchronous sensing.
0.0 0.2 0.4 0.6 0.8 1.0 1.2 1.4 1.6
PSD
0 16 32 48 64 80 96 112 128
Subcarrier Frequency Band
N=128, K=16, CP=16, U=4, =2, SNR=5dB
PR user 1 is on
(b) Case 2: Qusi-synchronous sensing without ISI.
0.0 0.2 0.4 0.6 0.8 1.0 1.2 1.4 1.6
PSD
0 16 32 48 64 80 96 112 128
Subcarrier Frequency Band
N=128, K=16, CP=16, U=4, =15, SNR=5dB
PR user 1 is on
(c) Case 3: Qusi-synchronous sensing with small ISI.
0.0 0.2 0.4 0.6 0.8 1.0 1.2 1.4 1.6
PSD
0 16 32 48 64 80 96 112 128
Subcarrier Frequency Band
N=128, K=16, CP=16, U=4, =50, SNR=5dB
PR user 1 is on
(d) Case 4: Asynchronous sensing.
Figure 7. Power spectral density presenting at the CRSNs in an IFDMA system using128subcarriers to support maximum16users,
when communicating over multipath Rayleigh fading channels having5time-domain resolvable paths. The results were obtained from 10000realisations.
both the synchronous sensing (β= 0) and the random asynchronous sensing (0≤β ≤127) are considered. From the results of Fig. 9, again, we observe that the synchronous sensing outperforms the asynchronous sensing. For both the cases, we see thatλmv= 3 results in the lowest missing probability, when the SNR is relatively high, which implies that there exists an optimal value for the threshold, resulting in that the MVD-assisted local sensing attains the lowest missing probability.
Fig. 10 portrays the sensing performance of the MSD detection scheme in the context of the four scenarios considered in Section2.1. As our discussion in Section2.1shows, when the CRSNs are operated in the scenarios of synchronous sensing or quai-synchronous sensing without ISI, there is no interference from a
previous IFDMA symbol on the current IFDMA symbol. As shown in Fig. 10, we are unable to distinguish between the performance of these two scenarios. By contrast, when there is small or large ISI, corresponding to the scenarios of quai-synchronous sensing with small ISI and asynchronous sensing, the performance of local CRSNs degrades explicitly, in comparison with that of the scenarios of synchronous sensing and quai-synchronous sensing without ISI. Furthermore, the missing probability achieved under the scenario of asynchronous sensing is higher than that achieved under the scenario of quai-synchronous sensing with small ISI.
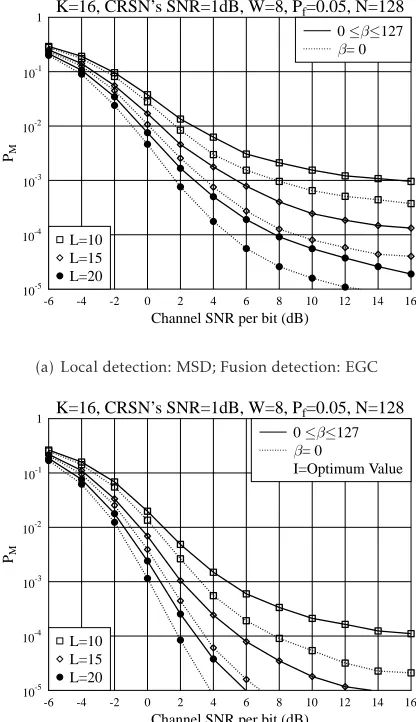
Fig. 11 shows the overall missing probability of the cognitive SSNs with various numbers of CRSNs, when the local CRSNs employs the MSD. In the studies,
EAI
European Alliance10-4 10-3 10-2 10-1 1
Pm
-10 -8 -6 -4 -2 0 2 4 6 8 10 12
Observation SNR at each CRSN (dB)
N=128, K=16, CP=16, U=4, Pf=0.05
Synchronous sensing Quai-synchronous sensing without ISI Quai-synchronous sensing with small ISI Asynchronous sensing
Figure 10. Missing probability of the MSD-assisted CRSNs
sensing an IFDMA system using 128 subcarriers for supporting maximum16users, when four sensing scenarios are considered.
we assume an IFDMA system which has in total N= 128 subcarriers and supports maximumK = 16 users. Hence, each active user uses W = 8 subcarrier for uplink communications. At the FC, both the EGC fusion rule (Fig.11(a)) and ES-EGC fusion rule (Fig.11(b)) are considered. Furthermore, when the ES-EGC fusion rule is employed, we assume that an optimum number of entries per row are erased, which yields the best overall detection performance. From the results of Fig. 11(a)
and Fig.11(b), first, we can explicitly see that the overall missing probability decreases, as the number of CRSNs increases from L= 10 to L= 15 and to L= 20, owing to the improvement of spatial diversity. Second, similar as the detection at the CRSNs, the overall detection performance of the system with synchronous sensing corresponding to (β= 0) is better than that achieved by the systems using asynchronous sensing. Finally, when comparing Fig. 11(b) with Fig. 11(a), we can clearly see that the ES-EGC fusion rule outperforms the EGC fusion rule, which becomes more significant, when the channel SNR increases.
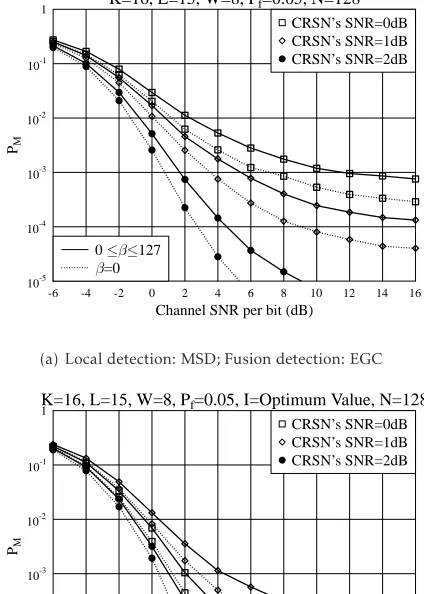
Finally, in Fig. 12, the overall missing probability performance of the cognitive SSN is investigated, when different observation SNR is assumed for the CRSNs.
From Fig.12, we can have similar observations as that from Fig.11. Again, we can find that the ES-EGC fusion rule outperforms the EGC fusion rule, which becomes more explicit, as the SNR of the channels from CRSNs to FC increases.
5. Conclusion
A FH/MFSK SSN has been proposed for spectrum sensing of an uplink IFDMA PR system. In the FH/MFSK SSN, a number of CRSNs are employed for initial detection of the on/off states of the users
10-5 10-4 10-3 10-2 10-1 1
PM
-6 -4 -2 0 2 4 6 8 10 12 14 16
Channel SNR per bit (dB)
K=16, CRSN’s SNR=1dB, W=8, Pf=0.05, N=128
L=10 L=15 L=20
0 127
= 0
(a) Local detection: MSD; Fusion detection: EGC
10-5 10-4 10-3 10-2 10-1 1
PM
-6 -4 -2 0 2 4 6 8 10 12 14 16
Channel SNR per bit (dB)
K=16, CRSN’s SNR=1dB, W=8, Pf=0.05, N=128
L=10 L=15 L=20
0 127
= 0
I=Optimum Value
(b) Local detection: MSD; Fusion detection: ES-EGC
Figure 11. Overall missing probability of the cognitive spectrum
sensing systems with different numbers of CRSNs, when the MSD local detection and the EGC or ES-EGC assisted fusion detection are employed.
supported the IFDMA PR system. At the CRSNs, four synchronisation scenarios have been assumed between received IFDMA signals and CRSN detectors, which are the synchronous sensing, quai-synchronous sensing without ISI, quai-synchronous sensing with small ISI and the asynchronous sensing. Our investigation shows that the sensing performance slightly degrades, as the received IFDMA signals and CRSN detectors become more asynchronised. However, the FH/MFSK SSN is usually capable of achieving reliable sending, even in the case of asynchronous sensing, owing to the space-and frequency-diversity provided by the FH/MFSK SSN and the IFDMA system, respectively. In this paper, three low-complexity energy detection schemes, namely, the APD, MVD and the MSD, have been studied in conjunction with the CRSN detection, showing that
EAI
European Alliancefor Innovation 12
10-5 10-4 10-3 10-2 10-1 1
PM
-6 -4 -2 0 2 4 6 8 10 12 14 16
Channel SNR per bit (dB)
K=16, L=15, W=8, Pf=0.05, N=128
CRSN’s SNR=0dB CRSN’s SNR=1dB CRSN’s SNR=2dB
0 127
=0
(a) Local detection: MSD; Fusion detection: EGC
10-5 10-4 10-3 10-2 10-1 1
PM
-6 -4 -2 0 2 4 6 8 10 12 14 16
Channel SNR per bit (dB)
K=16, L=15, W=8, Pf=0.05, I=Optimum Value, N=128
CRSN’s SNR=0dB CRSN’s SNR=1dB CRSN’s SNR=2dB
0 127
=0
(b) Local detection: MSD; Fusion detection: ES-EGC
Figure 12. Overall missing probability of the cognitive SSN with
the MSD for local detection and EGC or ES-EGC assisted fusion detection, when the CRSNs have various observation SNRs.
the MVD outperforms the APD and the MSD achieves the best sensing reliability among the three. At the FC, the states of the users supported by the IFDMA PR system are finally detected either by the EGC detection scheme or the ES-EGC detection scheme. Our studies demonstrate that the ES-EGC scheme is able to suppress the sensing errors made by CRSNs, and to achieve much higher sensing reliability than the EGC scheme, when the sensing at CRSNs is unreliable.
References
[1] T. Yucek and H. Arslan, “A survey of spectrum sensing algorithms for cognitive radio applications,”
IEEE Communications Surveys Tutorials, vol. 11, pp. 116 – 130, First Quarter 2009.
[2] A. Kortun, T. Ratnarajah, M. Sellathurai, C. Zhong, and C. B. Papadias, “On the performance of eigenvalue-based
cooperative spectrum sensing for cognitive radio,”IEEE
Journal of Selected Topics in Signal Processing, vol. 5, pp. 49 – 55, February 2011.
[3] Y. Zeng and Y.-C. Liang, “Eigenvalue-based spectrum
sensing algorithms for cognitive radio,” IEEE
Transac-tions on CommunicaTransac-tions, vol. 57, pp. 1784 – 1793, June 2009.
[4] L. Wei and O. Tirkkonen, “Cooperative spectrum sensing of OFDM signals using largest eigenvalue distributions,” inIEEE 20th International Symposium on Personal, Indoor and Mobile Radio Communications, pp. 2295 – 2299, September 2009.
[5] E. Axell, G. Leus, and E. G. Larsson, “Overview of
spectrum sensing for cognitive radio,” in2nd
Interna-tional Workshop on Cognitive Information Processing (CIP), pp. 322 – 327, June 2010.
[6] F. F. Digham, M.-S. Alouini, and M. K. Simon, “On the energy detection of unknown signals over fading channels,”IEEE Transactions on Communications, vol. 55, pp. 21 – 24, January 2007.
[7] J. J. Lehtomaki, M. Juntti, H. Saarnisaari, and S. Koivu, “Threshold setting strategies for a quantized total power
radiometer,” IEEE Signal Processing Letters, vol. 12,
pp. 796 – 799, November 2005.
[8] J. Ma, G. Y. Li, and B. H. Juang, “Signal processing in cognitive radio,”Proceedings of the IEEE, vol. 97, pp. 805 – 823, May 2009.
[9] A. V. Dandawate and G. B. Giannakis, “Statistical tests
for presence of cyclostationarity,” IEEE Transactions on
Signal Processing, vol. 42, pp. 2355 – 2369, September 1994.
[10] W. A. Gardner and C. M. Spooner, “Signal interception: performance advantages of cyclic-feature detectors,”
IEEE Transactions on Communications, vol. 40, pp. 149 – 159, January 1992.
[11] R. Tandra and A. Sahai, “SNR walls for signal detection,”
IEEE Journal of Selected Topics in Signal Processing, vol. 2, pp. 4 – 17, February 2008.
[12] T. J. Lim, R. Zhang, Y.-C. Liang, and Y. Zeng,
“GLRT-based spectrum sensing for cognitive radio,” in IEEE
Global Telecommunications Conference (GLOBECOM’08), pp. 1 – 5, November 2008.
[13] S. Wang and R. Nazanin, “Eigenvalue-based cooperative
spectrum sensing with finite samples/sensors,” in46th
Annual Conference on Information Sciences and Systems (CISS), pp. 1 – 5, March 2012.
[14] A. Kortun, M. Sellathurai, T. Ratnarajah, and C. Zhong, “Distribution of the ratio of the largest eigenvalue to the
trace of complex Wishart matrices,”IEEE Transactions on
Signal Processing, vol. 60, pp. 5527 – 5532, October 2012. [15] B. Nadler, F. Penna, and R.Garello, “Performance of eigenvalue-based signal detectors with known and
unknown noise level,” inIEEE International Conference
on Communications (ICC), pp. 1 – 5, June 2011.
[16] P. Bianchi, M. Debbah, M. Maida, and J. Najim, “Per-formance of statistical tests for single-source detection
using random matrix theory,”IEEE Transactions on
Infor-mation Theory, vol. 57, pp. 2400 – 2419, April 2011. [17] W. Zhang and Y. Sanada, “Cyclostationarity feature
matched detection and application to IFDMA system,”
EAI
European Alliancefor Innovation 13
in 4th International Conference on Cognitive Radio Ori-ented Wireless Networks and Communications (CROWN-COM’09), pp. 1 – 5, 2009.
[18] F. Yang and L.-L. Yang, “Frequency-hopping/M-ary frequency-shift keying wireless sensor networks with
soft-sensing,” in 1st IEEE International Conference on
Communications in China (ICCC’12), pp. 751 – 756, 2012.
[19] L.-L. Yang, Multicarrier Communications. United
Kingdom: John Wiley, 2009.
[20] F. Yang and L.-L. Yang, “Frequency-hopping/M-ary frequency-shift keying wireless sensor network
moni-toring multiple source events,” in IEEE 75th Vehicular
Technology Conference (VTC’12 Spring), pp. 1 – 5, 2012.
EAI
European Alliancefor Innovation 14