Vassa S.P. et al www.ajprd.com 137
Asian Journal of Pharmaceutical Research and Development
(An International Peer-Reviewed Journal of Pharmaceutical Research and Development)
www.ajprd.com
ISSN 2320-4850
Research Article
DEVELOPMENT AND VALIDATION OF
UV-SPECTROPHOTOMETRIC METHOD FOR SIMVASTATIN IN
BULK AND TABLET DOSAGE FORM BY USING AREA UNDER
CURVE (AUC) METHOD.
Rishi Kumar Joshi1, S.P. Vassa*1
1Department of Quality assurance techniques, Sinhgad college of pharmacy, Vadgaon (Bk), Pune- Maharashtra.
India.
Received: 13 April 2013, Revised and Accepted: 30 April 2013
ABSTRACT
Simvastatin is used as hypolipidaemic agent for the treatment of congestive heart disease (CHD) and atherosclerosis. A simple, accurate, precise and economic spectrophotometric method was developed and validated for the estimation of simvastatin using area under curve method. Methanol was used as solvent and all parameters were validated as per ICH guideline Q2(R1). The wavelength of maximum absorption for Simvastatin was found to be at 238 nm. The method obeyed Beer-Lambert’s law and indicated by the calibration curve in the range 2-12µ g/ml. The regression equation was y= 0.0969x-0.0051. The Correlation coefficient was found to be 0.9995. LOD and LOQ were calculated as 0.0703µ g/ml and 0.2130µg/ml respectively. The developed method can be used for quantitative estimation of simvastatin in bulk and pharmaceutical dosage forms.
Key-words: Simvastatin, Area under curve, UV-spectrophotometry.
INTRODUCTION
tatins are cholesterol-lowering agents
that reversibly inhibit HMG-CoA
reductase, which catalyzes a rate-limiting step in cholesterol biosynthesis [1].These agents are structural analogues of HMG-CoA(3-hydroxy-3-methylglutaryl-coenzyme A) [2]. As HMG-CoA reductase activity is maximum at midnight, all statins are administered at bed time to obtain maximum effectiveness [3].The liver is their target organ, and decreased hepatic cholesterol synthesis ultimately leads to increased removal of LDL particles from the circulation [4].
* Corresponding author
Mrs. Swetal P. Vassa
Department of Quality Assurance Techniques Sinhgad College of Pharmacy,
Vadgaon (Bk), Pune-411041,
Maharashtra, India.
Email: [email protected]
Hyperlipidaemia is one of the major clinical
sequels for acute pancreatitis and
atherosclerosis [2]. These agents decrease the risk of a first heart attack in subjects and In addition decrease clinical expression of heart disease. This category includes Lovastatin, Simvastatin, Pravastatin, Atorvastatin and Rosuvastatin [3].
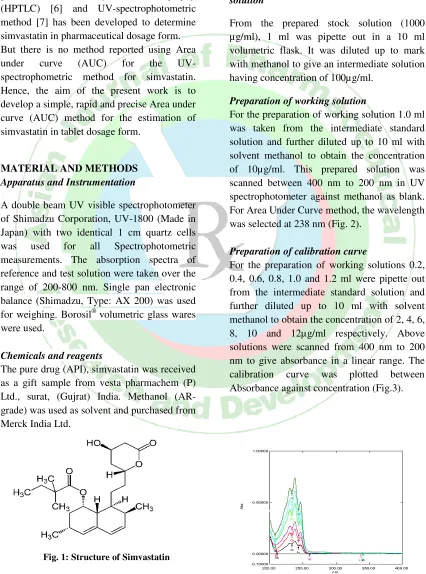
Simvastatin is an inactive lactone prodrug (Fig. 1) that is hydrolysed in gastrointestinal tract to its active β-hydroxyl derivative. It is a butanoic acid derivative,chemically called as 2,2-dimethyl-1,2,3,7,8,8a-hexahydro-3,7-
dimethyl-8-[2-(tetrahydro-4-hydroxy-6-oxo-2H-pyran-2-yl)ethyl]-1-naphthalenyl ester.
Simvastatin is a potent inhibitor of HMG-CoA .The inhibition of the HMG-HMG-CoA causes a decrease in LDL, triglycerides (10–20 %),
while it increases HDL, high-density
Vassa S.P. et al www.ajprd.com 138 lipoprotein (5–15%) and LDL receptor
expression. Oral absorption is better and first pass metabolism is extensive; t1/2 is 2-3 hr.
Simvastatin is official in Indian
Pharmacopoeia, British Pharmacopoeia and United States Pharmacopeia. The literature survey revealed that High performance liquid
chromatography (HPLC) [5], High
performance thin layer chromatography
(HPTLC) [6] and UV-spectrophotometric method [7] has been developed to determine simvastatin in pharmaceutical dosage form. But there is no method reported using Area
under curve (AUC) for the
UV-spectrophometric method for simvastatin. Hence, the aim of the present work is to develop a simple, rapid and precise Area under curve (AUC) method for the estimation of simvastatin in tablet dosage form.
MATERIAL AND METHODS Apparatus and Instrumentation
A double beam UV visible spectrophotometer of Shimadzu Corporation, UV-1800 (Made in Japan) with two identical 1 cm quartz cells
was used for all Spectrophotometric
measurements. The absorption spectra of reference and test solution were taken over the range of 200-800 nm. Single pan electronic balance (Shimadzu, Type: AX 200) was used for weighing. Borosil® volumetric glass wares were used.
Chemicals and reagents
The pure drug (API), simvastatin was received as a gift sample from vesta pharmachem (P) Ltd., surat, (Gujrat) India. Methanol (AR-grade) was used as solvent and purchased from Merck India Ltd.
Preparation of standard stock solution
A stock solution of simvastatin was prepared by dissolving 10 mg of simvastatin in methanol and diluting it up to 10 ml in 10 ml volumetric flask. The final drug concentration was 1 mg/ ml or 1000 µg/ml.
Preparation of intermediate standard solution
From the prepared stock solution (1000 µg/ml), 1 ml was pipette out in a 10 ml volumetric flask. It was diluted up to mark with methanol to give an intermediate solution having concentration of 100µg/ml.
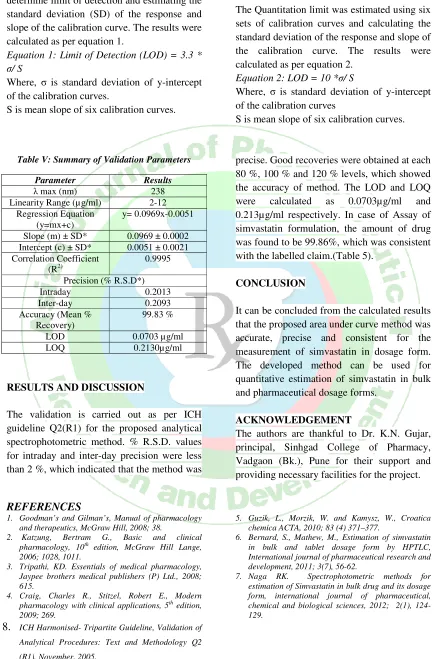
Preparation of working solution
For the preparation of working solution 1.0 ml was taken from the intermediate standard solution and further diluted up to 10 ml with solvent methanol to obtain the concentration of 10µg/ml. This prepared solution was scanned between 400 nm to 200 nm in UV spectrophotometer against methanol as blank. For Area Under Curve method, the wavelength was selected at 238 nm (Fig. 2).
Preparation of calibration curve
For the preparation of working solutions 0.2, 0.4, 0.6, 0.8, 1.0 and 1.2 ml were pipette out from the intermediate standard solution and further diluted up to 10 ml with solvent methanol to obtain the concentration of 2, 4, 6, 8, 10 and 12µg/ml respectively. Above solutions were scanned from 400 nm to 200 nm to give absorbance in a linear range. The
calibration curve was plotted between
Absorbance against concentration (Fig.3).
Fig. 1: Structure of Simvastatin Fig. 2: UV-spectra of Simvastatin
Vassa S.P. et al www.ajprd.com 139
Fig. 3: Calibration Curve of Simvastatin (2-12
µg/ml) Fig. 4: AUC for Simvastatin (10µg/ml)
Assay of tablet formulation
Twenty tablets of simvastatin (SIMLO manufactured by Ipca Laboratories limited, Label Claim: 10 mg of simvastatin per tablet) were accurately weighed and powdered. Powder equivalent to 10 mg of simvastatin was accurately weighed and transferred into a 100 ml volumetric flask. About30 ml of
methanol was added to dissolve the drug. The contents were sonicated and further diluted up to 100 ml with methanol. The solution was filtered with Whatmann filter paper No.41 and the first 5 ml of filtrate was discarded. The filtrate was further subjected for UV analysis. The procedure was repeated in triplicate. (Table No.1)
Table I: Assay of Tablet dosage form
Tablet solution containing Simvastatin(µg/ml)
% Found Mean %
Found* % RSD*
10 99.80
10 99.69 99.86 0.21
10 100.10
*n=3
Method validation
The objective of validation of an analytical procedure is to demonstrate whether the procedure is suitable for its intended purpose. The proposed method was validated for
various parameters such as Linearity,
Accuracy, Precision, Limit of detection (LOD) and Limit of Quantitation (LOQ) according to ICH Q2 (R1) guideline [8].
Linearity and Range
The linearity was evaluated by linear regression analysis. The correlation coefficient was used to determine linearity of simvastatin (2-12 µg/ml). Calibration curve of Area under curve vs. Concentration was plotted and regression line equation and correlation coefficient were determined (Figure 3; Table 2).
Vassa S.P. et al www.ajprd.com 140 Conc.(µg/ml) Wavelength(238±5nm) Divisor Area Result
Start End
2 233.00 243.00 1.000 0.180 0.180
4 233.00 243.00 1.000 0.383 0.383
6 233.00 243.00 1.000 0.570 0.570
8 233.00 243.00 1.000 0.776 0.776
10 233.00 243.00 1.000 0.978 0.978
12 233.00 243.00 1.000 1.145 1.145
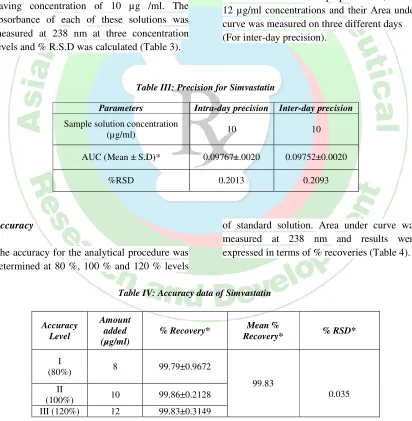
Precision
Precision has been measured at three levels viz. repeatability, intraday precision and inter-day precision. The term standard deviation is used to express the precision of any analytical procedure. In repeatability, six different standard solutions were prepared each of having concentration of 10 µg /ml. The absorbance of each of these solutions was measured at 238 nm at three concentration levels and % R.S.D was calculated (Table 3).
For intraday precision nine different solutions were prepared of 8, 10 and 12 µg /ml with three replicates of each and their Area under curve was measured at 238 nm on the same day and % R.S.D was calculated. Three different solutions were prepared of 8, 10 and 12 µg/ml concentrations and their Area under curve was measured on three different days (For inter-day precision).
Table III: Precision for Simvastatin
Parameters Intra-day precision Inter-day precision
Sample solution concentration
(µg/ml) 10 10
AUC (Mean ± S.D)* 0.09767±.0020 0.09752±0.0020
%RSD 0.2013 0.2093
Accuracy
The accuracy for the analytical procedure was determined at 80 %, 100 % and 120 % levels
of standard solution. Area under curve was measured at 238 nm and results were expressed in terms of % recoveries (Table 4).
Table IV: Accuracy data of Simvastatin
*n=3
Limit of Detection (LOD) Accuracy
Level
Amount added (µg/ml)
% Recovery* Mean %
Recovery* % RSD*
I
(80%) 8 99.79±0.9672
99.83
0.035 II
(100%) 10 99.86±0.2128
Vassa S.P. et al www.ajprd.com 141 Six sets of calibration curves were used to
determine limit of detection and estimating the standard deviation (SD) of the response and slope of the calibration curve. The results were calculated as per equation 1.
Equation 1: Limit of Detection (LOD) = 3.3 *
σ/ S
Where, σ is standard deviation of y-intercept of the calibration curves.
S is mean slope of six calibration curves.
Limit of Quantitation (LOQ)
The Quantitation limit was estimated using six sets of calibration curves and calculating the standard deviation of the response and slope of the calibration curve. The results were calculated as per equation 2.
Equation 2: LOD = 10 *σ/ S
Where, σ is standard deviation of y-intercept of the calibration curves
S is mean slope of six calibration curves.
Table V: Summary of Validation Parameters
Parameter Results
λ max (nm) 238
Linearity Range (µg/ml) 2-12 Regression Equation
(y=mx+c)
y= 0.0969x-0.0051
Slope (m) ± SD* 0.0969 ± 0.0002 Intercept (c) ± SD* 0.0051 ± 0.0021 Correlation Coefficient
(R2)
0.9995
Precision (% R.S.D*)
Intraday 0.2013
Inter-day 0.2093
Accuracy (Mean % Recovery)
99.83 %
LOD 0.0703 µg/ml
LOQ 0.2130µg/ml
RESULTS AND DISCUSSION
The validation is carried out as per ICH guideline Q2(R1) for the proposed analytical spectrophotometric method. % R.S.D. values for intraday and inter-day precision were less than 2 %, which indicated that the method was
precise. Good recoveries were obtained at each 80 %, 100 % and 120 % levels, which showed the accuracy of method. The LOD and LOQ
were calculated as 0.0703µg/ml and
0.213µg/ml respectively. In case of Assay of simvastatin formulation, the amount of drug was found to be 99.86%, which was consistent with the labelled claim.(Table 5).
CONCLUSION
It can be concluded from the calculated results that the proposed area under curve method was accurate, precise and consistent for the measurement of simvastatin in dosage form. The developed method can be used for quantitative estimation of simvastatin in bulk and pharmaceutical dosage forms.
ACKNOWLEDGEMENT
The authors are thankful to Dr. K.N. Gujar, principal, Sinhgad College of Pharmacy, Vadgaon (Bk.), Pune for their support and providing necessary facilities for the project.
REFERENCES
1. Goodman’s and Gilman’s, Manual of pharmacology and therapeutics, McGraw Hill, 2008; 38.
2. Katzung, Bertram G., Basic and clinical pharmacology, 10th edition, McGraw Hill Lange, 2006; 1028, 1011.
3. Tripathi, KD. Essentials of medical pharmacology, Jaypee brothers medical publishers (P) Ltd., 2008; 615.
4. Craig, Charles R., Stitzel, Robert E., Modern pharmacology with clinical applications, 5th edition,
2009; 269.
5. Guzik, L., Morzik, W. and Kamysz, W., Croatica chemica ACTA, 2010; 83(4) 371–377.
6. Bernard, S., Mathew, M., Estimation of simvastatin in bulk and tablet dosage form by HPTLC, International journal of pharmaceutical research and development, 2011; 3(7), 56-62.
7. Naga RK. Spectrophotometric methods for estimation of Simvastatin in bulk drug and its dosage form, international journal of pharmaceutical, chemical and biological sciences, 2012; 2(1), 124-129.