ANALYSIS AND CONTROL OF EMISSIONS FROM PULP AND
PAPER MILL
Dr. Pradeep Kumar1* and Nikita Agarwal2
1
Professor, 2M. Tech. Student
Department of Civil Engineering, Harcourt Butler Technological Institute, Kanpur-208002,
U. P.
Article Received on 11/07/2016 Article Revised on 01/08/2016 Article Accepted on 22/08/2016
ABSTRACT
Pulp & Paper industry is considered as one of the most polluting sector
in the world. They are recognized as a source of green house gas
emissions in the paper manufacturing sector since they produce CO2,
CH4 and N2O during the production process. The major air emissions
of the industry come from sulfite mills as recovery furnaces and
burners, sulfur oxides (SOx), from Kraft operation as reduced sulfur
gases and odor problems, from wood-chips digestion, spent evaporation and bleaching as
volatile organic carbons (VOCs), and from combustion process as nitrogen oxides (NOx) and
SOx. It would be interesting to analyze and quantify these green house gas emissions from
Pulp & Paper mill. The proposed study is an attempt in this direction. The estimation of green
house gases from different Pulp & Paper mill of region situated near west of Uttar Pradesh
such as Rama paper mill, Kiratpur, Bijnor, Mohit paper mill, Nagina, Bijnor etc has been
done using the IPCC 2006 guidelines by calculative methodology. For each mill, daily
quantity of fuel burned has been collected for fifteen days using either digitally available
meters representing the quantity of fuel burned or by theoretical values suggested by the mill
workers. Also, the data has been calculated using formula suggested by IPCC 2006
guidelines and a comparison has been done between observed values and calculated result.
Results reveal that significant quantities of GHG emissions are produced using different
qualities of fuel such as Charcoal, Tel Rahit Bhussi, Petroleum coke etc. It has also been
observed that the emissions coming from petroleum coke is in lesser amount as compared to
World Journal of Engineering Research and Technology
WJERT
www.wjert.org
SJIF Impact Factor: 3.4191.1
*Corresponding Author Dr. Pradeep Kumar
other fuels. Also the profiles of observed and calculated GHG emissions could not match
well. It is suggested that extensive attempts should be made for correct monitoring of GHGEs
from pulp & paper mills. Further, it is strongly suggested that continuous monitoring of fuel
should be taken care with replacement of Bhussi and coke with pet coke and also quantity of
emissions should be monitored before and after each unit of paper production to have better
quantification of GHG emissions. Also I have taken a graphical representation of all the fuel
in terms of GHG emissions they are emitting respectively.
KEYWORDS: GHGE (Green House Gas Emissions), CO2 (Carbon Dioxide), CH4 (Methane), N2O (Nitrous Oxide), VOCs (Volatile Organic Carbons), NOx (Nitrogen Oxides).
OBJECTIVES
a) To identify the GHG emissions of different fuels from Pulp & Paper industry
theoretically.
b) To estimate green house gas (GHG) emissions using calculation methodology (GHG
inventory) given by IPCC (2006) of various mills situated in and near district Bijnor,
Uttar Pradesh.
c) To carry out a comparative analysis of emissions coming from calculative methodology
with theoretical version.
d) To provide certain alternative measures for reducing the emissions such that it comes out
to be viable for getting sustainable environment.
2.1INTERNATIONAL STATUS
Ashaier et al. (2015) reviewed the implementation of acetone as a pulping agent for pineapple leaves. Mixtures of water and acetone with concentration of 1%, 3%, 5%, 7%, and
10% were used. The effects of soaking and delignification time on the paper properties were
investigated. Thermal and physical properties of paper sheet were studied using thermo
gravimetric analysis (TGA) and tearing resistance test respectively. The morphological
properties were observed using microscope at 200× magnification. The paper sheet produced
from pulping with 3% acetone concentration shows the highest mechanical properties. Papers
strength was improved by increasing the delignification time. The delignification time was
reduced by cooking the pineapple leaves at a temperature of 118 °C under applied pressure of
Main et al.(2014) conducted a study in the suitability of coir fibers as an alternative material in making Pulp & Paper. Maceration process was used to characterize the fiber. Soda-AQ
pulping with various combinations of active alkali (18-22%) and cooking time
(90-150 minutes) at fixed temperature was done. Physical properties evaluated were density,
brightness, opacity, scattering coefficient, tear, burst and tensile index. As concentration of
active alkali and cooking time increased, the physical properties values also increased, except
for the opacity and scattering coefficient. The optimum condition for producing the strongest
paper is using 22% active alkali in 120 minute.
Andrés et al. (2015) analyzed the production process for producing recycled pulp cellulose, there are waste generated by the raw material entering the system. This residue is separated
from the pulp by physical methods, and is mainly composed of plastics, paper, laminated
papers and other materials in smaller proportions. In order to recycle this waste, in this paper
we analyze the viability of use in the production of insulated panels. With the untreated
residue extracted from the plant, panels of 30 cm side and thickness of approximately 6 cm
were made. On these panels, parameters such as density and compression strength were
evaluated for the study of the homogeneity of the material obtained.
Masrol et al. (2015) stated the physical, optical and mechanical characteristics of Pulp & Paper made from waste durian rinds as an alternative raw material for papermaking were
investigated according to TAPPI and MS ISO standards. The durian rinds pulp was produced
through chemi-mechanical pulping (CMP). Naturally dried durian rinds were treated with
10% Sodium Hydroxide (NaOH) based on oven dry (o.d) weight of durian rinds in room
temperature for 2 hours and pulped by the refiner mechanical pulping (RMP) process.
Experimental results show that durian rinds have great potential characteristics as newly
explored non-wood based raw material for Pulp & Paper industry.
Brown et al. (2012) stated industrial processes are highly energy intensive and account for one-third of global energy use. Around 70% of this energy is supplied by fossil fuels, and
CO2 emissions from industry make up 40% of total CO2 emissions worldwide. Since the
1990s, the energy consumption of industry per unit of value added in developed countries,
has fallen by around 1.3% per year on average (once adjusted for structural changes),but at a
lower rate than the average reduction of 2.8% per year during the 1970s and 1980. Moreover,
improvements in energy intensity have been more than offset by increased total production,
Demand for manufactured goods is expected to at least double by 2050(relative to 2006
levels), and, if industrial emissions remain unchecked, total CO2 emissions are projected to
increase by up to 90% by 2050 compared to 2007.Reducing emissions from industry requires
a sustained and focused effort. This Briefing Paper outlines the options for reducing industrial
CO2 emissions, concentrating on those sectors which make up the largest share (>70%) of
emissions, i.e. iron and steel, cement and chemicals and petrochemicals. The paper gives an
overview of industrial mitigation technologies, both those that are process-specific and those
that apply broadly across the whole of industry. The abatement potential of these
technologies, their cost effectiveness and barriers to uptake, as well as the policies to
overcome these barriers is discussed.
Moon et al. (2015) examined GHG emissions and the economic effects of logging and mill residues, which are employed as raw materials for various purposes in Maniwa, Japan. In
2012, 23,710 tonnes of woody biomass resources was collected and used in Maniwa, of
which roughly 79% were logging residues. These resources are manufactured into several
types of wood products, such as chips, bark, and chip dust. The manufactured products are
then transported and consumed for paper, poultry litter, and fuel. Based on this, three
scenarios were organized by changing the type of woody biomass resource use as follows: the
business-as-usual (BAU) scenario, the logging-residues-only utilization (LRU) scenario, and
the mill-residues-only utilization (MRU) scenario. Under the LRU scenario, the expected
regional effect is almost 204 million JPY, whereas the MRU scenario achieves almost 20
times more financial benefits than the LRU scenario with the integrated woody biomass
station. However, approximately 13 full-time jobs can be created under the LRU scenario,
which is roughly 2.1 times higher than the 6 jobs created under the MRU scenario. In terms
of GHG emissions, the LRU scenario can reduce GHG emissions by up to roughly 211 t
CO2eq/t compared to the MRU scenario. Overall, the promotion of logging residue use for
manufacturing wood products has significant advantages over mill residues in both the
reduction of GHG emissions and the growth of regional economies.
Chang et al. (2016) assessed the eco-efficiency of China's Pulp & Paper industry at the national level and provincial level. An overview regarding the cleaner production of China's
Pulp & Paper industry was presented to reveal the measures for reducing environmental
impact in the last two decades. Slacks-based measure was used to analyze the efficiency
eco-efficiency performance, Malmquist-Luenberger index was calculated to discover the drivers
of productivity growth of Pulp & Paper industries. Our results showed that the pollution
treatment of China's Pulp & Paper industry has made progress in terms of water consumption
and water pollution, although the absolute amount of pollution discharge is still large.
Chemical oxygen demand emissions are still the first critical influencing factor of Pulp &
Paper industry's inefficiency. Furthermore, efficiency progress was the dominating
contribution of the industry's productivity growth between 2010 and 2013. The policies for
adjusting the industrial structure of Pulp & Paper industry have resulted in the scale effects
through eliminating backward production capacity and accelerating merger and acquisitions.
Moreover, the productivity of Pulp & Paper industry was underestimated when the
undesirable outputs were ignored. It indicates that the stricter environmental regulations have
positive effects on paper companies to internalize environmental pressures in the production
activities through environmental management. In the future, Pulp & Paper companies should
further internalize the cost of pollution treatment through scale effects and technology
improvement.
Kong et al. (2015) compiles available information on energy savings, environmental and other benefits, costs, and commercialization status for 25 emerging technologies to reduce the
energy use and CO2 emissions. The purpose is to provide a well-structured comprehensive
review on these emerging energy-efficiency technologies for engineers, researchers,
investors, policy makers, pulp and/or paper companies, and other interested parties such as
Pulp & Paper industry accounts for approximately 5% of total industrial energy consumption
and contributes 2% of direct carbon dioxide (CO2) emissions from industries. World paper
and paperboard demand and production are increasing significantly, leading to an increase in
this sector's energy use and CO2 emissions. Although current studies identify a wide range of
energy-efficiency technologies that have already been commercialized for the Pulp & Paper
industry, information is limited or scattered regarding new energy-efficiency technologies
that are not yet fully commercialized. Development of emerging or advanced
energy-efficiency technologies and their deployment in the market will be crucial for this industry's
mid- and long-term energy saving and climate change mitigation strategies.
Wang et al. (2016) based upon an analysis of China’s Pulp & Paper Industry (CPPI), provides estimates of each of the following: carbon emissions from energy consumption,
incomplete aerobic digestion during sewage treatment of CPPI. It provides not only detailed
information about CPPI’s carbon emissions, but also a calculation framework for studying
carbon emissions from Pulp & Paper sector in the other regions. It suggests that the local
carbon emissions inventory should be used for estimating carbon emissions and to reduce the
fossil fuel energy, increase energy recovery from biomass, and that promoting cleaner
production is essential to achieve a low carbon development of the Pulp & Paper industry.
According to this study’s estimation, the emissions caused by the recovery of biomass
energy contributed 26–29% of the total CO2 emissions. CH4 generated from sewage
treatment accounted for 9–11% of the total carbon emissions. The CO2 intensity dropped
during the study period, which reflected the improvement of energy efficiency in the Pulp &
Paper industry. During the study period (2005–2012), total CO2 emissions ranged from
126.0 Mt to 155.4 Mt. Energy consumption was estimated to be the largest source of carbon
emissions, however, due to the application of the local emission inventory rather than the
IPCC inventory, energy consumption decreased by 4.7%, a lower percentage than was
calculated in a previous study.
2.2NATIONAL STATUS
Sharma et al. (2015) presents the results of a preliminary assessment towards the potential estimation of solar process heating in paper industry in India. To begin with, data for (i)
classification of paper mills on the basis of size and feedstock used (ii) extent of cogeneration
in paper mills (iii) annual paper production (feed stock wise) (iv) specific thermal energy
requirement for process heating etc. have been collected. Annual process heating requirement
for paper production (based on feed stock used) in paper mills in India has been estimated.
Availability of adequate solar resource in different states of the country was assessed for
potential estimation. Some commercially available solar collectors that can supply heat at
required temperature of paper industry (50-2500C) have been selected and an assessment of
their performance has been made. Majority of paper mills in India are those using agro
residues and recycled fibers as raw feedstock are located in the states with adequate DNI
availability (1900kWh/m2). Annual process heating potential for the paper industry in India
has been estimated at 43 PJ.
Bajpai et al.(2015) justified Chemical additives used in papermaking fall into three groups- general (commodity) and two classes of specialty chemicals- process and functional. Process
runnability, providing deposit control and reducing steam consumption. Retention aids,
defoamers, fixative agents, biocides, and defoamers/antifoam additives are some typical
examples of process chemicals. Functional chemicals directly affect paper quality and paper
properties- color, water repellency, strength, printability, etc. Typical examples of such
functional chemicals are dyes, coating binders, and strength and sizing additives. The
boundary between process and functional chemicals is not very definite as process chemicals
may either significantly influence performance of functional chemicals and/or affect sheet
properties directly. About 90% of all chemical additives belong to functional additives. The
remaining 10% are process chemicals, with retention aids (including fixatives, coagulants,
flocculants and micro particles) representing the biggest and most important part. The
in-depth and thorough coverage of chemical additives in the Pulp & Paper industry are
presented. Various sections deal with pulping chemicals, bleaching chemicals, process
chemicals, functional chemicals, pigments for fillers, coating pigments, aluminum, starch,
chemicals used in paper recycling, and chemicals used for stickies control and tissue and
towels.
Gaps in Existing Knowledge
Earlier studies accounted that GHG emissions from a paper and pulp mills can also contribute
in global warming of earth. In 2000 it has been released that gases emitting from production
process was of major concern and there was no protocol to measure GHG emissions. Later on
emphasis was given on calculating CO2 & CH4 emissions. Karthik chandaran (2009) was first to tackle N-GHGs. Later on, using IPCC (2006) GHG protocols many scientists calculated only CH4 & N2O emissions frequently by using the amount of fuel that is burned
in manufacturing process of a pulp. The fuel used in manufacturing of a pulp can be any
wood material or petroleum coke, coal etc. No rigorous study for quantification of CO2 has
been done which is the major contributor to global warming. This study involves the
quantification and analysis of major three GHG’s emitted. This study also involves certain
measures to be taken for attaining sustainability through a pulp mill.
METHODOLOGY Study Area
For the purpose of carrying out the objectives, a total of 8 Pulp & Paper industry of Bijnor
district of Uttar Pradesh were considered. A brief description of these mills along with their
Pulp & Paper mills in Uttar Pradesh (Bijnor district)
Presents the summary of all the mills being investigated for carrying out my study in the state
of Uttar Pradesh. From the given tabular data we can conclude the total number of mills
carrying out three different fuels is 1 and two different fuels are 5 and the mills carrying out
one fuel are 2.
Table: Summary of Pulp & Paper industry in Bijnor district Uttar Pradesh. Location of industry Types of fuel being used
to manufacture paper
Mohit paper mill
Mohit Paper Mill, 9 KM Stone, Bijnor -246701 (U.P.)Nagina Road
Charcoal Pet coke Tel rahit bhussi Rama paper mill
Paper Mill Rd, Himmat Nagar, Saharanpur, Uttar Pradesh 247001
Tel Rahit Bhussi Charcoal
Chandpur enterprise
Chandpur Enterprise, Chandpur , Bijnor
Pet Coke Charcoal
RESULTS AND DISCUSSION
As per the specific methodology firstly, the GHG emissions for Pulp & Paper mill in or near
Bijnor district were calculated using IPCC guidelines and are presented in below table.
4.1 GHG emissions from Pulp & Paper industry
Following table shows GHGE in various Pulp & Paper mills and example calculations has
been shown further.
a) Mohit paper mill
Mohit Paper Mill, 9 KM Stone, Bijnor -246701 (U.P.) Nagina Road.
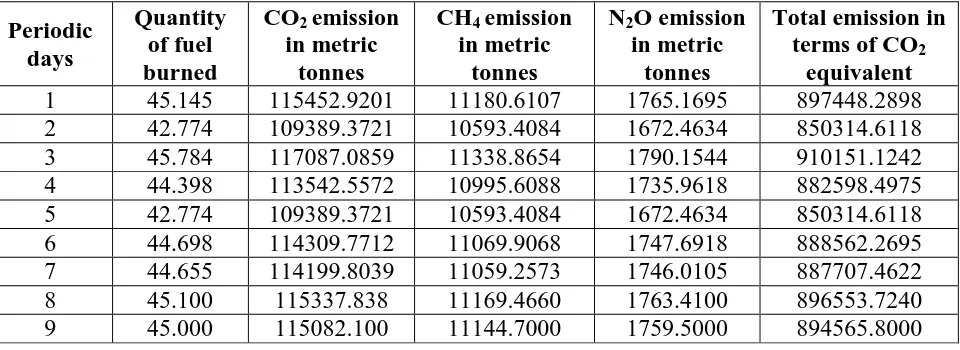
Table 4.1: GHG emission in Mohit paper mill observed for fifteen days for charcoal. Periodic days Quantity of fuel burned CO2 emission in metric tonnes CH4 emission in metric tonnes N2O emission in metric tonnes
Total emission in terms of CO2
equivalent
1 45.145 115452.9201 11180.6107 1765.1695 897448.2898
2 42.774 109389.3721 10593.4084 1672.4634 850314.6118
3 45.784 117087.0859 11338.8654 1790.1544 910151.1242
4 44.398 113542.5572 10995.6088 1735.9618 882598.4975
5 42.774 109389.3721 10593.4084 1672.4634 850314.6118
6 44.698 114309.7712 11069.9068 1747.6918 888562.2695
7 44.655 114199.8039 11059.2573 1746.0105 887707.4622
8 45.100 115337.838 11169.4660 1763.4100 896553.7240
10 44.738 114412.0664 11079.8138 1749.2558 889357.4391
11 41.445 105990.6141 10264.2687 1620.4995 823895.1018
12 42.774 109389.3721 10593.4088 1672.4634 850314.6118
13 45.236 115685.647 11203.1476 1768.7276 899257.3006
14 45.338 115946.4944 11228.4098 1772.7158 901284.9831
15 42.774 109389.3721 10593.4084 1672.4634 850314.6118
Total emission suggested by the mill owner according to a study carried out by a renowned
consultant such as new con industries are as follows
Total emission = 600000
CO2 emission factor suggested by IPCC = 2557.38
CH4 emission factor suggested by IPCC = 247.66
N2O emission factor suggested by IPCC = 39.11
Figure 1 presents the scatter diagram between observed and calculated values of GHGE for
the mills that are using pet coke as a fuel burned.
Fig.1: Figure shows the observed and calculated portions of pet coke as a fuel.
Therefore it is observed from the above figure that the values observed of quantity of fuel
burned are following reasonably good trend with most of the points lying in or around pet
coke as a fuel so that it shows pet coke as a fuel which can be used more efficiently. Hence it
is concluded that the observed and calculated values differ so that different methodology
should be suggested so that to make the observed and calculated values in close vicinity of
each other. This proves the utility of the standard equations available in the text for the
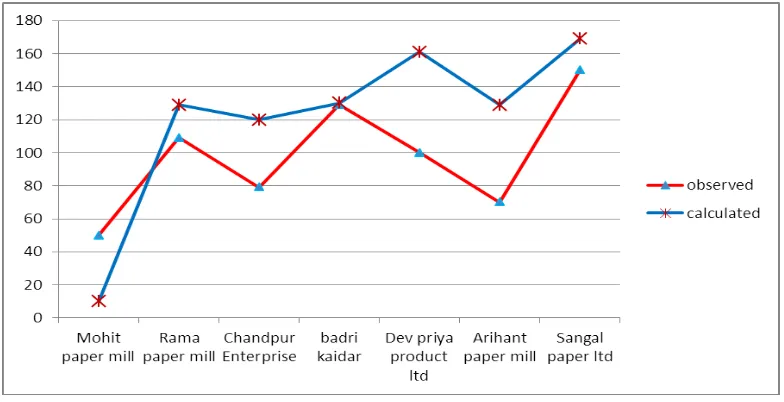
Fig.2: Figure shows the observed and calculated values for charcoal as a fuel
Figure 2 presents the scatter diagram between the observed values and calculated values for
charcoal as a fuel. It is observed that the values calculated and observed are following a
reasonably differing trend with most of the points varying in the calculated version. Thus it
can be concluded that the predicted values of gas production are not in close proximity to the
observed values. This proves the utility of the standard equations available in the text for the
estimation of GHGE.
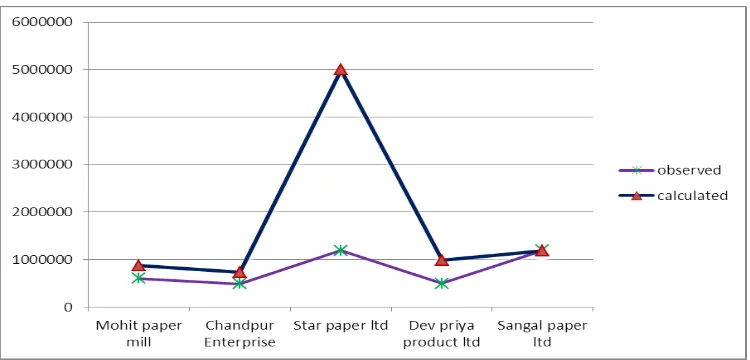
Fig. 3: Figure shows the observed values of Tel Rahit Bhussi as a fuel.
Figure presents the scatter diagram between the observed values and calculated values for
Rice husk and coal as a fuel. It is observed that the values calculated and observed are
following a reasonably differing trend with point varying in the calculated version. Thus it
can be concluded that the predicted value of gas production are not in close proximity to the
observed value. This proves the utility of the standard equations available in the text for the
estimation of GHGE so that certain measures can be taken so that to avoid discrepancies in
The above graphs shows the relation between different calculated and observed values with
respect to different fuels being utilised by the mill owner which states that certain measures
needs to be taken to activate the actions. It is also observed that the constant use of pet coke
as a fuel in comparative to other fuels produce less pollution in terms of GHG emission as
compared to other fuels. The gas produced in different mills is observed and seen on above
representation and it is observed that the values of gas production are varying in respect to the
calculated values being used by IPCC calculation methodology. It is observed that there are
various peaks (high and low) in the values of gas production. Such large variation could
possibly be on account of non uniform functioning of treatment plant which could be because
of several reasons such as varying quantity of fuel being burned and not measured properly.
Therefore certain measures need to be analysed so that to possibly reduce the amount of
emission in order to enhance the environment in more effective manner. I hereby attach the
values being recorded on daily basis for different mills so that to observe the difference
between calculated and observed value.
CONCLUSIONS
Pulp & paper mills have been recognized as a major source of GHG emissions in recent
years. There are considerable efforts going on to determine cases on footprint of pulp mills
with respect to GHG emission, energy usage, etc. In order to determine GHG from a mill an
inventory has been designed by IPCC in which inventories of all GHG’s has to be calculated
and appropriate global warming potential(GWP) of each gas has to be applied. This present
study titled “Analysis & Control of emission from pulp & paper using GHG protocols” was
attempted in direction and calculations for GHG emissions from different pulp & paper mills
situated in or near district Bijnor through IPCC guidelines 2006 have been done. Data of four
months i.e. February, March, April, May have been collected from different paper mills on a
daily basis of gas production and calculation of GHGE using those data through earlier
defined standard equations have been done. Also, comparative study in collected data and
calculated data is done. On the basis of the results the following conclusions have been made:
a) Significant quantities of GHG’s are produced from pulp &paper mills. However,
inaccuracy of these results can be ruled out because of lack of data, assumptions are made
in the analysis, lack of monitoring etc.
b) The profiles of observed and stimulated GHG emission from different paper mills could
plant functioning because of power crisis or it may be due to lack of data monitoring
system available in mills.
c) The calculated value was not in proper stimulation with the value given by a recognized
environmental consultant for various pulp mills situated in Bijnor. Therefore the
calculated results from various types of quantity of fuel burned are determined.
These variations may be due to other reasons also. Some of them are listed below.
i. The data may not be recorded properly. As, the gases emitting from every unit may not be
recorded in the metering gauge so that some of the gases may be blown in atmosphere.
ii. The standard equations may not be very much applicable in finding or evaluating such
emissions or we may say that the equations are absurd.
REFERENCES
1. Axegard, P.(1989). Improvement of Bleach Plant Effluent by Cutting Back on C12.Pulp
& Paper Canada, 90: 78-81.
2. Bajpai Pratima. (2015). Pulp & Paper industry. Consultants Patiala, Punjab, India,
Chemicals, 25-273
3. Basta, J. (1989). Low AOX, Possibilities and Consequences. Pulping Conference, Tappi
Press, Atlanta, 427-436.
4. Carruthers, George. (1947). Paper in the Making Garden City Press Coop., Toronto, 712.
5. Cheremisinoff, P.N. (1989) .High Hazard Pollutants: Asbestos, pcb, Dioxins, Biomedical
Waste, Pollution Engineering, 21: 58-65.
6. Coster (2009). Diagram showing different sources of GHG emissions during treatment
process.
7. Crittenden, G. (1990) .Operation Zero, Hazardous Materials Management, 2: 8-11.
8. Deshmukh Sharvari , Jana Arun , Bhattacharyya Nabarun , Bandyopadhyay ,Rajib and
Pandey R.A. (2014).Quantitative determination of Pulp & Paper industry emissions and
associated odor intensity in methyl mercaptan equivalent using electronic nose.
Atmospheric Environment, 82: 401–409
9. Douglas, G.R (1980).Mutagenic Activity in Pulp Mill Effluents. Water Chlorination:
Environmental Impact and Health Effects, 3: 865-880.
10.Douglas, G.R. (1983). Mutagenicity of Pulp & Paper Mill Effluent: a Comprehensive
Study of Complex Mixtures. Short-Term Bioassays in the Analysis of Complex
11.Dreisbach, (1980) .R.H. Handbook of Poisonings: Prevention, Diagnosis, and Treatment.
10th ed. Lange Medical Publ. Los Altos, California, 364.
12.Dubelstein, P. And N.C.C. Gray, (1990) .The Effects of Secondary Treatment on AOX
Levels in Kraft Mill Effluents.76th Annual Symposium of the Canadian Pulp & Paper
Association, Montreal, 317-324.
13.Environment Canada. (1986) Emissions and Trends of Common Air Contaminants in
Canada Report EPS 7/AP/17. Environment Canada, Ottawa, 104.
14.Environment Canada. (1991). New Federal Regulations to Control Pulp Mill Pollution.
News Release PR-HQ-091-45. Environment Canada, Ottawa.
15.Giri Balendu Shekher and Pandey R.A. (2013). Biological treatment of gaseous emissions
containing dimethyl sulphide generated from Pulp & Paper industry
Bioresource Technology., 142: 420–427
16.Haggblom, M. (1990).Mechanisms of Bacterial Degradation and Transformation of
Chlorinated Monoaromatic Compounds. Journal of Basic Microbiology, 30: 115-141.
17.Hall, Eric R. Et al (1988). Organo chlorine Discharges in Wastewaters from Kraft Mill
Bleach Plants. Environmental Conference of the Canadian Pulp & Paper Association,
Vancouver, 53-62.
18.Kierkegaard, A. And Renberg L. (1988). Chemical Characterization of Organo chlorine
Compounds, Originating from Pulp Mill Effluents in Fish. Water Science and
Technology, 20: 165-170.
19.Kong Lingbo, Hasanbeigi Ali, Price Lynn (2016). Assessment of emerging
energy-efficiency technologies for the Pulp & Paper industry: a technical review. Journal of
Cleaner Production, 122: 5–28
20.Kringstad, K.P. and Lindstrom K. (1984). Spent Liquors from Pulp Bleaching
Environmental Science and Technology, 18: 236A-247A.
21.Mckague, A.B. et al. (1981).Chloroacetones: Mutagenic Constituents of Bleached Kraft
Chlorination Effluent. Mutation Research, 91: 301-306.
22.Mckague, A.B. et al. (1990). Chloroacetones in Pulp Mill Chlorination Stage Effluents.
Environmental Toxicology and Chemistry, 9: 1301-1303.
23.Meier, J.R. et al. (1987). Studies on the Potent Bacterial Mutagen,
3-chloro-4-(dichloromethyl)-5-hydroxy- 2(5H)-furanone: Aqueous Stability, XAD Recovery and
Analytical Determination in Drinking Water and in Chlorinated Humic Acid Solutions.
24.Mikesell, M.D. and. Boyd S.A. (1986). Complete Reductive Dechlorination and
Mineralization of Pentachlorophenol by Anaerobic Microorganisms. Applied and
Environmental Microbiology, 52: 861-865.
25.Miller, R.E. and Guengerich F.P. (1983). Metabolism of Trichloroethylene in Isolated
Hepatocytes, Microsomes, and Reconstituted Enzyme Systems Containing Cytochrome
P450.Cancer Research, 43: 1145-1152.
26.Moon Dami, Kitagawa Naomi, Genchi Yutaka (2015). CO2 emissions and economic
impacts of using logging residues and mill residues in Maniwa Japan. Forest Policy and
Economics, 50: 163–17
27.Munro, F.C. (1990). Environmentally Influenced Evolution of E.B. Eddy Espanola’s