Copyright © The Author(s). All Rights Reserved. Published by American Research Institute for Policy Development DOI: 10.15640/jcsit.v6n1a5 URL: https://doi.org/10.15640/jcsit.v6n1a5
An Improved Model for Web Usage Mining and Web Traffic Analysis
Awoyelu I.O.
1, Oyewole O.T.
2& Adebiyi H.O.
3Abstract
The World Wide Web (WWW) is continuously growing with the information transaction volume from web servers and the number of requests from web users. Providing web administrators with meaningful information about users’ access behaviour and usage patterns have become a necessity to improve the quality of web information service performance. Existing models do not make use of completely detailed and longer period of web log data. There is the need for a model that analyses usage patterns of different aspects of log files collectively and for a longer duration. In this paper, web log data was collected from Information and Telecommunications Unit of Obafemi Awolowo University, Ile Ife. The web log data was comprehensively studied to identify the most important input variables useful for the web usage mining model and web traffic analysis. An improved web mining model was designed using Unified Modelling Language. The developed model was simulated on Waikato Engineering and Knowledge Analysis (WEKA) software using Naïve Bayes’ classifier. The performance of the simulated model was validated using performance metrics: accuracy, recall, precision, true positive and false positive rate and ROC area. The model had a precision value of 0.810, which means that the Naïve Bayes’ classifier got 81% of predictions correctly to their original class. The area under the ROC had a minimum value of 0.993 indicating clearly the level of bias attributed to the predictions made by the Naïve Bayes’ classifier which in this case is 0.7% of all predictions.
Keywords: web log data, web usage, mining, web traffic, Naïve Bayes’ classifier
1.0 Introduction
The Internet has become a regular channel for communication, especially for business transactions. Web usage mining is the application of data mining techniques to discover usage patterns from web data, in order to understand and better serve the needs of web-based applications. Also, providing web administrators with meaningful information about users’ access behaviour and usage patterns have become a necessity to improve the quality of web information service performance. As such, the hidden knowledge obtained from mining web server traffic and user access patterns could be applied directly for marketing and management of business, services, searching, e-education and so on (Xiaozhe et al, 2005). Web data mining can be defined as applying data mining techniques to automatically discover and extract useful information from the World Wide Web (Xuejun et al., 2007). Generally, there are three research areas in web data mining, as represented in Figure 1. These are web structure mining, web content mining and web usage mining. Web structure mining deals with the discovery of the hyperlink structure of the web in order to extract relevant connectivity patterns. Web content mining is concerned with the automatic discovery of patterns within web information such as HTML pages, images, audios, videos and e-mails. Web usage mining is concerned with the discovery of usage patterns from web data, in order to understand users’ online navigation behaviour (Xuejun et al, 2007).
1 Department of Computer Science and Engineering, Obafemi Awolowo University, Ile-Ife, Osun State, Nigeria.
Email: [email protected]
2Department of Computer Science and Engineering, Obafemi Awolowo University, Ile-Ife, Osun State, Nigeria.
Email: [email protected]
Figure 1. Research Areas in Web Data Mining
After web data collection, web usage mining includes three major processes, namely: data pre-processing (data cleaning, user identification and session identification), pattern discovery and pattern analysis (Yu-Hui et al, 2008). The complete web usage mining process is as shown in Figure 2. Web usage mining applications are based on data collected from three main sources: web servers, proxy servers, and web clients (Federico and Pier, 2003). This paper implements a complete web usage mining process and discover web usage patterns that are used for web traffic analysis.
Figure 2: Web Usage Mining Process (Cooley et al., 1999)
Existing models do not make use of completely detailed and longer period web log data. There is the need for a model that analyses usage patterns of different aspects of log files collectively and for a longer duration. Also, the statistical data available from the normal Web log files or even the information provided by most conventional web server analysis tools could only provide explicit information due to the natural limitation of statistic methodology used. The proposed web usage mining model addressed these problems by making use of complete set of web logs for duration of about a year. The usage patterns gotten from the model was used for web traffic analysis and prediction.
2.0 Existing Works
Sathya et al. (2011) worked on web usage mining for DSpace server of National Institute of Technology (NIT) Rourkela, India. The DSpace log files were preprocessed to convert the data stored in them into a structured format. Thereafter, the general procedures for bot-removal and session-identification from a web log file were applied with certain modifications pertaining to the DSpace log files. Furthermore, analysis of these log files, using a subjective interpretation of an algorithm called Enhanced Immune Network Web Usage Mining (EIN-WUM) algorithm was also conducted. The EIN-WUM algorithm was proposed by Rahmani and Helmi (2008). Devi et al. (2012) designed and implemented a web usage mining intelligent system in the field of e-commerce. In this work, the web usage mining intelligent system was used for clustering of user behaviours using agglomerative clustering algorithm. Camona et al. (2012) performed web usage mining on the web log data of an e-commerce website - www.orolivesur.com. The knowledge was extracted using clustering technique through k-means algorithm, association rule learning with apriori algorithm and subgroup discovery through NMEEF-SD algorithm. Vedpriya and Jagdish (2015) developed an improved user browsing behavior prediction using regression analysis on web logs. K-means clustering and Regression Analysis algorithms were used to predict the future request. These two algorithms in combination were said to produce efficient and accurate results. Sandro et al. (2004) proposed a methodology for web usage mining and applied it in marketing of a bank’s products. The results showed how web usage mining can be used to improve marketing activities in a financial institution.
Finally, sequential profiles for elder self-care behaviour patterns were captured by applying sequence-based representation schemes in association with Markov models and ART2-enhanced K-mean clustering algorithms for sequence behaviour mining cluster patterns for the elders. The work showed that the use of sequence-based clustering in web usage mining effectively finds meaning groups that share common interests and behaviours and effectively extracts knowledge needed to understand the motivation for using elder self-care.
Aldekhail (2016) reviewed application and significance of web usage mining in the 21st Century. The study explained in detail the process of web usage mining and the different techniques used for pattern discovery. Also, it illustrated the different applications and tools used for web usage mining. Finally, it explained some current issues and challenges such as privacy and scalability, which are important issues in web usage mining.
3.0 Methodology
Web log data were collected from Information and Telecommunications Unit of Obafemi Awolowo University, Ile Ife, which contains detailed day-to-day usage of the Network (OAUnet) for a period of one year. The data was pre-processed for missing data or non-compliant data, which could generate errors, or missing data that may damage the privilege of the model developed. This was followed by the transformation of the data collected into a format that was suitable for the simulation environment that was used to perform the simulation of the model; all which can also be called the data preparation process. After data preparation, the different data mining classifiers were identified and the classifiers were used to develop models for the web usage of OAUnet after feature selection. This was used to identify the variables and attributes (25) that had more relevance in the development of the model. The data was divided into two different sets - training and testing data. The performance of each data mining classifier was evaluated for accuracy, recall and precision after which test data was used to validate the proposed model. The sample web log is as shown in Figure 3.
Figure 3: Web-log file from OAUnet showing Web User Activities
In order to properly map out the pattern of the data which was followed by the web usage mining tasks; pre-processing tasks were performed on the data which was used to create a description of the data set needed for performing the study. Figure 3 shows the result of the pre-processing tasks involved on the data set collected. All Start and Stop sessions were combined into a single record consisting of an instance of web usage by an individual user of OAUnet.
User access (sessions) at different days of the week
This is shown in Figure 4. Following the number of sessions made on Thursday, Tuesday and Wednesday also have the next higher number of sessions made on the network by the Users of OAU Net. The weekday recorded, Monday as the day with the least number of sessions made by users of the network. During the weekends, Fridays record the highest number of sessions made followed by Saturday and Sunday.
Figure 4 Pre-processed Data
It was discovered that Thursday recorded the highest number of sessions with a value of 44678 sessions, Wednesday with a value of 43140 sessions, Tuesday with a value of 43115 sessions and Monday with a value of 35188 sessions for the 3 months period. During the weekends, Friday recorded the highest with a value of 31381 sessions, Saturday with a value of 25959 sessions and Sunday with a value of 19034 sessions for the 3 month periods also. The implication of this is that, the average numbers of sessions per day are: 586 sessions every Monday, 718 sessions every Tuesday, 719 sessions every Wednesday, 744 sessions every Thursday, 523 sessions every Friday, 432 sessions every Saturday and 317 sessions every Sunday. This totals to 4039 sessions every week of the month being managed by the Network.
Session time
The session time gives a description of the number of time (in seconds) that a user spends for every session made on the network.
Packet delivery
The Packet delivery for the dataset collected was evaluated as the sum of the account input and output packets for each user session. This gave a description of the amount of packets that was transferred within the OAU network and a good approximation of the expected throughput of the network.
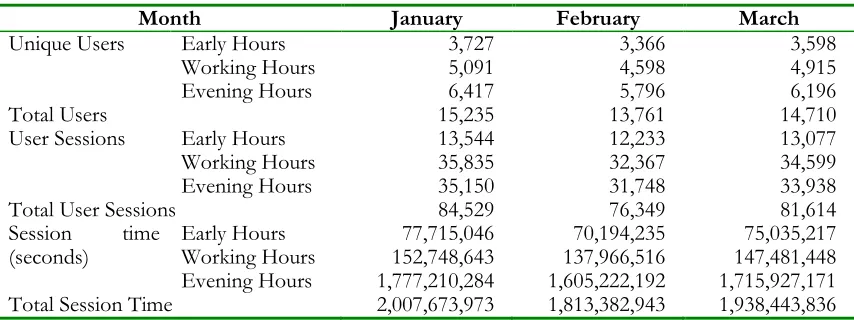
Table 1: Session Time for OAUnet
Month January February March
Unique Users Early Hours 3,727 3,366 3,598
Working Hours 5,091 4,598 4,915
Evening Hours 6,417 5,796 6,196
Total Users 15,235 13,761 14,710
User Sessions Early Hours 13,544 12,233 13,077
Working Hours 35,835 32,367 34,599
Evening Hours 35,150 31,748 33,938
Total User Sessions 84,529 76,349 81,614
Session time
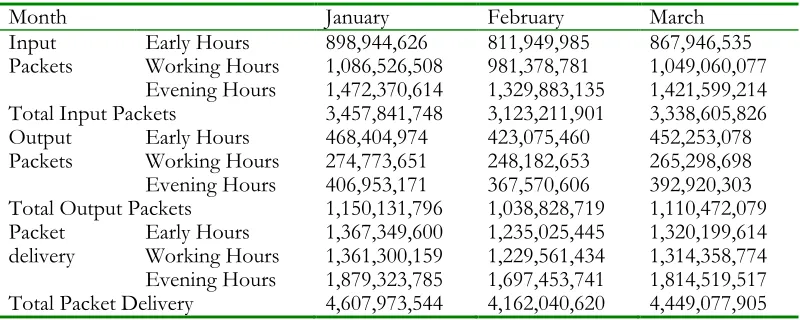
Table 2 shows the distribution of the input and output packets sent and received within the network by the users of the network while accessing the network. It was observed that although, there are lesser people accessing the network in the evening hours, the table shows that more packets are transferred during the evening unlike during the days. This means that the amount of data transferred within the network during the evening is higher compared to that of the other periods of the day. The number of Input packets transferred is higher during the working and evening hours compared to the input packets transferred during the early hours. The number of output packets transferred during the evening and early hours are much higher than the packets transferred during the early hours of the day while the total number of packets transferred during the evening hours is much higher than at any other time of the day. The implication of this is that, the network engineers must be aware of the packets transferred in order to be aware of the throughput to be made available for users of the network in order not to hinder the utilization of network resources by the network users irrespective of the time of the day that the network is under use. Following the description of the packets that were exchanged within the network defined as the input packets, output packets and the total packets (expressed as a sum of input and output packets), it is expedient to describe the distribution of the packets over the user sessions, unique users and the session time.
Table 2 . Input, Output and Total packets transferred within the Network
Month January February March
Input
Packets Early Hours Working Hours 898,944,626 1,086,526,508 811,949,985 981,378,781 867,946,535 1,049,060,077 Evening Hours 1,472,370,614 1,329,883,135 1,421,599,214 Total Input Packets 3,457,841,748 3,123,211,901 3,338,605,826 Output
Packets Early Hours Working Hours 468,404,974 274,773,651 423,075,460 248,182,653 452,253,078 265,298,698 Evening Hours 406,953,171 367,570,606 392,920,303 Total Output Packets 1,150,131,796 1,038,828,719 1,110,472,079 Packet
delivery Early Hours Working Hours 1,367,349,600 1,361,300,159 1,235,025,445 1,229,561,434 1,320,199,614 1,314,358,774 Evening Hours 1,879,323,785 1,697,453,741 1,814,519,517 Total Packet Delivery 4,607,973,544 4,162,040,620 4,449,077,905 Web Mining Simulation Results
In order to perform the required web mining model, a number of processes were encountered and limited to scope of the dataset provided. The dataset provided was initially divided into the training and testing data followed by the necessary pre-processing task of attribute selection. Attribute selection allows one to select the most relevant attributes that have the highest importance in determining the output class based on the distribution of the values in the dataset provided. After selecting the important attributes using attribute selection, the selected attributes were imported into the WEKA software as a training dataset, with the Naïve Bayes’ Classifier used in developing the required web mining model from the training dataset provided. Since the dataset were initially classified into three categories: morning, afternoon and evening session; three web-mining models were developed in all – one for each session provided. The performances of the developed web mining models were evaluated using performance evaluation criteria.
a.Training data
For the purpose of the web usage mining model to be developed, the data used in training the model was the January data selected out of the same 3 month-data collected form the Network engineers at INTECU which contained the web log of user sessions made on the network as shown in Figure 5. The dataset was converted to .csv (comma separable variable file format) which was the selected file format needed for performing the necessary web mining tasks using the WEKA software. The data used was put through a number of data mining tasks.
Attribute selection and Classification tasks
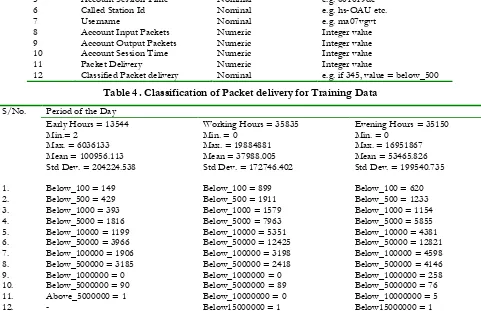
Table 3 gives a description of the attributes of the training dataset that was selected for the study. The table gives a breakdown of all the attribute types and respective labels for the attributes of the dataset selected for the study. Table 4 gives information on the descriptive analysis of the dataset selected which includes the total packets delivered, mean and standard deviation, minimum and maximum of the packet delivery for each session. The dataset contained the following datasets for January 2013, namely:
Working hours data for January 2013 - 35835 sessions and; Evening hours data for January 2013-35150 sessions.
Figure 5. Sample Training Data (early hours of January, 2013) used for Web Mining
Table 3 . Training Data used for Web Mining Tasks
S/No. Attribute Attribute Type Label
1 Serial No. Numeric e.g. 1, 2, 3 etc.
2 Day Nominal Mon, Tues etc.
3 Date Date e.g. January_14
4 Time Time HH:MM:SS
5 Account Session Time Nominal e.g. 801019de
6 Called Station Id Nominal e.g. hs-OAU etc.
7 Username Nominal e.g. ma07vgvt
8 Account Input Packets Numeric Integer value
9 Account Output Packets Numeric Integer value
10 Account Session Time Numeric Integer value
11 Packet Delivery Numeric Integer value
12 Classified Packet delivery Nominal e.g. if 345, value = below_500
Table 4 . Classification of Packet delivery for Training Data
S/No. Period of the Day
Early Hours = 13544 Min.= 2
Max. = 6036133 Mean = 100956.113 Std Dev. = 204224.538
Working Hours = 35835 Min. = 0
Max. = 19884881 Mean = 37988.005 Std Dev. = 172746.402
Evening Hours = 35150 Min. = 0
Max. = 16951867 Mean = 53465.826 Std Dev. = 199540.735
1. Below_100 = 149 Below_100 = 899 Below_100 = 620
2. Below_500 = 429 Below_500 = 1911 Below_500 = 1233
3. Below_1000 = 393 Below_1000 = 1579 Below_1000 = 1154
4. Below_5000 = 1816 Below_5000 = 7963 Below_5000 = 5855
5. Below_10000 = 1199 Below_10000 = 5351 Below_10000 = 4381
6. Below_50000 = 3966 Below_50000 = 12425 Below_50000 = 12821
7. Below_100000 = 1906 Below_100000 = 3198 Below_100000 = 4598
8. Below_500000 = 3185 Below_500000 = 2418 Below_500000 = 4146
9. Below_1000000 = 0 Below_1000000 = 0 Below_1000000 = 258
10. Below_5000000 = 90 Below_5000000 = 89 Below_5000000 = 76
11. Above_5000000 = 1 Below_10000000 = 0 Below_10000000 = 5
12. - Below15000000 = 1 Below15000000 = 1
b. Results of Attribute Selection Task
Gain Ratio Attribute Evaluator algorithm was chosen for selecting the attributes that have the greatest relevance in determining the packet delivery of the network. The algorithm was complemented by the use of the ranker search algorithm, which was used in ranking the attribute with respect to the Gain ratio calculated of each attribute of the dataset. Table 5 depicts the results of the attribute selection tasks performed on the three dataset.
The result of the attribute selection tasks performed on the three (3) dataset selected for the month of January 2013 produced its own respective ranking of attributes assumed important in the determination of the packet delivery. The attributes selected are the variables that increase the prediction of the class of the packet delivery for each individual user session.
All attributes that were used have their respective ranking values, although, it was discovered that none of them had a value of 0.500. All three dataset ranked input packets as the first (No. 1) but only the early and evening hours dataset ranked Day as the least (No. 10). Early and evening hours dataset ranked output packets, Time, Username and No. as the second (No. 2), fifth (No. 5), sixth (No. 6) and seventh (No. 7) respectively. Also, early hours and working hour’s data ranked session time as the third (No. 3). Figure 5 Results of the Attribute Selection of Dataset using Packet Delivery as Output.
c. Results of the classification of packet delivery – Naïve Bayes’ classifier
The Naïve Bayes’ classifier was the chosen data mining algorithm selected for the web-usage mining tasks for this study. The Naïve Bayes’ classifier is a stochastic-based data mining task which uses the conditional probabilistic value of each attribute with respect to the chosen output to perform the classification of each instance (session) into its respective class.
Performance Evaluation
True positive rate, false positive rate, F-measure and area under Receiver Operating curve (ROC) are the metrics used for the proposed model evaluation. True positives are correctly classified positive cases; false positives are incorrectly classified positive cases; true negatives are correctly classified negative cases; and false negatives are incorrectly classified negative cases.
Table 6, Table 7 and Table 8 show the results of the performance evaluation of the model used by the Naïve Bayes’ in predicting the packet delivery of each instance (session) for the early working hours and evening hours respectively.
For the early hours data set with a total of 13544 instances, there were 12986 correct classifications (95.88%) and 558 incorrect classifications (error of 4.12%).
Table 5: Results of the Attribute Selection of Dataset using Packet Delivery as Output
Table 6: Results of the classification of the packet delivery of early hours’ data using the Naïve Bayes’ classifier
S/No. Performance metric TP rate (recall) FP rate (false positive) Precision F-Measure Area under ROC
Below_100 0.940 0.001 0.946 0.943 0.999
Below_500 0.970 0.003 0.914 0.941 0.999
Below_1000 0.906 0.003 0.906 0.906 0.998
Below_5000 0.963 0.001 0.994 0.978 0.999
Below_10000 0.977 0.006 0.942 0.959 0.998
Below_50000 0.965 0.003 0.992 0.979 0.997
Below_100000 0.981 0.015 0.917 0.948 0.996
Below_500000 0.935 0.008 0.973 0.953 0.997
Below_1000000 0.985 0.006 0.831 0.902 0.999
Below_5000000 0.833 0.002 0.735 0.781 0.999
Above_5000000 1.000 0.000 1.000 1.000 1.000
Table 7: Results of the classification of the packet delivery of working hours’ data using the Naïve Bayes’ classifier
S/No. Performance metric TP rate (recall) FP rate (false positive) Precision F-Measure Area under ROC
Below_100 0.864 0.003 0.872 0.868 0.997
Below_500 0.854 0.005 0.913 0.882 0.996
Below_1000 0.928 0.024 0.645 0.761 0.993
Below_5000 0.880 0.005 0.979 0.927 0.994
Below_10000 0.960 0.023 0.879 0.917 0.995
Below_50000 0.943 0.025 0.952 0.947 0.994
Below_100000 0.827 0.014 0.857 0.842 0.974
Below_500000 0.861 0.004 0.933 0.895 0.995
Below_5000000 1.000 0.005 0.355 1.000 1.000
Below_15000000 1.000 0.000 1.000 1.000 1.000
Above_15000000 1.000 0.000 1.000 1.000 1.000
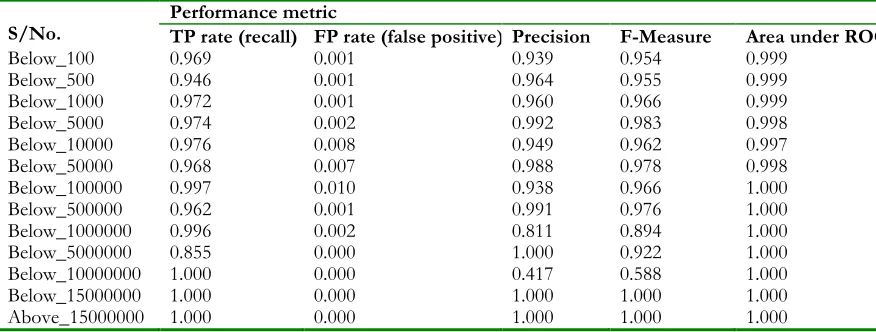
Table 8: Results of the classification of the packet delivery of evening hours’ data using the Naïve Bayes’ classifier
S/No. Performance metric TP rate (recall) FP rate (false positive) Precision F-Measure Area under ROC
Below_100 0.969 0.001 0.939 0.954 0.999
Below_500 0.946 0.001 0.964 0.955 0.999
Below_1000 0.972 0.001 0.960 0.966 0.999
Below_5000 0.974 0.002 0.992 0.983 0.998
Below_10000 0.976 0.008 0.949 0.962 0.997
Below_50000 0.968 0.007 0.988 0.978 0.998
Below_100000 0.997 0.010 0.938 0.966 1.000
Below_500000 0.962 0.001 0.991 0.976 1.000
Below_1000000 0.996 0.002 0.811 0.894 1.000
Below_5000000 0.855 0.000 1.000 0.922 1.000
Below_10000000 1.000 0.000 0.417 0.588 1.000
Below_15000000 1.000 0.000 1.000 1.000 1.000
Above_15000000 1.000 0.000 1.000 1.000 1.000
d. Performance evaluation of web usage mining model
The results presented in Table 7, Table 8 and Table 9 show the results for the True Positive (TP/recall) rate, False Positive (false alarm) rate, Precision, F-measure and the area under the ROC. The least possible value of the TP rate was 0.800 which implies that the Naïve Bayes’ classifier developed a model that was able to determine correctly at least 80% of the original classifications presented to it in the training dataset. The greatest value of the FP rate was 0.250, which implies that the Naïve Bayes’ classifier misclassified 2.5% of the training data for another class. The precision had a value of 0.810, which meant that the Naïve Bayes’ classifier got 81% of predictions made correctly to their original class. The area under the ROC with a minimum value of 0.993 indicates clearly the level of bias attributed to the predictions made by the Naive Bayes’ classifier chosen for performing the necessary web usage mining tasks, which in this case is 0.7% of all predictions.
Conclusion
The Naïve Bayes’ classifier gave a very high accuracy for the three (3) web mining models developed for each session of the day for the period of three (3) months for the selected period of time – January till March, 2013. The network engineers must be aware of the packets transferred in order to be aware of the throughput to be made available for users of the network. This is necessary in order not to hinder the utilization of network resources by the network users irrespective of the time of the day that the network is under use.
References
Cooley R., Mobasher B. and Srivastava J (1999). Data Preparation for Mining World Wide Web Browsing Patterns. Knowledge and Information Systems, Vol. 1, No. 1, 1999 pp. 5—32.
Federico M. F., Pier L.L. (2003), Recent Developments in Web Usage Mining Research, In: Kambayashi Y., Mohania M., W¨oß W. (Eds.): DaWaK 2003, LNCS 2737, pp. 140–150, Springer, Berlin, 2003.
Rahmani, A.T., Helmi, B.H (2008), EIN-WUM: an AIS-based algorithm for web usage mining. In: Ryan, C., Keijzer, M. (eds.) GECCO, pp. 291–292. ACM, New York (2008), http://doi.acm.org/10.1145/1389095.1389144 Aldekhail M. (2016), Application and Significance of Web Usage Mining in the 21st Century: A Literature Review,
International Journal of Computer Theory and Engineering, Vol. 8, No. 1, pp. 41-47
Sandro A., Mariano S., Richard W. (2004), A methodology for web usage mining and its application to target group identification, Elsevier Fuzzy Sets and Systems. 148: 139–152.
Sathya B. K., Saroj K. P., Sanjay K. J. (2011), Web Usage Mining: An Implementation View. In: S. Unnikrishnan, S. Surve, and D. Bhoir (Eds.): ICAC3 2011, CCIS 125, pp. 131–136, Springer, Berlin, 2011.
Vedpriya Dongre and Jagdish Raikwal (2015), An Improved user browsing behavior prediction using Regression Analysis on web logs. International Journal of Computer Applications (0975 –8887), Volume 120, No.19, pp. 19-23
Xiaozhe W., Ajith A., Kate A. S. (2005), Intelligent Web Traffic Mining and Analysis, Elsevier Journal of Network and Computer Applications, 28:147–165.
Xuejun Z., John E., Jenny H. (2007), Personalised Online Sales using Web Usage Data Mining, Elsevier Computers in Industry, 58:772–782.
Yu-Hui T., Tzung-Pei H., Yu-Ming S. (2008), Web usage mining with intentional browsing data, Elsevier Expert Systems with Applications, 34:1893–1904.