International Journal of Biological Sciences ISSN 1449-2288 www.biolsci.org 2007 3(5):335-341 © Ivyspring International Publisher. All rights reserved Research Paper
The responses of HT22 cells to the blockade of mitochondrial complexes
and potential protective effect of selenium supplementation
Jun Panee
1, Wanyu Liu
1, Kyoko Nakamura
2, and Marla J. Berry
11. Department of Cell & Molecular Biology, John A Burns Medical School, University of Hawaii, Honolulu HI 96813, USA 2. School of Medicine, Juntendo University, 2-1-1, Hongo, Bunkyo-ku, Tokyo 113-8421, Japan
Correspondence to: Marla J. Berry, 651 Ilalo Street BSB 222, Honolulu HI 96813, USA. Telephone: +1-808-692 1506; Fax: +1-808-692 1970; Email: [email protected]
Received: 2007.06.05; Accepted: 2007.07.11; Published: 2007.07.13
Mitochondria are the major reactive oxygen species (ROS) – generating sites in mammalian cells. Blockade of complexes in the electron transport chain (ETC) increases the leakage of single electrons to O2 and therefore
in-creases ROS levels. Complexes I and III have been reported to be the major ROS-generating sites in mitochondria. In this study, using mouse hippocampal HT22 cells as in vitro model, we monitored the change of intracellular ROS level in response to the blockade of ETC at different complex, and measured changes of gene expression of antioxidant enzymes and phase II enzymes, also evaluated potential protective effect of selenium (Se) supple-mentation to the cells under this oxidative stress. In summary, our results showed that complex I was the major ROS-generating site in HT22 cells. Complex I blockade upregulated the mRNA levels of glutamylcysteine syn-thetase heavy and light chains, glutathione-S-transferases omega1 and alpha 2, hemoxygenase 1, thioredoxin reductase 1, and selenoprotein H. Unexpectedly, the expression of the enzymes that directly scavenge ROS de-creased, including superoxide dismutases 1 and 2, glutathione peroxidase 1, and catalase. Se supplementation increased glutathione levels and glutathione peroxidase activity, indicating a potential protective role in oxida-tive stress caused by ETC blockade.
Key words: electron transport chain, complex I, rotenone, ROS, antioxidant
1.
Introduction
Over 90% of tissue respiration is due to oxygen consumption by mitochondria [1]. Superoxide is gen-erated by one electron reduction of O2 by the electron
transport chain (ETC), leading to formation of other reactive oxygen species (ROS). The percentage of O2
that is converted to superoxide in mitochondria has been reported ranging from 0.15 to 2% [2]. Production of ROS from the ETC is generally considered as the major continuous source of cellular oxidative stress, and as a major participant in pathophysiological processes, particularly aging and its associated de-generative diseases [3, 4].
The ETC in eukaryotic mitochondria consists of four complexes, transferring electrons from NADH to O2. When the ETC is blocked by an inhibitor, the
re-duction state of electron carriers increases on the sub-strate side of the inhibitor, while those on the oxygen side become more oxidized. Reduced complexes in the ETC have the ability to produce superoxide [1].
Mitochondrial complex I accepts electrons from NADH and passes them through flavin and iron-sulfur centers to ubiquinone [5]. Many structur-ally diverse hydrophobic compounds have been de-scribed to inhibit complex I by interfering with ubiquinone reduction, such as piericidin A (A type), rotenone (B type), and capsaicin (C type) [6]. Complex II uses succinate as substrate and provides electrons to
ubiquinone. Malonate (MA) inhibits succinate dehy-drogenase [7]. Complex III accepts electrons from ubiquinone and passes them on to cytochrome c [8]. It has two redox centers, known as Qo and Qi that can be
inhibited by stigmatellin (ST) and Antimycin A (AA), respectively [8, 9]. Both complexes I and III have been reported to be the major ROS-generating sites in ETC [10-13].
Inhibition of the activity of complex I in the ETC, e.g. upon exposure to the pesticide rotenone (Rot), has been identified as one of the major pro-oxidative fac-tors causing Parkinson’s disease (PD) [14-16]. Animal studies showed that chronic exposure to Rot repro-duces features of Parkinsonism in rats [17, 18], and selenium (Se), a trace element possessing antioxidant properties, prevented or slowed down neuronal injury in mouse PD models [19, 20].
2.
Materials and Methods
CellsHT22 cells were maintained in Dulbecco’s Modi-fied Eagle Medium with 10% fetal bovine serum, 15 µg/ml gentamicin, 50 µg/ml ampicillin, and 4 mM L-glutamine supplement, in 5% CO2 at 37°C, 50 %
relative humidity.
Chemicals
Dihydroethidium (hydroethidine, HEt) was purchased from Molecular Probes (Carlsbad, CA). GSH/GSSG-412 TM assay kit was purchased from Oxis
(Foster City, CA). RNeasy Mini Kit was purchased from Qiagen (Valencia, CA). SuperScript III First-Strand synthesis system and Platinum SYBR Green qPCR SuperMix-UDG kit were purchased from Invitrogen (Carlsbad, CA). All other chemicals were purchased from Sigma (St. Louis, MO).
Instruments
A Beckman Coulter Epics XL-MCL flow cytome-ter (Fullerton, CA) was used to measure the mean fluorescence intensity of the oxidized HEt to indicate the intracellular ROS level, a DU7500 Spectropho-tometer (Beckman, Fullerton, CA) was used for total glutathione (GSH) and glutathione peroxidase (GPx) activity assays, and a LightCycler 2.0 real-time PCR machine (Roche, Indianapolis, IN) was used for the relative quantification on the mRNA levels.
Cell culture, treatment and harvesting
HT22 cells were seeded at a density of 4.5e4 cells /cm2 in multi-well cell culture plates (Costar,
Be-thesda, MA) 20 h before treatments. To monitor the superoxide-inducing effect of different chemicals, cells were incubated in culture media containing Rot, MA, AA or ST at desired concentrations for 30 min. The same amount of dimethyl sulfoxide (DMSO, solvent control) was applied in the culture media of the control cells.
To study the time-dependent change of intracel-lular superoxide level after withdrawal of the ETC inhibitors, the cells were allowed to recover in normal medium for 0.5 – 8 hours after treatment with ETC-inhibitors for 30 min and washed once with warm PBS. DMSO-treated cells were used as controls. Prop-erly treated cells were then harvested and subjected to flow cytometric assay.
For Se supplementation, the cells were seeded at a density of 4.5e4 cells /cm2 in 100 mm cell culture
dishes, and incubated with 100 nM sodium selenite for 24 h. Cells were then subjected to 1.25 μM Rot treat-ment (a concentration that causes decrease in total in-tracellular GSH level in HT22 cells) for 30 min, washed twice with cold PBS, collected and centrifuged at 5000 x g for 5 min. The pellet was sonicated in cold PBS. The cell lysate was centrifuged for 10 min at 10,000 x g, the supernatant was collected for GSH and GPx assays.
For gene expression quantification, the cells were seeded at a density of 4.5e4 cells /cm2 in 100 mm cell
culture dishes and incubated with culture media
con-taining 0.5 µM Rot for 16 h, with cells treated with equal amount of DMSO as control. The cells were also treated with 0.5 µM of Rot for 0, 0.5, 4, and 16 h to monitor the onset time in gene regulation. RNA was harvested from the cells for real-time PCR quantifica-tion of the expression of genes of interest.
Flow Cytometric assay
After desired treatments, the cells were incubated with Hank’s Balanced Salt Solution containing 5 µM of HEt for 30 min, allowing the dye to enter into the cells and get oxidized by superoxide. Then the cell culture plates were placed on ice, cells were washed with ice-cold PBS once, trypsinized, and re-suspend in se-rum-free culture medium. Samples were kept on ice and protected from light before the flow cytometric assay. Five thousand cells were counted for each mean fluorescent intensity value.
Quantification of gene expression by real-time PCR
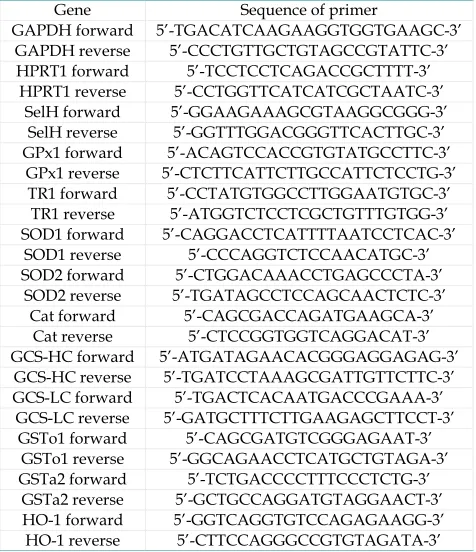
The expression levels of mRNAs encoding ROS scavenging enzymes, phase II enzymes and some se-lenoproteins were quantified using real-time PCR in the Rot-treated HT22 cells, using DMSO-treat cells as control. The enzymes directly scavenging ROS in-cluded glutathione peroxidase 1 (GPx1, also a se-lenoenzyme), catalase (Cat), superoxide dismutases 1 and 2 (SOD1, SOD2); phase II enzymes included glu-tamylcysteine synthetase heavy chain and light chain (GCS-HC, GCS-LC); glutathione S-transferase omega 1 and alpha 2 (GSTo1, GSTa2), and heme oxygenase-1 (HO-1); selenoproteins thioredoxin reductases 1 (TR1), and selenoprotein H (SelH) were also investigated. Table 1. Primers used for real-time PCR for specific cDNA amplification.
Gene Sequence of primer
GAPDH forward 5’-TGACATCAAGAAGGTGGTGAAGC-3’ GAPDH reverse 5’-CCCTGTTGCTGTAGCCGTATTC-3’ HPRT1 forward 5’-TCCTCCTCAGACCGCTTTT-3’
HPRT1 reverse 5’-CCTGGTTCATCATCGCTAATC-3’
SelH forward 5’-GGAAGAAAGCGTAAGGCGGG-3’
SelH reverse 5’-GGTTTGGACGGGTTCACTTGC-3’ GPx1 forward 5’-ACAGTCCACCGTGTATGCCTTC-3’
GPx1 reverse 5’-CTCTTCATTCTTGCCATTCTCCTG-3’ TR1 forward 5’-CCTATGTGGCCTTGGAATGTGC-3’
TR1 reverse 5’-ATGGTCTCCTCGCTGTTTGTGG-3’ SOD1 forward 5’-CAGGACCTCATTTTAATCCTCAC-3’
SOD1 reverse 5’-CCCAGGTCTCCAACATGC-3’
SOD2 forward 5’-CTGGACAAACCTGAGCCCTA-3’
SOD2 reverse 5’-TGATAGCCTCCAGCAACTCTC-3’
Cat forward 5’-CAGCGACCAGATGAAGCA-3’
Cat reverse 5’-CTCCGGTGGTCAGGACAT-3’
GCS-HC forward 5’-ATGATAGAACACGGGAGGAGAG-3’ GCS-HC reverse 5’-TGATCCTAAAGCGATTGTTCTTC-3’ GCS-LC forward 5’-TGACTCACAATGACCCGAAA-3’
GCS-LC reverse 5’-GATGCTTTCTTGAAGAGCTTCCT-3’
GSTo1 forward 5’-CAGCGATGTCGGGAGAAT-3’
GSTo1 reverse 5’-GGCAGAACCTCATGCTGTAGA-3’ GSTa2 forward 5’-TCTGACCCCTTTCCCTCTG-3’
Total RNA was harvested using RNeasy mini kit. cDNA were synthesized from the RNA extracts using SuperScript III First-Strand synthesis system (Invitro-gen). The specific primers used for real-time PCR on the housekeeping genes (GAPDH, glyceralde-hyde-3-phosphate dehydrogenase; HPRT1, hypoxan-thine phosphoribosyltransferase 1) and target genes are listed in Table 1. All PCR reactions were performed in 10 μl reaction volume using Platinum SYBR Green qPCR SuperMix-UDG kit (Invitrogen). The amplifica-tion and detecamplifica-tion were carried out using a LightCy-cler 2.0 real-time PCR machine (Roche).
GSH measurement
The total intracellular GSH assay was carried out using the GSH/GSSG-412 TM (OXIS) assay kit
follow-ing the manufacturer’s instructions.
GPx activity assay
The assay was based on the classical principle [21] with optimization to the HT22 cell lysate. The peroxide used in this study was t-butyl hydroperoxide (0.32 mM), the concentration of GSH was 1.88 mM, and the pH of the assay was 7.6. The unit of GPx activity was defined as 1mU = 1 nmole NADPH oxidized per min.
Statistical analysis
GraphPad Prism 4 software was used for un-paired two-tailed t-test or two-way ANOVA analysis. P ≤ 0.05 was considered statistically significant. * in-dicates 0.01< P ≤ 0.05; ** indicates 0.001< P ≤ 0.01; *** indicates P ≤ 0.001.
3.
Results
Rotenone treatment induced the highest intracel-lular superoxide level
Different concentrations of ETC-inhibitors were used to treat HT22 cells. Specifically they were: Rot 0 – 2.5 µM, MA 0 – 15 mM, AA 0 - 40 µM, and ST 0 – 30 µM. The dose-response curves are summarized in Figure 1. Rot treatment most efficiently increased the intracellular superoxide generation to 300% of the control level, followed by the treatments of MA (180%), ST (150%), and AA (130%).
Change of superoxide overproduction after with-drawal of ETC-inhibitors
After 30 min treatment with Rot, MA, AA, or ST, the cells were allowed to recover in normal medium as described above. As shown in Figure 2, upon the withdrawal of Rot, within 30 min the Rot-induced su-peroxide decreased by ~40%, and the level was main-tained for the next 7.5 hours. Removing MA from the medium reduced superoxide level by over 90% within 30 min. Surprisingly, when AA and ST were removed, the superoxide levels decreased to about 50% at 3 h, but increased to 110-150% at 8 h.
Figure 1. The increase of intracellular superoxide level in-duced by inhibitors of the electron transport chain. The concentration HT22 cells were treated for 30 min with rotenone (0-2.5 µM), malonate (0-15 mM), antimycin A (0-40 µM) and stigmatellin (0-30 µM). DMSO treated cells were used as con-trol. The intracellular superoxide level was indicated by the fluorescent intensity of oxidized hydroethidine. Average values and SD are shown, N=3.
Figure 2.The change of intracellular superoxide level after withdrawal of the inhibitors of electron transport chain.
HT22 cells were treated with rotenone (0.5 µM), malonate (5 mM), antimycin A (20 µM) and stigmatellin (20 µM) for 30 min, then washed and recovered in normal medium for up to 8 h. Average values and SD are shown, N=3.
The responses of oxidative stress-related genes to Rotenone treatment
re-ductase 1 were upregulated by 30-50%. Using either HPRT1 or GAPDH as housekeeping gene for nor-malization resulted in similar change. We also ob-served that the onset of the change of expression of different genes differed, e.g. the expression of GCS-HC increased 2 folds at 4 h, but the increase of HO-1 mRNA did not occur until 16 h.
Figure 3. Effects of rotenone treatment on gene expression in HT22 cells. The gene expression level of superoxide dis-mutase 1 and 2 (SOD1, SOD2), glutathione peroxide 1 (GPx1), catalase (Cat), glutamylcysteine synthetase heavy chain and light chain (GCS-HC, GCS-LC), glutathione s-transferase omega 1 and alpha 2 (GSTo1, GSTa2), heme oxygenase 1 (HO-1), thioredoxin reductase 1 (TR1), and selenoprotein H (SelH) in HT22 cells after treatment with 0.5 µM rotenone for 16 h. Average values and SD are shown.
The protective effects of Se supplementation on the antioxidant status
The HT22 cells were supplemented with 100 nM sodium selenite for 24 h before challenge with 1.25 μM Rot for 30 min, then the total cellular GSH level and GPx activity were analyzed. As shown in Figure 4A, without Se supplementation, the total cellular GSH level (normalized to a protein concentration of 1 mg/ml) decreased from 29.9 ± 0.9 µM to 24.4 ± 1.2 µM after the Rot treatment. Se supplementation signifi-cantly increased the baseline of GSH level in the cells to 44.0 ± 1.0 µM, and abolished the Rot-induced GSH decrease.
Figure 4B shows that in normal medium, similar activities of GPx (normalized to a protein concentra-tion of 1 mg/ml) were observed in HT22 cells when treated with DMSO (2.3 ± 0.6 mU) and Rot (2.9 ± 0.2 mU). However, Se supplementation rendered signifi-cant increase in GPx activity under DMSO (33.1 ± 6.5 mU) and Rot (26.4 ± 5.7 mU) treatments.
Two-way ANOVA was also performed to ana-lyze the influence of Se status and Rot treatment as independent factors and their combined effect. The result shows that for both GSH and GPx, the influence of Se status is significant (P<0.001), and the combina-tion of Se status and Rot treatment also has significant influence on GSH level (P=0.0023).
Figure 4. Effects of selenium supplementation and rotenone treatment on (A) total glutathione level and (B) glutathione peroxidase activity in HT22 cells. HT22 cells were incubated with medium containing 100 nM sodium selenite for 24 h, then treated by 1.25 µM rotenone for 30 min in normal medium. Average values and SD are shown, N=3. In Panel B, the statis-tical comparisons are between Se Supplementation and normal medium after DMSO or Rot treatment.
4.
Discussion
HT22 cell line is vulnerable to glutathione (GSH) depletion [22], and is a sensitive model for monitoring cellular responses to oxidative stress. It has been shown that the primary ROS-generating site in ETC can be different in different types of cells [10-13]. Our study indicates complex I is the major superox-ide-producing site in HT22 cells since Rot treatment induced the highest level of intracellular ROS in com-parison to the treatments with other ETC-inhibitors.
submito-chondrial particles from seven mammalian species [26]. The dose response of HT22 cells to Rot treatment is similar to those reported for isolated mitochondria and HL-60 cells in culture [24].
Approximately half of the Rot-induced superox-ide was readily removable within 30 min after the withdrawal of Rot, but the rest remained for up to 8 h. This result indicates that Rot may induce superoxide through different mechanisms, e.g. reversible and high-dosage-demanding, versus irreversible and/or low-dosage-demanding. A neurotoxicity study showed that a short exposure to Rot at high concen-trations reduced the viability of both dopaminergic and non-dopaminergic neurons, while chronic treat-ment with low-concentrations of Rot caused selective toxicity to dopaminergic neurons [27]. Considering the vulnerability of dopaminergic neurons in PD, the low-dosage-demanding Rot toxicity indicated in the present study may be more involved in the patho-genesis. This consideration also questions the neuro-logical safety of the potential therapeutic strategy of administration of Rot before myocardial ischemia oc-curs to decrease damage to the myocardium [28, 29].
Complex II dysfunction has been related to neu-rodegenerative diseases such as Huntington’s disease, as well as hypoxia-dependent generation of ROS in lungs [30]. In mice and rats, MA injection in the stria-tum produced a significant reduction in cytochrome oxidase activity in the tissue [31]. MA affected rat brain mitochondrial function and neuronal survival, medi-ated by ROS and mitochondrial permeability transi-tion at a significantly lower level of respiratory inhibi-tion in comparison to mitochondria isolated from liver and kidney [32]. The present study shows that super-oxide is highly inducible by MA in neuronal HT22 cells, but the induced superoxide is readily reversible upon malonate withdrawal.
Stigmatellin blocks electron flow at the Qo site of
complex III by binding to the heme b-566 domain of cytochrome b as well as to the iron-sulfur protein [8, 9]. Structural study of native complex III indicated that binding of stigmatellin to the reduced iron-sulfur pro-tein at Qo center may be involved in the rate limiting
reaction at this site [33]. Blockade of complex III by stigmatellin generates ROS through complex I by electron accumulation at this upstream complex [7]; at the same time, stigmatellin at higher concentrations also stimulates superoxide production by inhibiting complex I at the rotenone site [34]. Antimycin A inhib-its reduction of ubiquinone and ubisemiquinone anion by cytochrome b heme-560 at Qi center [8], increasing
the ROS generation from Qo center [7], which is
re-leased into the cytoplasm through an anion channel [30, 35, 36]. When mitochondria isolated from rat heart inhibited by antimycin A, a large amount of superox-ide was produced [7, 37]. However, the present study showed only 20-30% of increase of superoxide genera-tion in HT22 cells after antimycin A treatment at satu-rating concentration. The different responses might be due to tissue specificity, which alters the ratios and activities of complexes in the respiratory chain in
mi-tochondrion [35]. The reason of the biphaseic response of the HT22 cells to the removal of inhibitors on com-plex III (Figure 2) is unknown.
Figure 3 indicates that the ability of direct scav-enging Rot-induced ROS may be compromised in HT22 cells since the expression of the enzymes that dismutate superoxide (SOD1, SOD2) or reduce hy-drogen peroxide (GPx1, catalase) was decreased fol-lowing the Rot treatment. On the other hand, GCS-HC and GCS-LH, subunits of the rate-limiting enzyme in the GSH de novo synthesis pathway, was up-regulated by 30-100%. Other phase II enzymes such as GSTs, and HO-1 were also up-regulated, indicating the signifi-cance of involvement of phase II enzymes in combat-ing the oxidative stress.
Se is thought to exert most of its biological effects through its incorporation into selenoproteins. Se status has been shown to modulate redox-regulated tran-scription factors such as AP-1 and NF-kappaB [38, 39]. It has been found to affect the pathogenesis of PD in animal models. For example, Se supplementation was reported to ameliorate brain tissue damage in 6-hydroxydopamine treated mice by sustaining the GSH level in the tissues and decreasing oxidative stress [19]. In this study we found in a cell culture model that Se supplementation increased the baseline level of total GSH concentration and prevented Rot-induced GSH depletion. We also found that the gene expression of 2 selenoproteins possessing im-portant regulatory function [40] was upregulated by Rot treatment, indicating the possibility of existence of other pathways in Se-related protective effects.
The GPx activity assay in this study measured the total activity of GPxs that use BHPx and GSH as sub-strates. Out of the seven GPxs that have been identified to date, GPx7 and mouse GPx6 are non-selenoproteins, therefore they are not likely to be dramatically influ-enced by Se supplementation. GPx2 (gastrointestinal GPx) and GPx5 (sperm nuclei GPx) have tissue specific localization, while the expression of GPx3 (extracellu-lar GPx) was found to be extremely low in mouse brain [41]. Our unpublished data showed that GPx4 (phos-pholipid hydroperoxide glutathione peroxidase) is highly expressed in HT22 cells, but its mRNA level was not significantly influenced by Se supplementa-tion. On the other hand, the expression of GPx1 (cyto-solic GPx) is highly responsive to Se status. Using BHPx as substrate, the activity obtained from GPx4 is only 10% of that contributed by GPx1 [42]. Therefore, the increased GPx activity after Se supplementation observed in this study is most likely attributable to GPx1, as potentially counteracts the downregulation of GPx1 expression by long-term Rot treatment.
5.
Conclusion
have a protective role in rotenone-induced oxidative stress.
Acknowledgment
This study was supported by Hawaii Commu-nity Foundation grant # 20050404 (Panee) and NIH grant RO1-NS40302 (Berry).
Conflict of interest
The authors have declared that no conflict of in-terest exists.
References
1. Boveris A and Chance B. The mitochondrial generation of hy-drogen peroxide. General properties and effect of hyperbaric oxygen. Biochem J 1973. 134: 707-716.
2. Chance B, Sies H, and Boveris A. Hydroperoxide metabolism in mammalian organs. Physiol Rev., 1979. 59: 527-605.
3. Shigenaga MK, Hagen TM, and Ames BN. Oxidative damage and mitochondnial decay in aging. Proc.Nail. Acad.Sci. USA, 1994. 91: 10771-10778.
4. Cortopassi, C and Wang E. Modelling the effects of age-related mtDNA mutationaccumulation:complex I deficiency, su-perox-ide and cell death. Biochim. Biophys. Acta, 1995. 1271: i7i-i76.
5. Buchanan, SK and Walker JE. Large-scale chromatographic purification of F1F0-ATPase and complex I from bovine heart mitochondria. Biochem. J., 1996. 318: 343-349.
6. Okun JG, Lummen P, and Brandt U. Three classes of inhibitors share a common binding domain in mitochondrial complex I (NADH:ubiquinone oxidoreductase). J. Biol. Chem., 1999. 274: 2625-2630.
7. Chen Q, Vazquez EJ, Moghaddas S, Hoppel CL, and Lesnef-sky EJ. Production of reactive oxygen spqcies by mitochondria, cen-tral role of complex III. J. Biol. Chem., 2003. 278: 36027-36031. 8. Trumpower BL. The protonmotive Q cycle. J. Biol. Chem., 1990.
265: 11409-11412.
9. von Jagow G and Ohnishi T. The chromone inhibitor stig-matel-lin--binding to the ubiquinol oxidation center at the C-side of the mitochondrial membrane. FEBS Lett, 1985. 185: 311-315. 10. Cadenas E, Boveris A, Ragan CI, and Stoppani AOM.
Pro-duc-tion of superoxide radicals and hydrogen peroxide by NADH-ubiquinone reductase and ubiquinol-cytochrome c re-ductase from beef-heart mitochondria. Arch. Biochem. Bio-phys., 1977. 180: 248-257.
11. Turrens, JF and Boveris A. Generation of superoxide anion by the NADH dehydrogenase of bovine heart mitochondria. Bio-chem. J., 1980. 191: 421-427.
12. Turrens JF, Alexandre A, and Lehninger AL. Ubisemiquinone is the electron donor for superoxide formation by complex III of heart mitochondria. Arch. Biochem. Biophys., 1985. 237: 408-414. 13. Liu Y, Fiskum G, and Schubert D. Generation of reactive oxy-gen species by the mitochondrial electron transport chain. J. Neuro-chem., 2002. 80: 780-787.
14. Kweon GR, Marks JD, Krencik R, Leung EH, Schumacker PT, Hyland K, and Kang UJ. Distinct mechanisms of neurode-gen-eration induced by chronic complex I inhibition in dopa-minergic and non-dopadopa-minergic cells. J Biol Chem, 2004. 279: 51783-51792.
15. Petrovitch H, Ross GW, Abbott RD, Sanderson WT, Sharp DS, Tanner CM, Masaki KH, Blanchette PL, Popper JS, Foley D, Launer L, and White LR. Plantation work and risk of Parkinson disease in a population-based longitudinal study. Arch Neurol, 2002. 59: 1787-1792.
16. Semchuk KM, Love EJ, and Lee RG. Parkinson's disease and exposure to agricultural work and pesticide chemicals. Neu-rol-ogy, 1992. 42: 1328-1335.
17. Betarbet R, Sherer TB, Mackenzie G, Garcia-Osuna M, Panov AV, and Greenamyre JT. Chronic sysmetic pesticide exposure re-produces features of Parkinson’s disease. Nat Neurosci, 2000. 3: 1301-1306.
18. Alam, M and Schmidt WJ. Rotenone destroys dopaminergic neurons and induces parkinsonian symptoms in rats. Behav Brain Res, 2002. 136: 317-324.
19. Zafar KS, Siddiqui A, Sayeed I, Ahmad M, Salim S, and Islam F. Dose-dependent protective effect of selenium in rat model of Parkinson's disease: neurobehavioral and neurochemical evi-dences. J Neurochem., 2003. 84: 438-46.
20. Kim HC, Jhoo WK, Choi DY, Im DH, Shin EJ, Suh JH, Floyd RA, and Bing G. Protection of methamphetamine nigrostriatal toxic-ity by dietary selenium. Brain Res., 1999. 851: 76-86.
21. Paglia, D and Valentine W. Studies on the quantitative and qualitative characteristics of the erythrocyte glutathione per-oxidase. J Lab Clin Med, 1967. 70: 158-169.
22. Davis, JB and Maher P. Protein kinase C activation inhibits glu-tamate-induced cytotoxicity in a neuronal cell line. Brain Re-search, 1994. 652: 169-173.
23. Sherer TB, betarbet R, Testa CM, Seo BB, Richardson JR, Kim JH, Miller GW, Yagi T, Matsuno-Yagi A, and Greenamyre JT. Mechanism of toxicity in rotenone models of Parkinson's dis-ease. J Neurosci, 2003. 23: 10756-10764.
24. Li N, Ragheb K, Lawler G, Sturgis J, Rajwa B, Melendez JA, and Robinson JP. Mitochondrail complex I inhibitor rotenone in-duces apoptosis through enhancing mitochondrial reactive oxygen species production. J Biol Chem., 2003. 278: 8516-8525. 25. Kudin AP, Bimpong-Buta NY, Vielhaber S, Elger CE, and Kunz
WS. Characterization of superoxide-producing sites in isolated brain mitochondria. J Biol Chem, 2003. 279: 4127-4135.
26. Herrero, A and Barja G. Localization of the site of oxygen radi-cal generation inside the complex I of heart and nonsynaptic brain mammalian mitochondria. J Bioenerg Biomembr., 2000. 32: 609-615.
27. Sakka N, Sawada H, Izumi Y, Kume T, Katsuki H, Kaneko S, Shimohama S, and Akaike A. Dopamine is involved in se-lec-tivity of dopaminergic neuronal death by rotenone. Neu-rore-port., 2003. 14: 2425-2428.
28. Lesnefsky EJ, Chen Q, Moghaddas S, Hassan MO, Tandler B, and Hoppel CL. Blockade of electron transport during ischemia protects cardiac mitochondria. J Biol Chem., 2004. 279: 47961-47967.
29. Ockaili RA, Bhargava P, and Kukreja RC. Chemical pre-condi-tioning with 3-nitropropionic acid in hearts: role of mito-chon-drial K(ATP) channel. Am J Physiol Heart Circ Physiol., 2001. 280: H2406-H2411.
30. Weissmann N, Ebert N, Ahrens M, Ghofrani HA, Schermuly RT, Hanze J, Fink L, Rose F, Conzen J, Seeger W, and Grim-minger F. Effects of mitochondrial inhibitors and uncouplers on hypoxic vasoconstriction in rabbit lungs. Am J Respir Cell Mol Biol., 2003. 29: 721-732.
31. Lastres-Becker I, Bizat N, Boyer F, Hantraye P, Brouillet E, and Fernandez-Ruiz J. Effects of cannabinoids in the rat model of huntington’s disease generated by an intrastriatal injection of malonate. Neuroreport, 2003. 14: 813-816.
32. Maciel EN, Kowaltowski AJ, Schwalm FD, Rodrigues JM, Souza DO, Vercesi AE, Wajner M, and Castilho RF. Mito-chondrial permeability transition in neuronal damage promoted by Ca2+ and respiratory chain complex II inhibition. J Neuro-chem, 2004. 90: 1025-1035.
33. Crofts AR, Shinkarev VP, Dikanov SA, Samoilova RI, and Kolling D. Interactions of quinone with the iron-sulfur protein of the bc(1) complex: is the mechanism spring-loaded? Biochim Bio-phys Acta., 2002. 1555: 48-53.
common inhibitors acting as ubiquinone antagonists. Biochem Biophys Res Commun., 1993. 190: 1090-1096.
35. St-Pierre J, Buckingham JA, Roebuck SJ, and Brand MD. To-pology of superoxide production from dofferent sites in the mi-tochondrial electron transport chain. J. Biol. Chem., 2002. 277: 44784-44790.
36. Han D, Williams E, and Cadenas E. Mitochondrial respiratory chain-dependent generation of superoxide anion and its release into the intermembrane space. Biochem J., 2001. 353: 411-416. 37. Raha S, McEachern GE, Myint AT, and Robinson BH.
Su-per-oxide from mitochondrial complex III: the role of manganese superoxide dismutase. Free Radic Biol Med, 2000. 29: 170-180. 38. Spyrou G, Bjornstedt M, Kumar S, and Holmgren A. AP-1
DNA-binding activity is inhibited by selenite and selenodi-glu-tathione. FEBS Lett, 1995. 368: 59-63.
39. Kim, IY and Stadtman TC. Inhibition of NF-kappaB DNA bind-ing and nitric oxide induction in human T cells and lung ade-nocarcinoma cells by selenite treatment. Proc Natl Acad Sci U S A, 1997. 94: 12904-7.
40. Rundlof, AK and Arner ES. Regulation of the mammalian se-lenoprotein thioredoxin reductase 1 in relation to cellular phe-notype, growth, and signaling events. Antioxid Redox Sig-nal, 2004. 6: 41-52.
41. Maser RL, Magenheimer BS, and Calvet JP. Mouse plasma glu-tathione peroxidase. cDNA sequence analysis and renal proxi-mal tubular expression and secretion. J Biol Chem 1994. 269: 27066-73.