Original Research Article
Study of socio-demographic determinants and body mass index of
female class IV employees (Aayas and Mehatranis) at a municipal
tertiary care teaching hospital in Mumbai, India
Bhagyashri D. Gawari, Sujata R. Lavangare*, Gajanan D. Velhal
INTRODUCTION
According to census 2011, India’s population had crossed 1.21 billion, of these 63.6% are in working age group.1 The current burden of occupational health diseases in India is estimated to be around 18 million cases. It is a known fact that the occupational profile of an individual influences his health status. Problems encountered at the workplace affect not only a worker’s health, safety, productivity, financial health but also adversely affects
the workplace environment, family members of the individual and the community around.2 Health care professionals (including class IV employees) are the most ignorant as far as their own health is concerned. They are victims of lifestyle diseases due to their stressful schedules and high degree of professional responsibility. The situation calls for a serious move to have some standards of care for all healthcare workers to minimize exposure to health debilitating conditions.3
ABSTRACT
Background: Health care professionals (including class IV employees) are the most ignorant as far as their own health is concerned. Problems encountered at the workplace affect not only a worker’s health but also adversely affects the workplace environment. Today is an era of women who have diverse role to play in the society and often they handle multiple tasks simultaneously. They are therefore prone to suffer from work related diseases, which are further complicated by various social (responsibilities at home), psychological and physiological (e.g., pregnancy) issues.
Methods: A cross-sectional study was carried out amongst 287 female class IV employees of municipal tertiary care teaching hospital in Mumbai during the period of April 2017 to December 2018. A semi-structured interview schedule was prepared comprising of socio-demographic determinants and BMI. Data was entered in MS Excel sheet and were analyzed in the form of percentage and proportions whenever necessary.
Results: Out of total 287 participants, 101 (35.2%) belonged to age group of 41-50 years, more than half 168 (58.5%) were widows and majority 231 (80.5%) were Hindu by religion, 124 (43.2%) belonged to upper middle class, 158 (55.0%) belonged to a nuclear family and 44 (15.3%) had to travel more than 60 kms daily to reach at workplace.
Conclusions: Study concluded that 35.2% participants were 41-50 years age group and 80.5% were Hindu by religion and 43.2% belonged to the upper middle class. Only 2.1% respondents had completed their graduation. More than half i.e. 55.1% of the participants were having normal body mass index and 10.5% were obese.
Keywords: Socio-demographic determinants, Body mass index, Female class IV employees, Tertiary care teaching hospital
Department ofCommunity Medicine, Seth G. S. Medical College, and KEM Hospital, Mumbai, Maharashtra, India
Received: 21 September 2019
Revised: 15 October 2019
Accepted: 16 October 2019
*Correspondence:
Dr. Sujata R. Lavangare,
E-mail: [email protected]
Copyright: © the author(s), publisher and licensee Medip Academy. This is an open-access article distributed under the terms of the Creative Commons Attribution Non-Commercial License, which permits unrestricted non-commercial use, distribution, and reproduction in any medium, provided the original work is properly cited.
According to International Labour Organization (ILO), groups of women workers are at particular risk because their problems are overlooked.4 Today is an era of women who have diverse role to play in the society and often they handle multiple tasks simultaneously. They are therefore prone to suffer from work related diseases, which are further complicated by various social
(responsibilities at home), psychological and
physiological (e.g., pregnancy) issues. Roughly one in every 300 females is suffering from some kind of occupation related disease.5
Hence keeping this in mind, the present study was carried out to study the socio-demographic determinants and body mass index of female class IV employees (Aayas and Mehatranis) in a municipal tertiary care teaching hospital in Mumbai, Maharashtra, India.
METHODS
A cross-sectional observational study was carried out amongst 287 female class IV employees (Aayas and Mehatranis) of municipal tertiary care teaching hospital in Mumbai, Maharashtra during the period of April 2017 to December 2018. As per attendance muster of class IV employees in the tertiary care teaching hospital, which has 1579 employees, of them 324 employees were females and working as a Aayas and Mehatranis. Out of these 324 female employees, 7 employees were chronically absent and remaining 30 employees did not fulfil either inclusion or exclusion criteria of the study. Hence 287 female class IV employees were interviewed and examined after obtaining informed consent for those who met inclusion criteria.
An inclusion criterion was the subjects who were willing to participate in the study and have been working in this profession for a period not less than five years. Exclusion criteria was the subjects who were absent for past 6 months or more and with major illness (for e.g. cancer, kidney failure, organ transplant, deafness, major burns, chronic lung disease, chronic liver disease) prior to employment and those who were not willing to participate in the study.
A semi-structured interview schedule was prepared comprising ofsocio-demographic profile and body mass index. Socio-economic status was determined using Modified B.G. Prasad’s Classification.6 The ethics
committee of the institute approved the study. Informed
consent of each workerwas taken. Data collection was done at the site of work during the duty hours. Data was entered in MS Excel sheet and were analyzed in the form of percentage and proportions whenever necessary.
Operational definitions
Aayas: Female class IV employee who perform the duties
like patient care, assist doctors and nurses, assisting with hospital equipment and basic housekeeping duties.
Mehatranis: The major work of these female employees includes cleaning, waste collection and disposal.
RESULTS
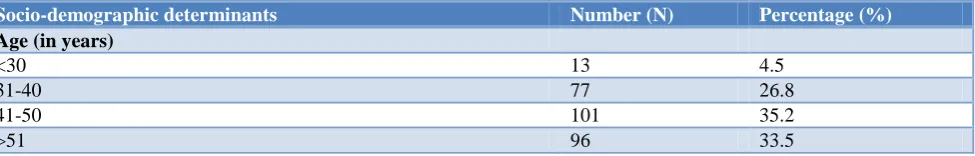
As Table 1 shows that the socio-demographic characterstics of study population, out of 287 study subjects, 101 (35.2%) belonged to the age group of 41-50 years followed by 96 (33.5%) in the age group of more than 50 years, and 77 (26.8%) belonged to 31-40 years age group. More than half 168 (58.5%) were widow followed by 99 (34.5%) were married, while 15 (5.2%) were unmarried, 3 (1.0%) were divorced and 2 (0.8%) were separated. On religion wise distribution of participants, out of 287 participants majority 231 (80.5%) were Hindu by religion followed by 47 (16.4%) were Buddhist, 5 (1.7%) were Christian religion and 4 (1.4%) were Muslim. Maximum 175 (61.0%) study subjects had education up to secondary school followed by 53 (18.5%) were illiterate, 36 (12.5%) studied in primary school, 17 (5.9%) studied higher secondary school and only 6 (2.1%) learned up to the graduation. Maximum158 (55.0%) had nuclear family followed by 111 (38.7%) had joint family and only 18 (6.3%) had three generation family. According to the modified B.G. Prasad’s socio-economic classification, majority 124 (43.2%) belonged to upper middle class followed by 100 (34.8%) were in upper class and only 3 (1.1%) were in lower class. Majority 150 (52.3%) study subjects were working for 10 years or less, followed by 64 (22.3%) for 11 to 20 years and 63 (22.0%) were for 21-30 years. Only 10 (3.4%) had service more than 30 years. Majority 211 (73.6%) study subjects had their own houses to stay, 40 (13.9%) were staying in rented houses and 36 (12.5%) were residing at quarters provided by the hospital authority. Majority i.e. 146 (50.9%) had to travel up to 30 kms, followed by 97 (33.8%) had to travel 30-60 kms and 44 (15.3%) had to travel more than 60 kms daily to reach at workplace.
Table 1: Socio-demographic determinants of the study population (n=287).
Socio-demographic determinants Number (N) Percentage (%)
Age (in years)
<30 13 4.5
31-40 77 26.8
41-50 101 35.2
>51 96 33.5
Socio-demographic determinants Number (N) Percentage (%) Marital status
Married 99 34.5
Unmarried 15 5.2
Divorced 03 1.0
Widow 168 58.5
Seperated 02 0.8
Religion
Hindu 231 80.5
Buddhist 47 16.4
Muslim 04 1.4
Christian 05 1.7
Educational status
Illiterate 53 18.5
Primary 36 12.5
Secondary 175 61.0
Higher Secondary 17 5.9
Graduate 06 2.1
Type of family
Nuclear family 158 55.0
Joint family 111 38.7
Three generation family 18 6.3
Socio-economic status*
Upper class (I) 100 34.8
Upper middle class (II) 124 43.2
Lower middle class (III) 40 14.0
Upper lower class (IV) 20 7.0
Lower class (V) 03 1.1
Length of service (in years)
<10 150 52.3
11-20 64 22.3
21-30 63 22.0
>30 10 3.4
House ownership status
Own house 211 73.6
Rented house 40 13.9
BMC quarter 36 12.5
Distance from workplace
<30 km 146 50.9
30-60 km 97 33.8
>60 km 44 15.3
*According to modified B. G. Prasad classification.
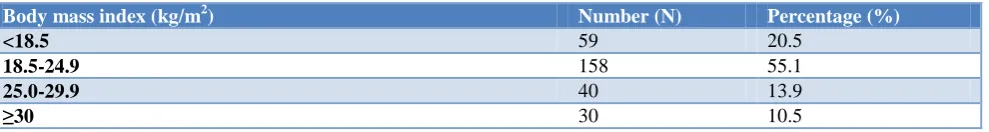
Table 2: Distribution of study population according to body mass index (n=287).
Body mass index (kg/m2) Number (N) Percentage (%)
<18.5 59 20.5
18.5-24.9 158 55.1
25.0-29.9 40 13.9
≥30 30 10.5
As Table 2 shows that the distribution of study participants according to body mass index (BMI), majority 158 (55.1%) study subjects were having normal BMI i.e. in the range of 18.5-24.9 kg/m2 followed by 59 (20.5%) had underweight i.e. BMI less than 18.5 kg/m2
DISCUSSION
The present study shows that out of 287 study subjects, 101 (35.2%) belonged to the age group of 41-50 years followed by 96 (33.5%) in the age group of more than 50 years, and 77 (26.8%) belonged to 31-40 years age group and 13 (4.5%) belonged to less than 30 yrs. The mean, median and mode age of the study subjects was computed to be 45.61 years, 45 years and 40 years respectively, the range of the age group was 27-57 years. Similarly a study by Chhaya et alfound that the class IV female hospital employees, in their study mean age of the study participants was 42.5±7.2 years which was similar to findings of the present study.7 Another study by Palve et alin the sweepers in which 133 (49.8%) sweepers were in 39-48 years age group, 74 (27.7%) in 49-58 years age group, 55 (20.6%) in 28-38 years age group and only 5 (1.9%) were below 28 years of age.8Gore et al in their study, 150 (46.9%) study subjects were in 41-50 years age group and only 4 (1.3%) employees were in 21-30 years age group.9 Chakor et al carried out a cross sectional study on class IV employees in which 112 (65.5%) belonged to the age group of 45-55 years followed by 26 (15.2%) in 35-44 years of age.10 Dehmubed et alconducted a study on class IV employees of a tertiary care hospital, Mumbai in which (65.5%) belonged to the age group of 45-55 years and the range of the age was 26 years to 55 years.11 Ilesanmi conducted a study of cleaning staff in the hospital in southwest Nigeria in which the mean age of respondent was 34±7 years and range of the age was 20 to 60 years.12
Our study shows that majority 231 (80.5%) study subjects were by Hindu religion followed by 47 (16.4%) were Buddhist, 5 (1.7%) were Christian religion and 4 (1.4%) were Muslim. Similarly a study by Palve et al on sweepers in which most of the sweepers 244 (91.4%) were Hindu followed by Buddhist 21 (7.9%) and only 2 (0.7%) were Muslims by religion.8 Gore et al in their study, majority 284 (88.8%) of the study subjects were Hindu, followed by 27 (8.4%) were Buddhist and 7 (2.2%) were Muslims.9 Chakor et alcarried out study on class IV employees in which 142 (83%) belonged to Hindu religion and rest 29 (17%) belonged to Buddhist religion.10
Education status of study participants were 175 (61.0%) had education up to secondary school followed by 53 (18.5%) were illiterate, 36 (12.5%) studied up to primary school, 17 (5.9%) studied up to higher secondary school and only 6 (2.1%) learned up to the graduation. Similarly a study by Palve et al in which 164 (61.4%) subjects were educated up to secondary, 41 (15.4%) upto primary level and only 8 (3.0%) up to higher secondary.8 Gore et al in their study, 238 (74.4%) class IV employees were primary educated, 53 (16.6%) were illiterate and only 4 (1.3%) were higher secondary educated.9 Chakor et al study in which 105 (61.4%) had studied upto secondary level, 9.9% had completed their graduation and only 7.0% of the respondents were illiterates.10 Ilesanmi in their
study, 171 (68.6%) respondents attendedsecondary school, 55 (22.1%) had primary and 23 (9.2%) had tertiary education.12
On family wise distribution of participants, out of 287 participants more than half 158 (55.0%) had nuclear family followed by 111 (38.7%) had joint family and only 18 (6.3%) had three generation family. Similarly Palve et al in their study, 193 (72.3%) had nuclear family, 69 (25.8%) had extended family and only 5 (1.9%) employees had joint family.8 Chakor et alstudy in which three-fourth (74.3%) of the respondents were from a nuclear family, around a one-third of the study subjects (22.5%) were living in a joint family and only 6 (3.5%) had three generation family.10
According to the modified B.G. Prasad’s socio-economic classification, majority 124 (43.2%) belonged to upper middle class followed by 100 (34.8%) were in upper class and only 3 (1.1%) were in lower class. Similarly a study by Palve et al in which out of their study subjects 124 (46.4%) were from poor class, 100 (37.5%) were lower middle class, 30 (11.2%) in upper middle class, 10 (3.7%) in below poverty line and 3 (1.1%) belonged to high class.8 Gore et al in their study 219 (68.4%) class IV employees were in class II and 93 (29.1%) were in class III.9 Chakor et al showed that (84.8%) participants in the study belonged to the lower middle class, followed by 9.4% upper lower and 5.8% upper middle class. None of the study subjects belonged to the upper (I) and lower class.10
Majority 211 (73.6%) had their own houses for living, 40 (13.9%) were residing in rented houses and 36 (12.5%) were staying at quarters provided by the hospital authority. Similarly Chakor et al study showed that out of 171 participants interviewed, majority 126 (73.7%) were living in rental house, 33 (19.3%) participants were residing in their own houses and 12 (7%) in MCGM quarters.10
Majority i.e. 146 (50.9%) had to travel up to 30 kms, followed by 97 (33.8%) had to travel 30-60 kms and 44 (15.3%) had to travel more than 60 kms daily to reach at workplace. Similarly a study by Chakor et al in which 85 (49.7%) were staying more than 10 kms away from the work place, 82 (48%) were residing within 5 kms of distance of hospital and 4 (2.3%) were staying within 5-10 kms of distance of hospital.10
In our study, more than half 158 (55.1%) subjects were having normal body mass index (BMI) followed by 59 (20.5%) were underweight, 40 (13.9%) were overweight and 30 (10.5%) were obese. Similarly a study by Palve et al found that 126 (47.2%) employees had normal body mass index, 20 (7.5%) were underweight, 90 (33.7%) were overweight and 31 (11.6%) were obese.8 Another study by Gore et al also found that, out of 320 employees, 139 (43.4%) had normal BMI, 27 (8.4%) were underweight, 76 (23.8%) were pre-obese and 78 (24.4%) were obese.9
CONCLUSION
The present study concluded that 35.2% participants were in the age group of 41-50 years and 80.5% were Hindu by religion and 43.2% belonged to the upper middle socio-economic class. Only 2.1% of the respondents had completed their graduation and 15.3% were staying more than 60 kms away from the workplace. Only 3.4% had service more than 30 years. Majority 73.6% study subjects had their own houses to stay and 13.9% were staying in rented houses. More than half 55.0% had nuclear family followed by 38.7% had joint family and only 6.3% had three generation family. More than half 55.1% participants were having normal body mass index (BMI) followed by 20.5% were underweight, 13.9% were overweight and 10.5% were obese.
ACKNOWLEDGEMENTS
We authors would like to thank Late Dr. Ratnendra R. Shinde, Head of Department of Community Medicine, Seth G. S. Medical College & KEM Hospital, Mumbai and also to Director (ME and MH), Mumbai and last but not the least, we thanks to all our study participants.
Funding: No funding sources Conflict of interest: None declared
Ethical approval: The study was approved by the Institutional Ethics Committee
REFERENCES
1. Census of India. 2011. Available at http://census india.gov.in/. Accessed on 12 March 12, 2017.
2. Moore Jr RM, Kaczmarek RG. Occupational
hazards to health care workers: diverse, ill-defined,
and not fully appreciated. American J Infection Control. 1990;18(5):316-27.
3. Kishore J. National Health Programs of India. 12th Edition. New Delhi: Century Publication; 2017: 480-481.
4. Kulkarni GK. Health of healthcare professionals. Indian J Occup Environ Med. 2006;10:95-6
5. Triolo PK. Occupational health hazards of hospital staff nurses. Part II: physical, chemical, and biological stressors. AAOHN J. 1989;37(7):274-79. 6. Rao TB. Sociology in Medicine. 1st edition. Guntur:
Sree Graphics; 2002: 76.
7. Chhaya V, Krishnan V. Musculo-skeletal
morbidities in class IV women employees of a tertiary care hospital: a cross-sectional survey. Int J Physiother Res. 2015;3(3):1048-52
8. Palve N, Shidhaye P. Chaturvedi R. Study of morbidity pattern and occupational hazards in sweepers working at a municipal teaching hospital in Mumbai. Int J Community Med Public Health. 2014;1(1):26-30
9. Harishchandra G, Shelke A. Working Environment and Occupational hazards in class IV employees in tertiary care hospital, Mumbai. GRA-Global Res Analysis. 2013;2(3):146-8.
10. Chakor PV, Dehmubed AS, Giri PA, Palwe NS. Study of socio-demographic determinants of class IV employees in a tertiary care teaching hospital in Mumbai. Indian J Basic Appl Med Res. 2014;4(1):39-43.
11. Dehmubed AS, Chakor PV, Giri PA, Palwe NS. Study of job satisfaction and absenteeism amongst class IV employees in tertiary care teaching hospital in Mumbai. Int J Healthcare Biomed Res. 2015;3:2-7.
12. Ilesanmi OS. Hazards of hospital cleaners in a tertiary health facility in Southwest Nigeria. Intl J Occupational Safety Health. 2016;2:4-10.