Original Research Article
A cross-sectional study on BMI and eating habits among students
in a medical college in Kerala
M. Amruth
1, Akshath Kumar
2*
INTRODUCTION
Body mass index values indicates the nutritional status of adults. BMI is an estimate of body fat based on weight and height of adult men and women. Higher body mass index (BMI) is associated with morbidity and mortality especially that related to diabetes mellitus and cardiovascular diseases.1 In 1997, a WHO expert committee classified a BMI of 25.0–29.9 kg/m2 as overweight, 30–34.9 kg/m2 as obesity and ≥35 kg/m2 as morbid obesity.2 Asia-Pacific guidelines for BMI classification were revised based on consensus developed
through discussions by a prevention and management of obesity and metabolic syndrome group. The revised guidelines categorize overweight as a BMI of 23.0–24.9 and obesity as a BMI ≥25 using values lower than the ethnic specific BMI previously advocated for Asian Indians (since they are more prone to central obesity).3,4
Obesity is a health hazard and a known risk factor in the development of following:
Hypertension
Diabetes Mellitus type 2 and metabolic syndrome
ABSTRACT
Background: Obesity and overweight is increasing nowadays among the medical students. Erratic eating habits and other lifestyle related risk factors are mainly implicated for this increasing burden, and research related to these risk factors is essential, considering their role as future physicians and role models in public health intervention programs. The present study was conducted to estimate the BMI values of medical students and to compare obesity among male and female students with their socio-demographic factors, eating habits and lifestyle.
Methods: A cross-sectional study was conducted among medical students in a medical college in Kerala during 1st May 2018 to 30th July 2018. A total of 573 students out of 600 participated in the study. Using a structured questionnaire data was collected. BMI was calculated for 483 medical students with age group of 20 years and above including 173 males and 310 females. SPSS version 17 was used for statistical analysis.
Results: Using WHO BMI classification 18.2% were overweight and 2.1% were obese. Using Asia- Pacific BMI classification 18.2% were overweight and 20.3% were obese. Male students were more obese than females. Skipping breakfast, eating full stomach, not knowing balanced nutrition, eating fatty foods and snacks, eating more under stress and drinking soft drinks were common unhealthy eating habits among obese students.
Conclusions: Obesity and overweight is very prevalent among medical students. Improving their knowledge regarding balanced nutrition, regular eating habits, proper stress management and adoption of healthy lifestyle will result in proper body weight and prevent obesity complications.
Keywords: BMI, Eating habits, Medical students, Kerala
Department of Community Medicine, 1PKDAS Institute of Medical Sciences, Vaniyamkulam, 2Karuna Medical College, Vilayodi, Chittur, Palakkad, Kerala, India
Received: 05 January 2019
Accepted: 06 February 2019
*Correspondence:
Dr. Akshath Kumar,
E-mail: [email protected]
Copyright: © the author(s), publisher and licensee Medip Academy. This is an open-access article distributed under the terms of the Creative Commons Attribution Non-Commercial License, which permits unrestricted non-commercial use, distribution, and reproduction in any medium, provided the original work is properly cited.
Gall bladder disease
Coronary heart disease
Cancers
Varicose veins
Abdominal hernia
Osteoarthritis of knees, hips & spine and gout
Psychological stress and insomnia
Impaired fertility
Obesity and overweight is increasing nowadays among the medical students. Erratic eating habits and other lifestyle related risk factors are mainly implicated for this increasing burden, and research related to these risk factors among medical students is essential, considering their role as future physicians and role models in public health intervention programs. Thus, the following study was undertaken to estimate the BMI values of medical students and to compare obesity among male and female students with their socio-demographic factors, eating habits and lifestyle.
Worldwide obesity has nearly tripled since 1975. In 2016, more than 1.9 billion adults, 18 years and older, were overweight. Of these over 650 million were obese. 39% of adults aged 18 years and above were overweight in 2016, and 13% were obese. Most of the world's population lives in countries where overweight and obesity kills more people than underweight. 41 million children under the age of 5 were overweight or obese in 2016. Over 340 million children and adolescents aged 5-19 were overweight or obese in 2016.5
The prevalence of obesity in India is increasing continuously and recent data shows that between 13% to 50% of the urban population and 8% to 38.2% of the rural population suffers from obesity. Obesity is more commonly seen in women compared to men and is increasing in children and adolescents.6
Obesity is preventable. The fundamental cause of obesity and overweight is an energy imbalance between calories consumed and calories expended. Globally, there has been an increased intake of energy-dense foods that are high in fats and sugars; and an increase in physical inactivity due to the increasingly sedentary nature of many forms of work, changing modes of transportation, and increasing urbanization. Changes in dietary and physical activity patterns are often the result of environmental and societal changes associated with development and lack of supportive policies in sectors such as health, agriculture, transport, urban planning, environment, food processing, distribution, marketing, and education.
The present study was conducted to estimate the BMI values of medical students and to compare obesity among male and female students with their socio-demographic factors, eating habits and lifestyle.
METHODS
It was a cross - sectional study on BMI and eating habits among medical students in a medical college in Kerala conducted during 1st May 2018 to 30th July 2018.
This study was conducted among the medical students of PKDAS Institute of Medical Sciences, Vaniyamkulam, Palakkad. There were total 600 MBBS students in the medical college comprising 4 batches of 150 students each from 2014 to 2017. All the MBBS students from 1st year to 4th year MBBS were included in the study. Those students who were not available during study period and those who were not willing to participate were excluded from the study.
Convenience sampling method was used and included all the students who were available in the medical college and hostels. A total of 573 students out of 600 participated in the study.
Before starting the data collection, permission was obtained from the principal of the medical college. 34 medical students were trained for the data collection. The data collection for the study was done using a structured questionnaire which was prepared by referring all the relevant studies. It consists of questions regarding general information with socio-demographic profile, anthropometric measurements eating habits and lifestyle of the medical students.
Weight of the students was measured using weighing machine and height was measured using wall mounted measuring tape. Body mass index (BMI) was calculated by using the formula,
BMI =
The Statistical Package for Social Sciences (SPSS Inc., Chicago, IL, USA) version 17 was used for data analysis. Results were expressed as percentages and means±standard deviations. All of the analyzed variables were non-parametric and hence Chi-Square test was used to find whether there is any statistically significant difference between obesity and their socio - demographic factors, eating habits and lifestyle. Differences were considered statistically significant at p<0.05.
RESULTS
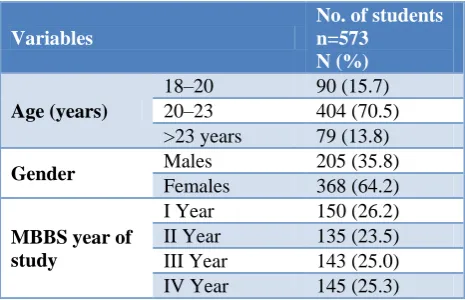
students less than 20 years was excluded from further data analysis (Table 1).
Table 1: Baseline data of the study subjects.
Variables
No. of students n=573
N (%)
Age (years)
18–20 90 (15.7)
20–23 404 (70.5)
>23 years 79 (13.8)
Gender Males 205 (35.8)
Females 368 (64.2)
MBBS year of study
I Year 150 (26.2)
II Year 135 (23.5)
III Year 143 (25.0)
IV Year 145 (25.3)
Table 2: General information of the study subjects.
Variable Total (mean±SD)
Number of students 483
Number of males 173
Number of females 310
Age 21.3±1.1
Weight 59.6±12.1
Height 163.1±9.1
BMI 22.3±3.4
The total number of students included for further analysis were 483 consisting of 173 males and 310 females. The mean age of the students was 21.3±1.1. The mean weight of the students was 59.6±12.1. The mean height of the students was 163.1±9.1. The mean BMI of the students was 22.3±3.4 (Table 2).
Table 3: Prevalence of obesity among students based on WHO-BMI classification.
Weight status Males (%) Females (%) Total (%)
Underweight
(<18.5) 10 (5.8) 44 (14.2) 54 (11.2) Normal
(18.5–24.9) 111 (64.1) 220 (71.0) 331 (68.5) Overweight
(25–29.9) 48 (27.8) 40 (12.9) 88 (18.2) Obese (>30) 4 (2.3) 6 (1.9) 10 (2.1)
Total 173 (100) 310 (100) 483 (100)
According to WHO-BMI classification, 11.2% of the total students were underweight. Female students were found to be having more underweight than males. Overweight and Obese students were 18.2% and 2.1% respectively (Table 3).
According to Asia-Pacific BMI classification 18.2% were Overweight and 20.3% were Obese. Male students were found to be having more overweight and obesity than females (Table 4 and Figure 1).
Table 4: Prevalence of obesity among students based on Asia-Pacific BMI classification.
Weight status Males (%) Females (%) Total (%)
Underweight
(<18.5) 10 (5.8) 44 (14.2) 54 (11.2) Normal
(18.5–22.9) 68 (39.3) 175 (56.4) 243 (50.3) Overweight
(23–24.9) 43 (24.9) 45 (14.5) 88 (18.2) Obese (>25) 52 (30.0) 46 (14.9) 98 (20.3)
Total 173 (100) 310 (100) 483 (100)
Figure 1: Prevalence of overweight and obesity based on Asia-Pacific BMI classification.
Obesity (BMI>25) was found more among the medical students belonging to the age group of 20 to 23 years (85.7%). Obesity was found more commonly among male students (53.1%) compared to females (46.9%). Most of the students above 20 years were from 3rd and 4th year MBBS but the obesity was found more frequently among 1st and 2nd year MBBS students. Obesity was found more commonly among the students belonging to above poverty line (APL) families (94.9%). Obesity was found more commonly among the students having father’s education as graduation (40.8%) and father’s occupation as semi-professionals (48%). Obesity was found more commonly among the students having mother’s education as graduation (47%) and whose mothers were unemployed or home-makers (65.3%) (Table 5).
Majority of the medical students responded that they eat meals always regularly (75.2%) and remaining ate irregularly (24.8%). There was no significant difference in the pattern of meals intake between male and female students. Male students were found to skip eating daily breakfast (70.5%) as compared to females (80%) and it was statistically significant (p=0.032). Most of the students responded that they eat snacks daily apart from regular meals (34.2%); among them females (36.1%) were more than males (30.6%). Most of the students responded that they eat colored vegetables daily or 3-4 times per week (30%) and fruits only 1-2 times per week (39.1%) but there was no significant difference between males and females (Table 6).
18.2%
20.3%
50.3%
11.2%
Table 5: Socio-demographic characteristics of the students and their comparison with obesity.
Variables
Total no. of students n=483
N (%)
Obese students (BMI>25) n=98
N (%)
Age (years) 20–23 404 (83.6) 84 (85.7)
>23 79 (16.4) 14 (14.3)
Gender Males 173 (35.8) 52 (53.1)
Females 310 (64.2) 46 (46.9)
MBBS year of study
I Year 79 (16.3) 20 (20.4)
II Year 116 (24.0) 22 (22.4)
III Year 143 (29.6) 29 (29.6)
IV Year 145 (30.0) 27 (27.6)
Socio-economic status
BPL 17 (3.5) 5 (5.1)
APL 466 (96.5) 93 (94.9)
Father’s education
Illiterate 1 (0.2) 1 (1.0)
Primary school 2 (0.4) 1 (1.0)
Middle school 8 (1.6) 1 (1.0)
High school 75 (15.5) 10 (10.2)
Pre-degree 120 (24.9) 23 (23.5)
Graduation 211 (43.7) 40 (40.8)
Post-graduation 66 (13.7) 22 (22.5)
Father’s occupation
Unemployed 5 (1.0) 0
Unskilled 3 (0.6) 1 (1.0)
Semi-skilled 8 (1.6) 1 (1.0)
Skilled 18 (3.8) 1 (1.0)
Clerk, shop-owner, farmer 163 (33.8) 30 (30.6)
Semi-professional 226 (46.8) 47 (48.0)
Professional 60 (12.4) 18 (18.4)
Mother’s education
Illiterate 3 (0.6) 0
Primary school 0 0
Middle school 3 (0.6) 0
High School 68 (14.1) 9 (9.2)
Pre-degree 120 (24.9) 26 (26.5)
Graduation 223 (46.1) 46 (47.0)
Post-graduation 66 (13.7) 17 (17.3)
Mother’s occupation
Unemployed 293 (60.7) 64 (65.3)
Unskilled 1 (0.2) 0
Semi-skilled 0 0
Skilled 1 (0.2) 0
Clerk, shop-owner, farmer 41 (8.5) 5 (5.1)
Semi-professional 98 (20.3) 15 (15.3)
Professional 49 (10.1) 14 (14.3)
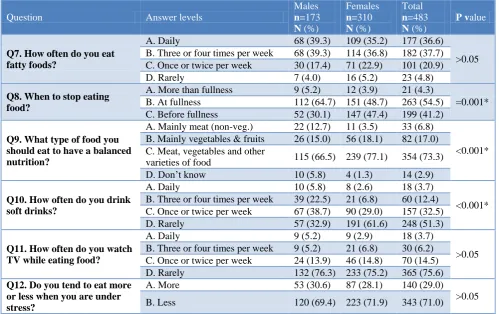
Most of the medical students responded that they eat fatty foods 3-4 times per week (37.7%) and there was no significant difference between males and females. Majority of the students responded that they would stop eating food at fullness of stomach (54.5%). Most of the male students would stop eating food at fullness (64.7%) as compared to females (48.7%); but most of the females would stop eating before fullness (47.4%) as compared to males (30.1%). The difference between males and females was statistically significant (p=0.032). Majority of the students responded that eating meat, vegetables and other varieties of food is a means of balanced
Table 6: Student’s response to questions related to eating habits and gender comparison.
Question Answer levels
Males n=173 N (%)
Females n=310 N (%)
Total n=483 N (%)
P value
Q1. Do you take your meals regularly?
A.Always regular 133 (76.9) 230 (74.2) 363 (75.2)
>0.05
B. Irregular 40 (23.1) 80 (25.8) 120 (24.8)
Q2. Do you take breakfast?
A. Daily 122 (70.5) 248 (80.0) 370 (76.6)
=0.032* B. Three or four times per week 34 (19.7) 49 (15.8) 83 (17.2)
C. Once or twice per week 13 (7.5) 8 (2.6) 21 (4.3)
D. Rarely 4 (2.3) 5 (1.6) 9 (1.9)
Q3. How many times do you eat meals except snacks?
A. One time 24 (13.9) 26 (8.4) 50 (10.4)
>0.05
B. Two times 43 (24.9) 67 (21.6) 110 (22.8)
C. Three times 104 (60.1) 211 (68.1) 315 (65.2)
D. Four times 2 (1.2) 6 (1.9) 8 (1.7)
Q4. How often do you eat snacks apart from regular meals?
A. Daily 53 (30.6) 112 (36.1) 165 (34.2)
>0.05 B. Three or four times per week 51 (29.5) 91 (29.4) 142 (29.4)
C. Once or twice per week 37 (21.4) 62 (20.0) 99 (20.5)
D. Rarely 32 (18.5) 45 (14.5) 77 (15.9)
Q5. How often do you eat green, red or yellow colored vegetables?
A. Daily 50 (28.9) 97 (31.3) 147 (30.4)
>0.05 B. Three or four times per week 52 (30.1) 97 (31.3) 149 (30.8)
C. Once or twice per week 49 (28.3) 71 (22.9) 120 (24.8)
D. Rarely 22 (12.7) 45 (14.5) 67 (13.9)
Q6. How often do you eat fruits?
A. Daily 11 (6.4) 25 (8.1) 36 (7.5)
>0.05 B. Three or four times per week 38 (22.0) 84 (27.1) 122 (25.3)
C. Once or twice per week 70 (40.5) 119 (38.4) 189 (39.1)
D. Rarely 54 (31.2) 82 (26.5) 136 (28.2)
*Significant at 5% level of significance.
Table 7: Student’s response to questions related to eating habits and gender comparison.
Question Answer levels
Males
n=173
N (%)
Females
n=310
N (%)
Total
n=483
N (%)
P value
Q7. How often do you eat fatty foods?
A. Daily 68 (39.3) 109 (35.2) 177 (36.6)
>0.05 B. Three or four times per week 68 (39.3) 114 (36.8) 182 (37.7)
C. Once or twice per week 30 (17.4) 71 (22.9) 101 (20.9)
D. Rarely 7 (4.0) 16 (5.2) 23 (4.8)
Q8. When to stop eating food?
A. More than fullness 9 (5.2) 12 (3.9) 21 (4.3)
=0.001* B. At fullness 112 (64.7) 151 (48.7) 263 (54.5)
C. Before fullness 52 (30.1) 147 (47.4) 199 (41.2)
Q9. What type of food you should eat to have a balanced nutrition?
A. Mainly meat (non-veg.) 22 (12.7) 11 (3.5) 33 (6.8)
<0.001* B. Mainly vegetables & fruits 26 (15.0) 56 (18.1) 82 (17.0)
C. Meat, vegetables and other
varieties of food 115 (66.5) 239 (77.1) 354 (73.3)
D. Don’t know 10 (5.8) 4 (1.3) 14 (2.9)
Q10. How often do you drink soft drinks?
A. Daily 10 (5.8) 8 (2.6) 18 (3.7)
<0.001* B. Three or four times per week 39 (22.5) 21 (6.8) 60 (12.4)
C. Once or twice per week 67 (38.7) 90 (29.0) 157 (32.5)
D. Rarely 57 (32.9) 191 (61.6) 248 (51.3)
Q11. How often do you watch TV while eating food?
A. Daily 9 (5.2) 9 (2.9) 18 (3.7)
>0.05 B. Three or four times per week 9 (5.2) 21 (6.8) 30 (6.2)
C. Once or twice per week 24 (13.9) 46 (14.8) 70 (14.5)
D. Rarely 132 (76.3) 233 (75.2) 365 (75.6)
Q12. Do you tend to eat more or less when you are under stress?
A. More 53 (30.6) 87 (28.1) 140 (29.0)
>0.05
B. Less 120 (69.4) 223 (71.9) 343 (71.0)
Table 8: Student’s response to questions related to their lifestyle and gender comparison.
Question Answer levels
Males n=173 N (%)
Females n=310 N (%)
Total n=483 N (%)
P value
Q13. Mention about your physical activity?
A. No PA 21 (12.1) 109 (35.2) 130 (26.9)
<0.001* B. Moderate PA 79 (45.7) 184 (59.4) 263 (54.5)
C. Vigorous PA 73 (42.2) 17 (5.5) 90 (18.6)
Q14. Please state your smoking history?
A. Current smoker 10 (5.8) 3 (1.0) 13 (2.7)
=0.001*
B. Ex-smoker 5 (2.9) 3 (1.0) 8 (1.7)
C. Never smoke 158 (91.3) 304 (98.1) 462 (95.7)
Q15. Did you ever drink alcohol?
A. Yes, 1-2 times every week 11 (6.4) 4 (1.3) 15 (3.1)
<0.001* B. Rarely or occasionally 28 (16.2) 10 (3.2) 38 (7.9)
C. Never 134 (77.5) 296 (95.5) 430 (89.0)
Q16. Are you suffering from any chronic disease?
A. Yes 11 (6.4) 19 (6.1) 30 (6.2)
> 0.05
B. No 162 (93.6) 291 (93.9) 453 (93.8)
*Significant at 0.1% level of significance
Table 9: Comparison of eating habits among normal and obese students (Part-1).
Questions Answer levels
Normal BMI n=243 N (%)
Obese BMI≥25 n=98 N (%)
P value
Q1. Do you take your meals regularly?
A. Always regular 191 (78.6) 67 (68.4)
=0.046*
B. Irregular 52 (21.4) 31 (31.6)
Q2. Do you take breakfast?
A. Daily 197 (81.1) 71 (72.4)
>0.05 B. Three or four times per week 32 (13.2) 22 (22.4)
C. Once or twice per week 9 (3.7) 2 (2.0)
D. Rarely 5 (2.1) 3 (3.1)
Q3. How many times do you eat meals except snacks?
A. One time 27 (11.1) 12 (12.2)
>0.05
B. Two times 47 (19.3) 21 (21.4)
C. Three times 165 (67.9) 64 (65.3)
D. Four times 4 (1.6) 1 (1.0)
Q4. How often do you eat snacks apart from regular meals?
A. Daily 80 (32.9) 38 (38.8)
>0.05 B. Three or four times per week 74 (30.5) 23 (23.5)
C. Once or twice per week 58 (23.9) 18 (18.4)
D. Rarely 31 (12.8) 19 (19.4)
Q5. How often do you eat green, red or yellow colored Vegetables?
A. Daily 74 (30.5) 35 (35.7)
>0.05 B. Three or four times per week 79 (32.5) 28 (28.6)
C. Once or twice per week 61 (25.1) 22 (22.4)
D. Rarely 29 (11.9) 13 (13.3)
Q6. How often do you eat fruits?
A. Daily 16 (6.6) 10 (10.2)
>0.05 B. Three or four times per week 55 (22.6) 35 (35.7)
C. Once or twice per week 98 (40.3) 31 (31.6)
D. Rarely 74 (30.5) 22 (22.4)
*Significant at 5% level of significance
Majority of the students responded that they do moderate physical activity (54.5%). Most of the males were found to do vigorous physical activity (42.2%) as compared to females (5.5%) and most of the females were not doing any physical activity (35.2%) as compared to males (12.1%). The difference between males and females was found to be statistically significant (p<0.001). Majority of the students responded that they had never smoked cigarettes (95.7%). But about 2.7% were current smokers
students were suffering from chronic diseases like tuberculosis, asthma, diabetes mellitus and hypertension and the difference between males and females was not statistically significant (Table 8).
Obese students (BMI > 25) were found to eat meals more irregularly (31.6%) compared to normal students (21.4%)
and it was statistically significant (p=0.046). The difference in the breakfast, meals, snacks, vegetables and fruits eating pattern between normal and obese students was not statistically significant. However eating snacks daily apart from regular meals was found more frequently among obese students (38.8%) compared to normal students (32.9%) (Table 9).
Table 10: Comparison of eating habits among normal and obese students (Part-2).
Questions Answer levels
Normal BMI n=243 N (%)
Obese BMI≥25 n=98 N (%)
P value
Q7. How often do you eat fatty foods?
A. Daily 87 (35.8) 43 (43.9)
>0.05 B. Three or four times per week 92 (37.9) 33 (33.7)
C. Once or twice per week 52 (21.4) 18 (18.4)
D. Rarely 12 (4.9) 4 (4.1)
Q8. When to stop eating food?
A. More than fullness 6 (2.5) 9 (9.2)
=0.006*
B. At fullness 125 (51.4) 56 (57.1)
C. Before fullness 112 (46.1) 33 (33.7)
Q9. What type of food you should eat to have a balanced nutrition?
A. Mainly meat (Non-veg.) 12 (4.9) 8 (8.2)
>0.05 B. Mainly vegetables & fruits 36 (14.8) 20 (20.4)
C. Meat, vegetables and other varieties
of food 191 (78.6) 67 (68.4)
D. Don’t know 4 (1.6) 3 (3.1)
Q10. How often do you drink soft drinks?
A. Daily 7 (2.9) 7 (7.1)
>0.05 B. Three or four times per week 26 (10.7) 14 (14.3)
C. Once or twice per week 78 (32.1) 32 (32.7)
D. Rarely 132 (54.3) 45 (45.9)
Q11. How often do you watch TV while eating food?
A. Daily 6 (2.5) 6 (6.1)
>0.05 B. Three or four times per week 14 (5.8) 6 (6.1)
C. Once or twice per week 28 (11.5) 17 (17.3)
D. Rarely 194 (79.8) 69 (70.4)
Q12. Do you tend to eat more or less when you are under stress?
A. More 54 (22.2) 41 (41.8)
<0.001*
B. Less 189 (77.8) 57 (58.2)
*Significant at 0.1% level of significance
Table 11: Comparison of lifestyle habits among normal and obese students.
Questions Answer levels
Normal BMI n=243 N(%)
Obese BMI>=25 n=98 N(%)
P value
Q13. Mention about your Physical Activity?
A. No PA 71 (29.2) 26 (26.5)
>0.05
B. Moderate PA 129 (53.1) 56 (57.1)
C. Vigorous PA 43 (17.7) 16 (16.3)
Q14. Please state your smoking history?
A. Current smoker 2 (0.8) 4 (4.1)
>0.05
B. Ex-smoker 1 (0.4) 2 (2.0)
C. Never smoke 240 (98.8) 92 (93.9)
Q15. Did you ever drink alcohol?
A. Yes, 1-2 times every week 5 (2.0) 6 (6.1)
>0.05
B. Rarely or occasionally 15 (6.2) 8 (8.2)
C. Never 223 (91.8) 84 (85.7)
Q16. Are you suffering from any chronic disease?
A. Yes 10 (4.1) 7 (7.1)
>0.05
Eating fatty foods daily was found more frequently among obese students (43.9%) compared to normal students (35.8%) but it was not statistically significant. Most of the obese students responded that they would stop eating food at fullness of stomach (57.1%) compared to normal students (51.4%). Most of the normal students responded as to stop eating before fullness of stomach (46.1%) compared to obese students (33.7%) and the difference was statistically significant (p=0.006). The difference in the knowledge about balanced nutrition, drinking soft drinks and watching TV while eating food; between normal and obese students was not statistically significant. Most of the obese students were found to eat more under stress (41.8%) compared to normal students (22.2%) and it was statistically significant (p<0.001) (Table 10).
The difference in the physical activity pattern, cigarette smoking, alcohol drinking and history of chronic diseases between normal and obese students was not statistically significant (Table 11).
DISCUSSION
The total number of study subjects considered for the present study analysis was 483 out of 600 medical students consisting of 173 males and 310 females. This is similar to other studies done in India and various other countries mainly among students, where the sample size ranges from 300 to 600. 7,10,11,15,16 While some studies had a larger sample size(>1000); few other studies had a smaller sample size than present study(<200).8,9,12-14,17,18 Female students were more in number compared to males, which is similar to most other studies.10-18 But some studies had more male students than females.7-9 While another study conducted in Saudi Arabia had only male students as study subjects.16 In the present study, subjects who were 20 years and above only were considered for the BMI classification. The mean age of the students was 21.3±1.1. But most of the studies mentioned above have included subjects who were less than 20 years also for the adult BMI classification.
In the present study according to WHO - BMI classification, 68.5% of the students were of normal BMI status and females (71%) were more compared to males (64.1%). 11.2% of the total students were Underweight and it was more among females (14.2%) than males (5.8%). Similar findings were reported by other studies in Kanchipuram, India, Romania and Serbia.7,14,17 Also, higher prevalence estimates have been reported in the Mangalore, India,9 while few other studies in Alexandria, Egypt, Benha, Egypt, Cameroon, USA and Saudi Arabia have reported lower estimates.10-12,15,16 Overweight and Obese students were 18.2% and 2.1% respectively. Male students were found to be having more overweight (27.8%) and obesity (2.3%) compared to female students with overweight (12.9%) and obesity (1.9%) respectively. Similar findings were reported by other studies in Medinipur, India, Cameroon, Romania and Serbia.8,11,13,16
But, contrary to our study findings, higher prevalence estimates have been reported in the India, Egypt, USA, and Saudi Arabia.7,9-11,15,16 These differences could be as a result of socio-cultural disparities, which may affect the lifestyle, food habits and health behavior of the students, differences in sampling techniques, sample sizes of studies and to some extent on how the data were collected.
But according to Asia-Pacific BMI classification, 50.3% of the students were of normal BMI status and it was more among females (56.4%) than males (39.3%). 11.2% of the total students were underweight, 18.2% of the students were overweight and 20.3% were obese students were and respectively. Male students were found to be having more overweight (24.9%) and obesity (30%) compared to female students with overweight (14.5%) and obesity (14.9%). This shows that the Asia-Pacific BMI classification has increased the prevalence of overweight and obesity among study subjects compared to WHO-BMI classification. The present study has found higher number of underweight and obese students compared to a similar study conducted by Haque et al among medical students and pharmacy students of UNIKL-RCMP, Malaysia, during November 2014 where more than half of the respondents (61%) had a normal BMI, 5% were underweight, 26% were overweight and 8% were obese.13
In the present study obesity was found more commonly among male students compared to females. This is similar to most of the studies, except for the studies in Benha, Egypt and Cameroon where even though males were more obese; females were found to be more overweight than males.7,8,10-12,14,15,17,18 The lower rate of obesity among female students is expected since females are more cautious about their weight status than males, due to society perceptions which encourage females to be slender. This assumption was supported by the fact that only 5.8% of males were underweight as compared to 14.2% of females in this studied sample. This finding is similar to study done among Lebanese university students.18
In the present study obesity was found more commonly among students belonging to 1st and 2nd year MBBS, students from APL families, students whose father’s and mother’s education was pre-degree and graduation, students whose father’s occupation was clerks, shop-owners, farmers and semi-professionals and students whose mothers were unemployed/home-makers. These findings were not seen in the above mentioned studies.
more than males. Similar to our study, some studies have reported that eating snacks apart from meals was more commonly found among females than males.12,18 In our study there was no significant difference between males and females regarding eating vegetables, fruits and fatty foods.
In the present study most of the male students responded that they would stop eating food at fullness as compared to females; but most of the females would stop eating before fullness as compared to males. The difference between males and females was statistically significant (p=0.032). Most of the females were found to be knowledgeable about balanced nutrition as compared to males and it was statistically significant (p<0.001). Most of the males were found to drink soft-drinks 3-4 times per week as compared to females and it was statistically significant (p<0.001); which is similar to a study done among University students of Guam, USA.15 This is in contrast to the study done in Cameroon where females were found to drink more sugar sweetened beverages than males.12
In the present study most of the male students were reportedly doing vigorous physical activity and most of the females were not doing any physical activity and the difference between males and females was found to be statistically significant (p<0.001). Male students were more in the number of current smokers than female and the difference was statistically significant (p=0.001). Male students were more in the number of rare drinkers than females and the difference was statistically significant (p<0.001). In contrast to our study, a study done in Malaysia found that more male students (70%) maintained healthy lifestyles than females (53%) and it was statistically significant (p=0.022).13
In the present study obese students (BMI > 25) were found to eat meals more irregularly compared to normal students and it was statistically significant (p=0.046). There was no significant difference in the vegetables and fruits eating pattern between normal and obese students. Eating fatty foods and snacks daily apart from regular meals daily was found more frequently among obese students compared to normal students but it was not statistically significant. These findings are similar to some studies where eating meals irregularly, eating snacks (in-between meals) more frequently and eating fatty foods was significantly associated to overweight/ obesity.10,12,16
In the present study most of the obese students responded that they would stop eating food at fullness of stomach (57.1%) compared to normal students (51.4%). Most of the normal students responded that they would stop eating before fullness of stomach (46.1%) compared to obese students (33.7%) and the difference was statistically significant (p=0.006). This is in contrast to the study done in Cameroon found that when to stop eating, was not significantly associated to
overweight/obesity. The difference in the knowledge about balanced nutrition, drinking soft drinks and watching TV while eating food; between normal and obese students was not statistically significant and is similar to the Cameroon study.12
In the present study most of the obese students were found to eat more under stress (41.8%) compared to normal students (22.2%) and it was statistically significant (p<0.001). This is similar to a study conducted in Medinipur, India, where in case of males, positive correlation between BMI and PSSI was observed which was statistically significant (r is equal to 0.362, p<0.01) but in case of females, the correlation was not found to be significant.8 Another study from Malaysia has also reported that medical students tend to eat more under stress.13
In the present study alcohol intake and smoking were not common in our sample of students and it was not significantly associated with overweight and obesity. But smoking and alcohol was more common among male students than females. This finding is similar to the Lebanon study.18 There was no significant difference in the physical activity pattern and history of chronic diseases between normal and obese students in our study. In contrast to this, only the habit of exercise had a significant influence on body weight of the subjects in a study done in Medinipur, India. Researchers have reported that addition of exercise to dietary restriction can promote greater reduction in weight than change in diet alone.8
Limitations
In the present study, all the participants were belonging to only one medical college of Southern part of India. Hence the results of the study cannot be generalized to all the medical students throughout the country. A multi-centric study involving many medical colleges can be undertaken to understand the relationship between BMI and eating habits, especially among the medical students. History of obesity among parents was not taken into consideration in this study to rule out the genetic factors linked to obesity.
CONCLUSION
differences. Smoking and alcohol was more common among male students than females.
Obese students were found to eat meals irregularly, eating fatty foods and snacks daily apart from regular meals, eating after fullness of stomach and eating more under stress significantly more among than normal weighing students. There was no significant difference in the physical activity pattern, cigarette smoking, alcohol drinking and history of chronic diseases between normal and obese students.
Improving medical students' knowledge to take balanced nutrition; to eat breakfast and meals regularly; to avoid frequent snacks and fatty food consumption; to stop eating before fullness; to avoid smoking, soft drinks and alcohol consumption; to control stress and to do regular physical exercise may promote healthy body weight management among students and reduce the prevalence of overweight and obesity among future medical professionals.
ACKNOWLEDGEMENTS
The authors gratefully acknowledge the study participants for their co-operation during the study. We acknowledge the support provided by the Principal and Management of PKDAS Institute of Medical Sciences for conducting this study.
Funding: No funding sources Conflict of interest: None declared
Ethical approval: The study was approved by the Institutional Ethics Committeeof PKDIMS
REFERENCES
1. World Health Organization. Physical status. The use and interpretation of anthropometry. Report of a WHO expert consultation. Technical Report Series Number 854. Geneva. World Health Organization; 1995.
2. World Health Organization. Obesity. Preventing and managing the global epidemic. Report on a WHO consultation on Obesity. Technical Report Series Number 894. Geneva. World Health Organization; 2000.
3. Misra A, Chowbey P, Makkar BM, Vikram NK, Wasir JS, Chadha D, et al. Consensus Statement for Diagnosis of Obesity, Abdominal Obesity and the Metabolic Syndrome for Asian Indians and Recommendations for Physical Activity, Medical and Surgical Management. J Assoc Physicians India. 2009;57:163-70.
4. Lim JU, Lee JH, Kim JS, Hwang YI, Kim TH, Lim SY, et al. Comparison of World Health Organization and Asia-Pacific body mass index classifications in COPD patients. Int J Chron Obstruct Pulmon Dis. 2017;12:2465-75.
5. World Health Organization. Obesity and Overweight. Available at http://www.who.int/news-room/fact-sheets/detail/obesity-and-overweight. Accessed on 18 May 2018.
6. Misra A, Shrivastava U. Obesity and dyslipidemia in South Asians. Nutrients. 2013;5(7):2708-33. 7. Selvaraj K, Sivaprakasam P. A Study on the
Prevalence of Overweight and Obesity among Medical Students of Kanchipuram District. National J Res Community Med. 2013;2(2):79-148.
8. Gupta S, Ray TG, Saha I. Overweight, Obesity and Influence of Stress on Body Weight Among Undergraduate Medical Students. Indian J Community Med. 2009;34(3):255-7.
9. Benazeera, Umarani J. Association Between Eating Habits and Body Mass Index (BMI) of Adolescents. Int J Med Sci Public Health. 2014;3:940-3.
10. Genena DM, Salama AA. Obesity and Eating Habits among University Students in Alexandria, Egypt: A Cross Sectional Study. World J Nutr Health. 2017;5(3):62-8.
11. Mahmoud MH, Taha AS. The Association between Eating Habits and Body Mass Index among Nursing Students. IOSR Journal of Nursing a nd Health Science (IOSR-JNHS). 2017;6(3):14-26.
12. Niba LL, Atanga MB, Navti LK. A cross sectional analysis of eating habits and weight status of university students in urban Cameroon. BMC Nutr. 2017;55(3):1-8.
13. Haque ATME, Manimaran N, Ramanitaram S, Nedunchelian T, Seeva T, Haque M. A Cross-Sectional Study on Eating Habits and Health Attitudes among the Medical and Pharmacy Students of UNIKL-RCMP, Malaysia. Int J Pharm Sci Rev Res. 2015;32(1):238-45.
14. Rada C. Body mass index and eating habits in young adults from Romania. Int J Med Res Health Sci. 2016;5(5):42-50.
15. James G, Miller MJ. Impact of Food Intake Habits on Weight among University of Guam Students. J Educ Human Develop. 2016;5(2):32-39.
16. Al-Rethaiaa AS, Fahmy AA, Al-Shwaiyat NM. Obesity and eating habits among college students in Saudi Arabia: a cross sectional study. Nutr J. 2010;9:39.
17. Gazibara T, Tepavcevic DBK, Popovic A, Pekmezovic T. Eating Habits and Body-weights of Students of the University of Belgrade, Serbia: A Cross-sectional Study. J Health Popul Nutr. 2013;31(3):330-3.
18. Yahia N, Achkar A, Abdallah A, Rizk S. Eating habits and obesity among Lebanese university students. Nutr J. 2008;7(32):1-6.