Original Research Article
An evaluation of the in-patient feedback services in a tertiary care
hospital of Northern India
Shweta Samant*, Ravinder Singh Saini
INTRODUCTION
Patient satisfaction is an important yardstick to measure quality of the healthcare services.1 It helps in identifying the gaps and resolving the problems from the patient’s point of view.2,3 Patient satisfaction is affected by various factors like hospital personnel (doctors, nurses), and environment.4,5
Patient satisfaction is the extent to which a patient is satisfied with the services offered by a health care
provider. It is about meeting the patient’s expectations. It is highly subjective and depends on individual expectations and perceptions. Two people receiving the same care can have different levels of satisfaction due to the difference in their expectations from the service. Satisfaction is not overtly observable. It encompasses all aspects of health services including distribution, access and utilization.6
Patient satisfaction depends not only on the clinical aspects but on non-clinical aspects as well. Evaluation of
ABSTRACT
Background: Patient satisfaction is an important indicator of the quality of services provided by any healthcare organization and directly or indirectly affects patient retention, legal issues, revenues, reputation and success of a healthcare organization. Patient’s feedback about the clinical as well as non-clinical services can be recorded for gap analysis and improvement of services.
Methods: The cross-sectional study was carried out in a large tertiary care hospital in North India from May 2012 to
December 2012. A pre-tested internally developed questionnaire was used to collect the data.
Results: It was observed that the average satisfaction score was relatively high for the criteria like doctor’s counselling, attitude of nurse and availability and behaviour of attendant. The average scores for medical and nursing care (clinical services) provided in wards were high (70-74% satisfaction). However, approximately 45% and 50% patients were dissatisfied with the housekeeping and dietary services respectively. This resulted in a dip in the overall impression of the hospital services to 68%.
Conclusions: The percentage of patients satisfied with the overall services (clinical and non-clinical) of the hospital is
only 68% which goes on to prove that the patients’ perception of quality is changing with the times and non-clinical areas like housekeeping, dietary, billing, security services are becoming as important as clinical care services that are provided by hospitals.
Keywords: Patient satisfaction, In-patient, Tertiary, Feedback form, Patient feedback
Department of of Hospital Administration, Swami Rama Himalayan University, Jollygrant, Dehradun, Uttarakhand, India
Received: 28 January 2019
Revised: 12 February 2019
Accepted: 13 February 2019
*Correspondence:
Dr. Shweta Samant,
E-mail: [email protected]
Copyright: © the author(s), publisher and licensee Medip Academy. This is an open-access article distributed under
the terms of the Creative Commons Attribution Non-Commercial License, which permits unrestricted non-commercial use, distribution, and reproduction in any medium, provided the original work is properly cited.
patient satisfaction can be done qualitatively or quantitatively, with quantitative approach being more accurate. Healthcare organizations therefore use patient satisfaction surveys to interpret subjective feedback of patients into quantifiable and meaningful information. Patient satisfaction surveys may be developed in-house or by third party providers.
Standardized questionnaires are a common assessment tool employed for patient satisfaction studies.7,8 They can be administered through e-mail, interviews (face to face or telephonic) or physical feedback forms filled in the hospital. Analysis of the feedback obtained helps to identify gaps and develop initiatives for quality improvement.
In hospitals, patient feedback can be obtained for the in-patient department (IPD) services or for the outin-patient department (OPD) services or individually for various other departments. In-patients are a valuable source of information regarding the quality of services provided by the hospital, as they use most of the services during their stay at the hospital.
A survey of 32 large tertiary hospitals in the USA in 2011 showed that physician care, nursing care, and physical environment significantly affected patient satisfaction and nursing care was found to be the most critical among these. Respect and courtesy by hospital staff also greatly impacted satisfaction of patients followed by effective communication and explanation.9 In contrast another survey conducted in Ireland hospitals scored proper communication and explanation as the most important attribute in patient satisfaction compared to other attributes of patient care.10
In a study conducted at a military teaching hospital in Turkey, findings indicated that physician care, nursing, hospital environment, food services, type of clinic were the main determinants of overall patient satisfaction.11
Outcomes of four studies conducted in tertiary hospitals of different countries revealed that certain aspects of nursing care like courtesy, listening, respect; access of care greatly impacted patient satisfaction compared to physician care, hospital environment, admission processes or cleanliness.12,13-15
While a few other studies found interpersonal skills of physician, their attitude and involving patients in decision making affected patient satisfaction more than clinical competence or other hospital tangibles.16-18 However, in another study conducted in a public hospital of France, hospital amenities and living arrangements were found to significantly affect satisfaction than other factors.
The aim of the study was to assess the level of satisfaction of the admitted patients, regarding the services of the hospital with the following objectives; (1) to find out the patient’s opinion about the clinical as well
as non-clinical services (2) to record the suggestions and remarks of the patients regarding infrastructure/process/ behavior aspects for future gap analysis.
METHODS
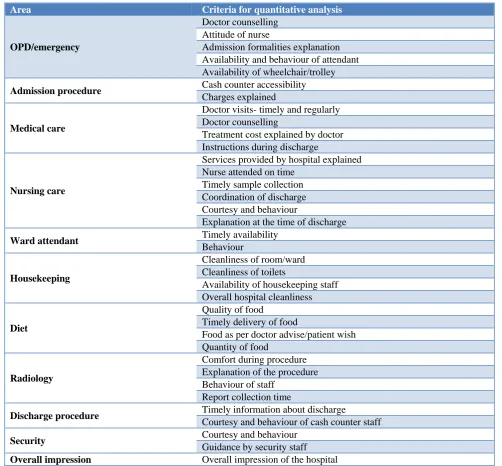
This cross-sectional study (mixed method) was carried out in a large tertiary care hospital in Uttarakhand, for a period of 8 months from May 2012 to December 2012. Participation of the study population was voluntary. A pre-tested questionnaire (instrument) was used to collect the data. The questionnaire consisted of 11 areas /categories/aspects for which data was collected. Each category had a set of attributes/criteria, totaling to 36 attributes/criteria studied for these 11 areas (Table 1). The responses to these attributes were numerically rated on a scale from 1 to 4 by the patient, 4 being excellent and 1 being poor.
Provision to capture additional feedback (qualitative information) through open ended questions was also provided in the IPD Feedback form for gathering general feedback/comments/suggestions of patients (Table 2). Turn-around time for various areas like admission, treatment, procedure, report collection, billing and discharge could also be recorded on the feedback form.
The study population consisted of patients admitted in the different wards of the hospital who volunteered to provide feedback. The feedback forms were provided to the patient/patient’s attendant on the day of their discharge, and were to be submitted to the respective ward clerks upon completion. The forms were filled as per the patient’s own understanding and interpretation of the questions (self-reported). Frequency analysis was done using Microsoft Excel 2010.
Analysis and interpretation of the data:
The average for each attribute was calculated by adding all the ratings given by different patients to that attribute and dividing this sum by the number of ratings. Averages for all the 36 attributes was calculated in the same manner each month for each ward.
Monthly average for each attribute of a ward (AvM)=sum of ratings given to the attribute/total number of ratings obtained.
To calculate the average rating for each attribute during a particular month for all the wards, all the averages obtained earlier for each ward were summed up and divided by the number of wards.
For the quantitative information, any score below 3.5 was noted as an area for improvement.
Qualitative information (like statement/ complaint/ suggestion) was noted and categorized under different
heads like structural, processes, behavioural, and services improvements.
The areas with higher than average turn-around times were put for further root cause analysis.
Table 1: Criteria for quantitative analysis.
Area Criteria for quantitative analysis
OPD/emergency
Doctor counselling Attitude of nurse
Admission formalities explanation Availability and behaviour of attendant Availability of wheelchair/trolley
Admission procedure Cash counter accessibility
Charges explained
Medical care
Doctor visits- timely and regularly Doctor counselling
Treatment cost explained by doctor Instructions during discharge
Nursing care
Services provided by hospital explained Nurse attended on time
Timely sample collection Coordination of discharge Courtesy and behaviour
Explanation at the time of discharge
Ward attendant Timely availability
Behaviour
Housekeeping
Cleanliness of room/ward Cleanliness of toilets
Availability of housekeeping staff Overall hospital cleanliness
Diet
Quality of food
Timely delivery of food
Food as per doctor advise/patient wish Quantity of food
Radiology
Comfort during procedure Explanation of the procedure Behaviour of staff
Report collection time
Discharge procedure Timely information about discharge
Courtesy and behaviour of cash counter staff
Security Courtesy and behaviour
Guidance by security staff
Overall impression Overall impression of the hospital
RESULTS
It was observed (Figure 1) that average satisfaction score was relatively high for criteria like doctor’s counseling, attitude of nurse, availability and behavior of attendant. The overall satisfaction score varies between 3.3-3.6 regarding explanation of charges and admission formalities. For the criteria related to medical care and Nursing care (Figure 2) provided in the wards, average scores were higher than 3.5, highest average being 3.8 for certain nursing criteria. Explanation of treatment cost by
the doctor had lower average scores compared to other medical and nursing averages. Housekeeping, dietary/canteen services criteria (Figure 3) averages did not show much variation and were mostly low (less than 3.5 for most criteria) with average 3 being the lowest for quality of food. Criteria for ward attendants had average scores between 3.5 and 3.7.
information about discharge and overall impression of the hospital scored averages 3.5 or over for most criteria.
The satisfaction level trend lines for most of the variables show a slight decline or are flat between May and June 2012, except for the average for the criteria of ward attendants (Figure 4).
Ultimately all the areas show a positive rise of satisfaction score towards the end period of the study from November to December 2012. During the study period, the lowest averages of 3.17 were given to the dietary/canteen services and the highest averages of 3.75 were scored by nursing care services. Average scores of all other services fell in between these two ranges.
Figure 1: Pre admission ratings for OPD/emergency and admission procedure.
Figure 2: Ratings at the ward level for medical care and nursing care.
Figure 3: Ratings at the ward level for ward attendants, housekeeping and dietary services.
3.2 3.3 3.4 3.5 3.6 3.7 3.8 Doctor Counselling
Attitude of the Nurse Admission formalities explained Availability & Courtesy of Attendant Availability of wheel chair/ trolley Cash Counter Accessibility Charges explained well
OPD/ Emergency Admission procedure
MAY'12 JUNE'12 JULY'12 AUG'12 SEP'12 OCT'12 NOV'12 DEC'12 3.3 3.4 3.5 3.6 3.7 3.8 3.9 Do cto r Visit in tim e & regul arity Do cto r Coun se llin g Tr eatm en t cos t ex p lain ed b y D o ct o r Ins tr u cti o n s d u rin g Disch ar g e Ser v ices Pr o v id ed by Ho sp ital exp lain ed Nu rses atten d ed o n tim e Ti m el y Sam p le co llecti o n Co o rd in atio n of Disch ar g e Co u rtesy & Beh av io u r Disch ar g e Exp lan atio n
Medical Care Nursing care
MAY'12 JUNE'12 JULY'12 AUG'12 SEP'12 OCT'12 NOV'12 DEC'12 2.9 3 3.1 3.2 3.3 3.4 3.5 3.6 3.7 3.8 Timely Availability Behaviour Cleanliness of rooms Claenliness of toilets Availability of HK Staff
Overall Cleanliness Quality of food Timely delivery of food
Food as per Doctor/ Patient wish
Quantity of food
Ward Attendant House Keeping Diet
Figure 4: Ratings for radiology services, discharge procedure, security services and overall impression of hospital.
Figure 5: Monthly trend for services/areas.
The response given by patients in the form of complaints/suggestions/feedback to the open-ended questions in the patient feedback form was recorded
separately and the 238 statements were categorized under various areas of improvement viz. structure, process, behavior, services.
Table 2: Summary of patients’ comments and suggestions (qualitative analysis).
Patient’s comments/suggestions Frequency (total= 238
statements) Structure improvement (provision of utilities-toilets, couch for patient attendants,
warming/storing home brought food, treatment charges ) 83
Process improvement (discharge process, visiting hours, doctors’ rounds, billing) 51
Behaviour improvement (area specific comments on behaviour of employees) 26
Services improvement (housekeeping, dietary/ canteen, security, ambulance) 78
3.1 3.2 3.3 3.4 3.5 3.6 3.7 3.8 Co m fo rtab ility d u rin g p ro ce d u re Exp lan atio n o f th e pro cedu re Beh av io u r Rep o rt collec tio n tim e e x p lain ed Ti m el y in fo rm atio n ab o u t Disch arge Co u rtesy & Beh av io u r of Cas h Coun ter Co u rtesy & Beh av io u r Gu id an ce by Sec u rity Staf f Ov er all I m p re ss io n
Radiology Discharge procedure Security Overall
MAY'12 JUNE'12 JULY'12 AUG'12 SEP'12 OCT'12 NOV'12 DEC'12 3.6
3.54 3.56 3.54 3.56 3.54
3.52
3.6
3.4 3.4
3.5 3.5 3.5
3.55
3.4
3.6 3.6 3.6
3.67
3.57 3.6 3.57
3.52
3.65 3.75
3.68
3.73
3.68 3.66 3.66
3.6
3.75
3.55
3.6 3.6
3.55 3.6 3.65 3.6 3.65 3.5 3.37 3.45
3.37 3.4 3.4
3.35
3.5
3.2
3.17
3.3 3.3
3.22 3.3 3.17 3.27 3.5 3.37 3.47 3.4
3.47 3.5
3.4 3.47 3.55 3.5 3.55 3.45 3.6 3.55 3.45 3.65
3.35 3.35
3.45 3.45
3.5 3.5
3.4
3.55 3.6
3.5
3.6 3.6 3.6
3.5 3.6 3.7 3.1 3.2 3.3 3.4 3.5 3.6 3.7 3.8
May June July Aug Sep Oct Nov Dec
Table 3: Number and percentage of satisfied/ dissatisfied patients.
Area Criteria for quantitative analysis Total responses
Dissatisfied N (%)
Satisfied N (%)
At OPD/ emergency
Doctor counselling 2172 755 (34.76) 1417 (65.24) Attitude of nurse 2175 657 (31.02) 1518 (68.98) Admission formalities explanation 2118 828 (39.09) 1290 (60.91) Availability and behaviour of attendant 2160 716 (33.15) 1444 (66.85) Availability of wheelchair/trolley 2090 604 (28.9) 1486 (71.1)
Admission Procedure
Cash counter accessibility 1905 733 (38.48) 1172 (61.52) Charges explained 1920 737 (38.39) 1183 (61.61)
Medical care in ward (after admission)
Doctor visits- timely and regularly 2181 624 (28.6) 1557 (71.4) Doctor counselling 2137 630 (29.5) 1507 (70.5) Treatment cost explained by doctor 2111 640 (30) 1471 (70) Instructions during discharge 2106 585 (27.8) 1521 (72.2)
Nursing care in ward (after admission)
Services provided by hospital explained 1979 504 (25.5) 1475 (74.5) Nurse attended on time 2170 452 (20.8) 1718 (79.2) Timely sample collection 2152 558 (25.9) 1594 (74.1) Coordination of discharge 2160 481 (22.3) 1679 (77.7) Courtesy and behaviour 2181 465 (21.3) 1716 (78.7) Explanation at the time of discharge 2140 519 (24.3) 1621 (75.7)
Ward attendants
Timely availability 2133 721 (33.8) 1412 (66.2) Behaviour 2151 594 (27.6) 1557 (72.4)
Housekeeping services
Cleanliness of room/ward 2118 902 (42.6) 1216 (57.4) Cleanliness of toilets 2114 990 (46.8) 1124 (53.2) Availability of housekeeping staff 2059 856 (41.6) 1203 (58.4) Overall hospital cleanliness 2043 882 (43.2) 1161 (56.8)
Dietary/canteen services
Quality of food 2020 1105 (54.7) 915 (45.3) Timely delivery of food 2012 934 (46.4) 1078 (53.6) Food as per doctor advise/patient wish 1996 922 (46.2) 1074 (53.8) Quantity of food 1989 862 (43.3) 1127 (56.7)
Radiology services
Comfort during procedure 1815 749 (41.3) 1066 (58.7) Explanation of the procedure 1835 719 (31.2) 1116 (68.8) Behaviour of staff 1819 816 (44.9) 1003 (55.1) Report collection time 1903 696 (36.6) 1207 (63.4)
Discharge procedure
Timely information about discharge 1929 614 (31.8) 1315 (68.2) Courtesy and behaviour of cash counter staff 2011 803 (39.9) 1208 (60.1)
Security Courtesy and behaviour of security staff 2024 885 (43.7) 1139 (56.3)
Guidance given by the security staff 2023 788 (39) 1235 (61)
Overall
impression 1878 606 (32.3) 1272 (67.7)
DISCUSSION
For each criterion, an average scoring of 3.5 or below was considered as low which required further analysis for improvement initiatives.
At the OPD/emergency which is the first contact points of the patients to the hospital, average scores were relatively high for criteria like doctor’s counseling, attitude of nurse and availability and behavior of attendant, availability of trolley/wheelchair, greater than 3.5, reaching 3.7 for nurse’s attitude. The satisfaction score varies between 3.3-3.6 regarding explanation of charges and admission formalities. 65.24% patients were
In the ward, for criteria related to medical care and nursing care, average scores were higher than 3.5, highest average being 3.8 for certain nursing criteria. Timely visits and counseling provided by the doctors were rated good (average score from 3.5 to 3.7) by 70.5% patients although for a few cases (30%) further treatment cost was not explained by the doctor (average score of 3.4). 72.2% patients felt that doctors gave proper instructions during discharge (average score from 3.5 to 3.7). As regards nursing care, 74.4% of the patients scored all six criteria between good to excellent (average scoring 3.5 and above) (Table 3). This is in contrast to a study conducted by Baruah M et alin which only 40% of the patients were satisfied with the nursing care.19 66.2% and 72.4% admitted patients respectively found availability and behavior of ward attendants to be satisfactory.
41.3% patients felt they were not made comfortable during the Radiology/Imaging procedure. 44.9% rated the behavior of the radiology staff at an average score of 3.37. Also 36.6% patients reported a delay in getting reports (also corroborated from the turn-around time for report collection noted by patient on the feedback form). Further analysis of the turn-around time needs to be carried out to identify possible bottlenecks causing delays.
Since many patients visiting the hospital belong to middle to low income groups, diagnostic and treatment cost are important criteria in their expectation of affordable/cheap services and ultimately affects satisfaction levels.
Housekeeping, dietary/canteen services criteria averages did not show much variation and were mostly low (less than 3.5 for most criteria) with average 3 being the lowest for quality of food. Criteria for ward attendants had average scores between 3.5 and 3.7.
41.6% to 46.8% patients rated cleanliness of rooms and toilets, timely availability of housekeeping staff and overall hospital cleanliness poorly (average scores being less than 3.5 for most criteria for housekeeping services) which is higher than the 35.5% of the respondents dissatisfied by the toilet facilities in a study by Qadri SS et al, but significantly lower than that of another study by Aleena et al with 80% level of dissatisfaction.20,21
Between 43% to 55% patients were unhappy with the dietary services and low scores (less than average 3.5) were given to all four criteria under diet (quality of food, quantity of food, timely delivery of food, diet as per doctor’s advice wherever applicable).This is in line with a study conducted at a tertiary care hospital in Nagpur, India where 51.93% admitted patients were unsatisfied with quality of food, but is in contrast to other studies by Qadri et al and Aleena et al, with low dissatisfaction rates of 18.25and 18% respectively.20-22
68.2% patients said they were mostly informed timely by the treating doctor/nurse about their discharge, but the
discharge process was long and tedious (turn-around time for discharge process noted by patient on the feedback form). Courtesy and behavior of cash counter staff were mostly found satisfactory (average score 3.5) by 60% of patients.
Courtesy and behavior of security staff towards patients/patient’s attendants was scored poorly (average score 3.41) by 43.7% patients while 61% were satisfied with the way finding guidance provided by the security staff. Due to the large number of people (relatives/friends) coming along with the patients, there is a huge load on the security to prevent overcrowding in the wards. This often times results in friction between patients/their attendants and hospital security staff.
The overall impression of the hospital was rated as satisfactory (average score of 3.58) by 68% of the patients which is in consonance to the 64% and 63% reported in studies by Baruah et al and by Mahapatra et al respectively.19,23 But is significantly lower than those reported by Deva et al in Kashmir at 80%, Kumari et al from Lucknow at 81.6%.6,24 Though the average scores for medical and nursing care were high (70-74% satisfaction), but the overall percentage of patients satisfied is only 68% which goes on to prove that the patients’ perception of quality is changing with the times. They now see quality of hospital services not just in terms of clinical outcomes but other non-clinical factors as well like housekeeping, security, diet, facilities provided, courtesy and behavior of staff, ease of admission/discharge process, which greatly affects their satisfaction levels.
CONCLUSION
Similar findings may be observed in other similar sized large private hospitals receiving a mix of demographic characteristics. The overall analysis of the quantitative and qualitative data from the patient feedback shows that more than 70% of in-patients are satisfied with the medical care and greater than 74% with the nursing care provided at the hospital. The radiology and Imaging services show a scope for further improvement. Certain non-clinical services like housekeeping, security, dietary services and the discharge procedure scored poorly and need to be analyzed for identifying the causes and taking corrective action.
Recommendations
Soft skills training of all non-clinical professionals- front office employees (reception, registration, billing and cash counters), security, ward attendants and housekeeping staff.
The discharge process needs to be studied to find the causes for delays.
Infrastructure related issues to be identified and resolved as per priority.
Ensuring adherence to cleaning protocols, following checklists for wards/rooms/toilets and continuous monitoring by housekeeping supervisors and managers.
Root cause analysis for issues related to dietary services to be undertaken.
ACKNOWLEDGEMENTS
We would like to thank Sumedha Attri for helping in this study.
Funding: No funding sources Conflict of interest: None declared
Ethical approval: The study was approved by the Institutional Ethics Committee
REFERENCES
1. Sreenivas T, Prasad G. Patient satisfaction –A comparative study. J Academy Hospital Administration. 2003;15(2):7-12.
2. Raftopoulos V. A grounded theory for patients’ satisfaction with quality of hospital care. ICU Nurs Web J. 2005;22:1–15.
3. McKinstry B. Paternalism and the doctor-patient relationship in general practice. Br J Gen Pract. 1992;42:340–2.
4. Clever SL, Jin L, Levinson W, Meltzer DO. Does doctor-patient communication affect patient satisfaction with hospital care? Results of an analysis with a novel instrumental variable. Health Serv Res. 2008;43(51):1505–19.
5. Ko HH, Zhang H, Telford JJ, Enns R. Factors influencing patient satisfaction when undergoing endoscopic procedures. Gastrointest Endosc. 2009;69(4):883-91.
6. Kumari R, Idris MZ, Bhushan V, Khanna A, Agarwal M, Singh SK. Study on patient satisfaction in the government allopathic health facilities of Lucknow district, India. Indian J Comm Med. 2009;34:35-42.
7. Linda DU. Patient satisfaction measurement: current issues and implications. Lippincott's Case Management. 2002;7(5):194-200.
8. José MQ, Nerea G, Amaia B, Felipe A, Antonio E, Cristóbal E, et al. Predictors of patient satisfaction with hospital health care, Health Services Res. 2006;6:102.
9. Otani K, Herrmann PA, Kurz RS. Improving patient satisfaction in hospital care settings. Health Serv Manage Res. 2011;24(4):163-9.
10. John S, Anne MB, Austin L. Development of the Irish National Patient Perception of Quality of Care,
International J Quality Health Care. 2003;15(2):163-8.
11. Demir C, Celik Y. Determinants of patient satisfaction in a military teaching hospital. J Healthcare Quality. 2002;24(2):30-4.
12. Tonio S, Joerg K, Joachim K. Determinants of patient satisfaction: a study among 39 hospitals in an in-patient setting in Germany. Int J Quality Health Care. 2011;23(5):503-9.
13. Forough R, Mohammad E, Hamid H. Nurse caring in Iran and its relationship with patient satisfaction. Australian J Advanced Nursing. 2007;26(2):75-84. 14. Yogesh PP, Gaurav R, Satyanarayana C. Factors
affecting In-patient Satisfaction in Hospital - A Case Study, International Conference on Technology and Business Management. 2011;28-30.
15. Kui-Son C, Lee H, Kim C, Lee S. "The service quality dimensions and patient satisfaction relationships in South Korea: comparisons across gender, age and types of service", Journal of Services Marketing. 2005;19(3):140–9.
16. Shou-Hisa C, Ming-Chin Y, Tung-uang C. Patient satisfaction with and recommendation of a hospital: effects of interpersonal and technical aspects of hospital care. Int J Quality Health Care. 2003;15(4):345-55.
17. Soo SK, Stan K, Mark VJ. The Effects of Physician Empathy on Patient Satisfaction and Compliance, Evaluation and The Health Professions. 2004;27(3):237-9.
18. Andrabi SA, Hamid S, Rohul J, Anjum F. Measuring patient satisfaction: A cross sectional study to improve quality of care at a tertiary care hospital, Health line, 2012;3(1):59-62.
19. Baruah M, Dawka K, Kataki AC. Patient satisfaction: a tool for quality control. Int J Community Med Public Health. 2016;3:1215-8. 20. Qadri SS, Pathak R, Singh M, Ahluwalia SK, Saini
S, Garg PK. An assessment of patient satisfaction with services obtained from a tertiary care hospital in rural Haryana. Int J of Collaborative Research on Internal Med Public Health. 2012;4(8):1523-37. 21. Tasneem A, Shaukat S, Amin F, Mahmood KT.
Patient satisfaction; a comparative study at teaching versus DHQ level hospital in Lahore, Pakistan. J Pharm Sci Res. 2010;2(11):767-74.
22. Kulkarnil MV, Dasgupta S, Deoke AR, Nayse. Study of satisfaction of patients admitted in a tertiary care hospital in Nagpur. Nat J Community Med. 2011;2(1):37-9.
23. Mahapatra P, Srilatha S, Sridhar P. A patient satisfaction survey in public hospitals. J Academy Hospital Administration. 2001;13:11-5.
24. Deva SA, Haamid M, Naquishbandi JI, Kadri SM, Khalid S, Thakur N. Patient satisfaction survey in outpatient department of a tertiary care institute. J Community Med. 2010;6(1):1524-37.
Cite this article as: Samant S, Saini RS.An