Plasma Diagnostics with Tracer-Encapsulated Solid Pellet
∗)Shigeru SUDO
1,2), Naoki TAMURA
1), Sadatsugu MUTO
1,2), Tetsuo OZAKI
1),
Chihiro SUZUKI
1), Hisamichi FUNABA
1,2), Izumi MURAKAMI
1,2), Daiji KATO
1,2),
Shigeru INAGAKI
3)and Katsumi IDA
1,2)1)National Institute for Fusion Science, 322-6 Oroshi-cho, Toki 509-5292, Japan 2)The Graduate University for Advanced Studies, Hayama, Kanagawa 240-0193, Japan
3)Research Institute for Applied Mechanics, Kyushu University, 6-1 Kasuga-Koen, Kasuga 816-8580, Japan
(Received 24 January 2014/Accepted 11 March 2014)
The diagnostics method of a tracer-encapsulated solid pellet (TESPEL) has been developed. TESPEL con-sists of polystyrene as an outer shell and of specific material as a tracer in the core. Owing to the advantages of the TESPEL, the following results have been successfully obtained: (1) distinctive different feature of impurity transport between the plateau and Pfirsch-Schlüter regimes depending on the impurity source location which is analyzed with the STRAHL code, (2) specific feature of a non-local thermal transport such as abrupt increase of electron temperature in the plasma core in case of plasma cooling in the plasma periphery due to a small TESPEL injection, (3) spatially resolved energy distribution of the high energy particles obtained by a pellet charge ex-change method, (4) longer impurity containment inside the magnetic island which is observed by depositing the tracers in the magnetic island by means of the TESPEL, and (5) identification of new spectral lines using interested atoms contained in the core of the TESPEL.
c
2014 The Japan Society of Plasma Science and Nuclear Fusion Research
Keywords: TESPEL, pellet, tracer, impurity diagnostics, impurity transport DOI: 10.1585/pfr.9.1402039
1. Introduction
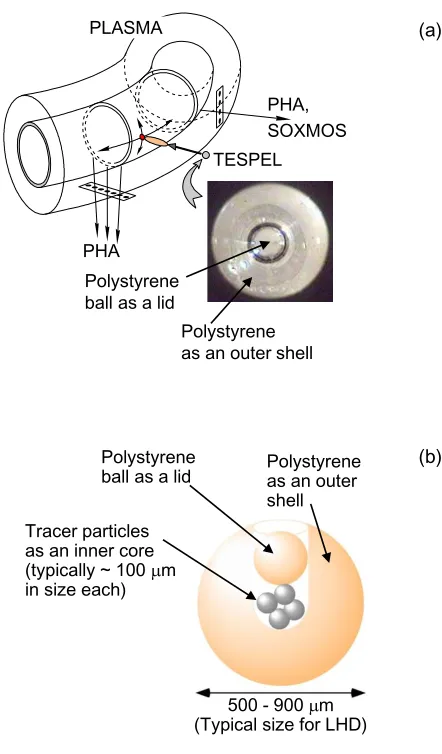
The diagnostic method of a tracer-encapsulated solid pellet (TESPEL [1, 2]) has been developed, since the first TESPEL injection experiment was carried out at the Com-pact Helical System (CHS) for the purpose of the impu-rity transport study [3, 4]. After the TESPEL injection ex-periments at the Large Helical Device (LHD) started in 2000 [5, 6], the impurity transport study has been carried out [7–10], but it has been also found that the TESPEL method is available for the various diagnostic purposes. TESPEL consists of polystyrene (polymer in the form of (C8H8)n) as an outer layer with the void of the typical
di-ameter of 250µm and of specific material as tracers in the core.
The advantages of the TESPEL method are summa-rized as follows:
(a) Direct local deposition of tracers inside the plasma is possible,
(b) Deposited amount of the tracer inside the plasma can be known precisely,
(c) Relatively wide selection of tracer materials is possi-ble,
(d) Flexibility owing to a relatively wide range of pel-let size enables the variable penetration depth of the tracer via the TESPEL.
author’s e-mail: [email protected]
∗)This article is based on the invited talk at the 30th JSPF Annual Meeting
(2013, Tokyo).
Based on the above advantages of this method, the fol-lowing various studies are being implemented:
(a) Impurity transport,
(b) Particle and thermal transport related to a magnetic island,
(c) Thermal transport with a non-local feature under a relatively low-collisionality condition,
(d) High energy particle observation with a pellet charge exchange (PCX) method, and
(e) Spectroscopy with interested atoms contained in the core of the TESPEL.
In the next section, the TESPEL injection system is briefly summarized, and the present research status of the above various fields is reviewed in the following sections.
Before starting the next sections, we would like to note one more advantage of the TESPEL, that is, the small disturbance on the bulk plasma. The TESPEL outer diame-ter ranges typically 500∼900µm (for aiming at very shal-low penetration, up to 400µm is also used), and amount of the tracer particles is typically∼1017particles. This is
less by a factor of 104than that of the typical bulk plasma
particles. On the other hand, the amount of C and H parti-cles contained in the polystyrene pellet with a diameter of 720µm is about 1×10¹⁹ particles for each. Thus, when
these ions are fully stripped, the total electron number in-troduced by TESPEL causes the density increase of only 0.2×10¹⁹m−3, which is still smaller by a factor of more
c
2014 The Japan Society of Plasma
than 10 than the LHD plasma density in case of the usual impurity transport study. Thus, the disturbance on the bulk plasma by the TESPEL injection is relatively small. This is an attractive point. Furthermore, by containing multi-ple tracers in a TESPEL, the different tracer species can be compared simultaneously under the same plasma con-dition [11, 12].
2. Experiment Setup
The principle of the TESPEL diagnostics with the real photo of TESPEL is shown in Fig. 1 (a), and the schematic of TESPEL configuration is shown in Fig. 1 (b). The di-rect deposition of the tracers in the plasma with relatively small disturbance is an important feature of the TESPEL. The deposition location can be changed with adjusting the outer diameter and the shell thickness of TESPEL. To ob-serve emission lines from tracers in the vacuum ultraviolet range, a high-resolution, time-resolving soft x-ray multi-channel spectrometer (SOXMOS) [13] is used. To observe the characteristic x-ray lines such as the Kαline, the soft
Fig. 1 (a) Principle of the TESPEL diagnostics with the real photo of TESPEL and (b) the schematic of TESPEL con-figuration.
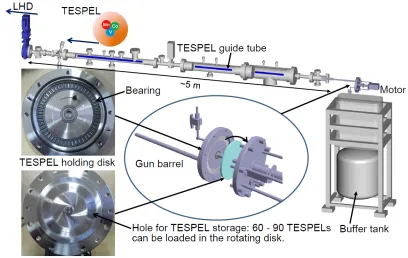
x-ray pulse height analyser (PHA) [14] is also equipped. The energy resolution is typically 160 eV, and a Be filter with a thickness of about 1 mm is inserted for avoiding low-energy photons. The TESPEL injection system [15] is shown in Fig. 2. The flange disk contains 60 ∼ 90 TESPELs on the circumference. The tracer materials and their amount are registered for each position. This pel-let holding disk and the counter disks having bearing are piled. Then, the disk is remotely rotated by a servomotor, and at a certain timing which is pre-scheduled, a TESPEL is ejected through a gun barrel by a He gas with a pressure of 20∼30 atm. The typical TESPEL velocity ranges from 300 to 400 m/s. The TESPEL is guided by the guide tubes, and there is a fast gate valve between the guide tubes, thus, the system works well as a differential pumping system. In fact, when a TESPEL is ejected into the LHD chamber without plasma, the He pressure increase is not detectable.
3. Impurity Transport Study
3.1
Previous impurity transport studies
The impurity transport is one of key issues for devel-oping a magnetically confined fusion reactor, because im-purities could radiate substantial radiation power, which cools the bulk plasma. And, the existence of the impuri-ties causes the dilution of the fuel. Considering the helium ash as impurity, it is a significant subject to find out how to evacuate the helium ash in an appropriate way.
ob-Fig. 2 TESPEL injection system.
Fig. 3 Impurity decay time versus the average electron density for the helical systems: LHD, TJ-II, W7-AS, duplicated from Ref. [16].
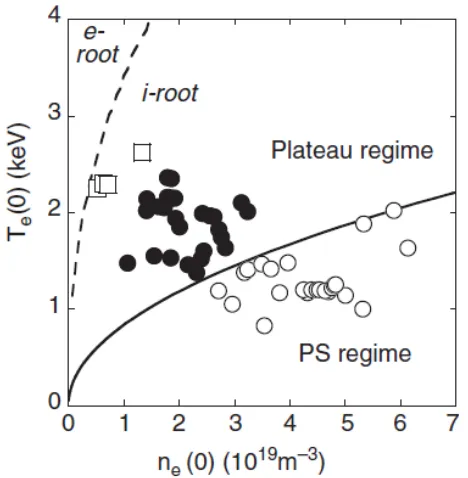
served at LHD is shown on thene(0)–Te(0) diagram [18].
The solid circles indicate the plasmas with impurity accu-mulation and the open squares indicate the plasmas with-out accumulation. The open circles indicate the plasmas with the decrease of impurities or without impurity accu-mulation. It was concluded that the impurity is
accumu-Fig. 4 Impurity decay time observation at W7-AS with Al injec-tion by a laser blow-offtechnique, duplicated from Ref. [17]. The high-density discharge (HDH) shows much shorter decay time compared to the case of the normal confinement (NC) discharge.
lated in the plateau regime, while it is not accumulated in the Pfirsch-Schlüter (PS) regime. Here it should be noted again that the relevant impurities are intrinsic ones, thus the impurity source is located outside of the plasma.
3.2
Present impurity transport studies
Fig. 5 Impurity behavior observed at LHD is shown on the
ne(0)–Te(0) diagram, duplicated from Ref. [18]. The solid circles indicate the plasmas with impurity accumu-lation and the open squares indicate the plasmas without accumulation. The open circles indicate the plasmas with the decrease of impurities or without impurity accumula-tion.
Table 1 Elements of tracers and intrinsic impurities.
The red color indicates tracer atoms and the purple color de-notes intrinsic impurities from the wall. The green color corre-sponds to the atom via gas puffing.
tracers and intrinsic impurities are shown in Table 1. The intrinsic elements of Cr, Fe and Ni stem from the vacuum chamber made of stainless steel. Titanium (Ti) comes from the titanium gettering. So, it is natural to select V, Mn and Co as tracers in between those intrinsic elements. We could put simultaneously these triple tracers in the core of one polystyrene ball with a typical diameter of∼700µm, and the tiny amount of those tracers is enough for observing the line emission from the tracers with a good S/N ratio as shown later. Ar is used as a simulator for the impu-rity existing outside of the plasma. The time integrated X-ray energy spectra of the Kα line emissions of V, Mn and Co and the intrinsic impurities for the plateau regime (LHD #106986) and PS regime (LHD #106999) are shown in Fig. 6. The average densityneis 3.4×10¹⁹m−3for LHD
#106986, and 6.6×10¹⁹m−3for LHD #106999. The NBI
power is about 20 MW for the both cases. The density in-crease by TESPEL itself is relatively small compared to the bulk plasma. The Kαline intensities of the tracers in the
Fig. 6 X-ray energy spectra of the Kαline emissions of the trac-ers (V, Mn and Co) and the intrinsic impurities (Ti, Cr, Fe and Ni) for the plateau regime (LHD #106986, black line) and PS regime (LHD #106999, red line). Green boxes show the energy range corresponding to the Kαlines of the tracers.
Fig. 7 Profiles of (a) electron temperature and (b) electron den-sity for the plateau regime (LHD #106986, purple dia-monds) and PS regime (LHD #106999, red circles).
PS regime are higher than those of the plateau regime. The Kαline emissions of the intrinsic impurities of Ti, Cr, Fe and Ni are clearly observed in case of the plateau regime. In contrast to this, these are completely suppressed in case of the PS regime. The temperature and density profiles at the timing of 312 ms after TESPEL injection are shown in Fig. 7. The central electron temperatureTe(0) is 3 keV for
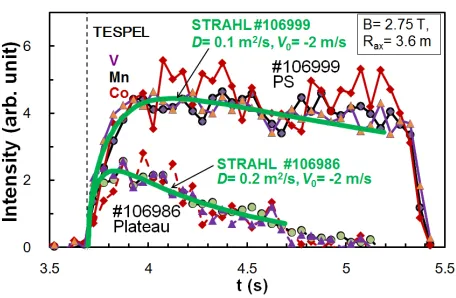
Fig. 8 Temporal evolutions of Kαintensities from the tracers (V, Mn and Co) in the two different collisional regimes. The STRAHL calculation with the assumedD(spatially flat) and V (inward pinch with the peak value of −2 m/s at
reff/a99=0.9) are also shown.
Temporal evolutions of Kαintensities from the trac-ers (V, Mn and Co) in the two different collisional regimes are shown in Fig. 8. The STRAHL [19] calculation with the assumed particle diffusion coefficientD(spatially flat) and inward pinch V (with the peak value of −2 m/s at reff/a99=0.9) are also shown, wherereffis defined by a
ra-dius corresponding to the volume in a cylindrical approx-imation enclosed by each radial magnetic surface of the real plasma, anda99is defined as the value ofreff
contain-ing 99% of the whole plasma energy. The local emissivity is calculated by STRAHL. For comparing with the experi-mental data, the local emissivity is integrated along the line of sight. The experimental data is normalized att=∼3.9 s. In the plateau regime, the decay feature of the calculated intensity withD=0.2 m2/s fits well with the experimental
one as shown in the figure. In the PS regime, the exper-imentally obtained intensity is kept for a long time. For reference, the calculated one withD=0.1 m2/s is shown. Due to the slow decay feature, the sensitivity for fitting the diffusion coefficient is not enough in this case. So, the dif-fusion coefficient ofD=0.1 m2/s should be considered as the upper limit. It should be also noted that the decay fea-ture is essentially the same for the three different tracers. So, there is not a clear Z dependence on the decay time. The deposition location of the tracers are in the range ofρ (∼reff/a99)=0.6∼0.75.
In order to investigate the case of the shallower lo-cation of the tracer deposition, we made a thin-shell-type TESPEL with smaller radius (600µm) than the previous case (about 700µm) and shell thickness of 75µm. Tracer ablation light in the case of thin-shell-type of TESPEL (LHD #118204: plateau regime, LHD #118209 and LHD #118216: PS regimes) is shown in Fig. 9. The location of the ablation light for the thick-shell-type TESPEL (LHD #113548: plateau regime and LHD #113581: PS regime) is also shown for comparison. This “thick-shell-type” means
Fig. 9 Radial profile of the tracer ablation lights of the thin-shell-type TESPEL (LHD #118204: plateau regime, LHD #118209 and LHD #118216: PS regimes). The lo-cation of the tracer deposition by the solid-type TESPEL (LHD #113548: plateau regime and LHD #113581: PS regime) are also indicated for comparison.
Fig. 10 Temporal evolutions of Kαintensities from the tracers (V and Mn) in case of the PS regime. In this case, the TESPEL is the thin-shell-type.
typically the thickness of the shell of 200-250µm which is much larger than ∼75µm in case of thin-shell-type. As for the PS regime, the location of the deposition of the tracer particles is aboutρ=∼0.7 in case of the thick-shell-type of TESPEL, while ρ = 0.8 ∼ 0.85 in case of the thin-shell-type of TESPEL. Thus, the shallower deposi-tion of the tracer particles is realized. Under this condideposi-tion of the shallow deposition with using the thin-shell-type of TESPEL, the Kαline emissions from the tracers, V and Mn are shown in Fig. 10 in case of the PS regime. The Kα line intensities of these tracers are kept for a long time as the case of the tracer deposition location atρ=∼0.7. So, essentially the long confinement feature of the impurity is applicable up toρ=∼0.85 in the PS regime.
Fig. 11 Temporal evolutions of the electron density measured with the FIR interferometer for the two collisionality cases. Green dotted line indicates the timing of Ar SSGP (supersonic gas puffing).
Fig. 12 Temporal evolutions of the Ar Kαintensity for the two collisionality cases.
particles is equivalent with that of the tracers. So, due to the very small number of the particles, the density rise due to the Ar gas puffis not detectable with the FIR system (The density increase at the timing of the TESPEL injec-tion is due to the polystyrene, not due to the tracers.). Even with such a small amount, the intensity of the Ar Kαline is clearly detected, and the temporal evolution of the Ar Kαline intensity is shown in Fig. 12. The suppression of the Ar Kαline intensity in case of the PS regime indicates the shielding effect of the Ar particles. The suppression mechanism of the LHD plasma was studied by Kobayashi et al.[20, 21], and it will be briefly discussed later.
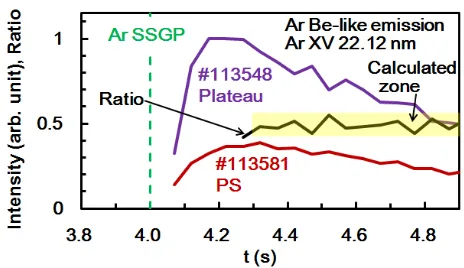
In contrast to the Ar Kαline emission, we observed the Be-like and Li-like line emissions from the Ar parti-cles with enough S/N ratio even in case of the PS regime. In Fig. 13, the Ar Be-like line emissions (22.12 nm) for the plateau and PS regimes are shown. The Ar Li-like line emissions (35.39 nm) for the plateau and PS regimes are shown in Fig. 14. The intensity ratios of the PS versus plateau are shown with the black solid lines in Figs. 13 and 14. In order to see how deep the Ar particles penetrate
Fig. 13 Temporal evolutions of the Ar Be-like intensity for the two collisionality cases.
Fig. 14 Temporal evolutions of the Ar Li-like intensity for the two collisionality cases.
into the plasma in case of the PS regime, we used these intensity ratios shown as calculated zone with yellow color in the figures for both the Be-like and Li-like line emis-sions. At first, the temporal developments of the distri-bution of Ar Li-like ions calculated by the STRAHL code with neglecting the shield effect described above are shown in Figs. 15 (a) and (b) for both the collisionality regimes. TheDandVvalues are used as the same ones as in Fig. 8. Then, it is seen that the Ar Li-like ions in case of the plateau regime are rather localized in the plasma periph-ery (atρ ∼ 0.9). On the other hand, the Ar Li-like ions in case of the PS regime are relatively widely distributed, and the total number of the Li-like ions is much more than the case of the plateau regime. But, this is contradictory to the experimental results. Thus, we count the integrated ion number from the plasma periphery to the certain radius ofρ (∼reff/a99) in case of the PS regime. The integrated ion
Fig. 15 Spatio-temporal developments of the Ar Li-like ion den-sity calculated by the STRAHL code with neglecting the shield effect for (a) the plateau regime and (b) the PS regime.
Fig. 16 Integrated ion distribution ratio (ISDR) of the summa-tion in the PS regime versus the plateau regime. The summation in the PS regime is taken from the plasma periphery to the certain radius ofρ(∼reff/a99). The sum-mation in the plateau regime is taken for the whole ra-dius.
particle number for calculation. The dotted line shows the case that the total Ar particle number is multiplied by a fac-tor of 10. This facfac-tor is rather insensitive for the location.
This is because the Ar Li- and Be-like ion fractions depend very strongly on the electron temperature in the plasma pe-riphery. For example, in the PS regime, the Ar Li-like ion fraction is only 1×10⁻⁶atρ=1 (Te=170 eV), while 0.2
atρ=0.95 (Te=310 eV) according to the NIST data [22].
So, the ratio is a very steep function of the electron temper-ature. The possible overlapping region for the Ar Li- and Be-like ion distributions consistent with the experimental results isρ= 0.88 ∼ 0.93. Considering the fact that the property of the tracers deposited withinρ = 0.85 is the same as in the case for the inner deposition of the tracers, it is concluded that the location of the discriminating the impurity property is aroundρ = 0.9 (0.85 - 0.93) in case of the PS regime. So, the shielding mechanism is working in the plasma periphery [20, 21]. In the edge surface layers where the connection length is short, the friction force is working stronger in the higher density case. In the stochas-tic region, the thermal force is directed upstream due to the parallel temperature gradient, and the friction force is usu-ally directed toward the divertor plates. The temperature gradient along the magnetic field line becomes smaller in the higher density case. This causes decrease of the ther-mal force. The ratio of the therther-mal and the friction forces depends strongly on the density, and the ratio is propor-tional ton−e2.5∼−3[21]. So, in our experiments, the sup-press of the influx of the impurities from the outside of the plasma may be due to the fact that the thermal force is de-creased and the friction force dominates in case of the high density. From our experimental results, it is indicated that impurities coming from the outside of the plasma in the PS regime penetrate a little bit deeper (Δρ = ∼0.1) than the closed magnetic surface, but do not reach the long confine-ment region.
3.3
Impurity transport inside a magnetic
island
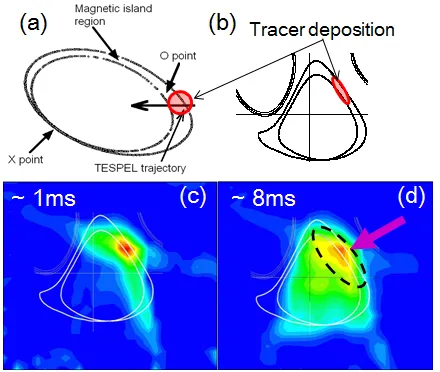
In order to study the property of impurity transport inside the magnetic island, the titanium impurity was in-jected into the magnetic island O-point with the TESPEL [23, 24]. Here, the magnetic island O-point was expanded intentionally by using the auxiliary coil. The cross sec-tion including the TESPEL injecsec-tion line and that of the 2-D tracer emission measurement with AXUVD (Abso-lute eXtreme UltraViolet photoDiode) arrays are shown in Figs. 17 (a) and (b), respectively. Reconstructed 2-D tracer emission images at (c)t∼1 ms and (d)t∼8 ms after the TESPEL injection are also shown in Fig. 17. For compar-ison, the magnetic island shape at the deposition location of the tracer impurity was changed from the O-point to the X-point. In the X-point case, the prolonged and localized emission as shown in Fig. 17 (d) was not observed. So far, the significant change of the neutral particle density has not been observed, when a phase of the magnetic island is changed. As the relevant magnetic island (m/n =1/1) (at
Fig. 17 (a) Tracer deposition inside the magnetic island can be achieved with a TESPEL method. (b) Corresponding cross section of 2-D tracer emission measurement with the AXUVD arrays. Reconstructed 2-D tracer emis-sion images at (c)t ∼1 ms and (d)t∼ 8 ms after the TESPEL injection.
density is much lower than that of the edge plasma. It is less possible that the neutral particle density plays a sig-nificant role in the difference of the transport of the tracers inside the magnetic island O-point or X-point. Thus, it seems that the impurities diffuse faster in the X-point case than the case of the O-point. In another words, this experi-ment shows apparently a long impurity confineexperi-ment inside the magnetic island O-point. Also, a significant reduction of thermal transport is observed inside the magnetic island O-point [25, 26] by using the TESPEL. Concerning the study of heat and impurity inside the magnetic island O-point, the flexible property of the TESPEL is extensively utilized. That is, the outer diameter of TESPEL is selected so that appropriate penetration may be possible. This flex-ibility is also applied for the study of non-local feature of the electron thermal transport. It has been observed that the core electron temperature is abruptly increased just when the local electron temperature is decreased in the plasma periphery due to the TESPEL injection [27]. The phenom-ena occur in the relatively low-collisionality regime [28] (See also [29] for more detailed characteristics on non-local electron heat transport investigated by the TESPEL injection.). Although the formation of the electron inter-nal transport barrier (e-ITB) can be seen in such a regime, the non-local core electron temperature rise in response to the edge perturbation is essentially different from the elec-tron temperature rise by the improvement of the elecelec-tron thermal transport due to the e-ITB formation [30]. Re-cently, the long-ranged low-frequency electron tempera-ture fluctuation has been discovered in the plasma exhibit-ing the non-local core electron temperature rise [31], which would shed light on the physical mechanism of such a phe-nomenon. Such a local and small disturbance of electron
temperature by the TESPEL injection is also applied for the study of the electron thermal transport in the vicinity of the electron internal transport barrier [32].
4. Fast Particle Observation
TESPEL has a possibility to measure energy spectrum of fast ions, which go away from the plasma after expe-riencing charge-exchange with a dense neutral cloud sur-rounding the TESPEL. As we know the location of the dense cloud by the spectroscopic measurement according to the TESPEL velocity measured and the TESPEL injec-tion timing, so the temporal data measured by the local ac-tive fast neutral particle analyzer (NPA) can be converted to the spatial information. This method is called as a pel-let charge exchange (PCX) method [33–41], and it has a good spatial resolution. One example is shown in Fig. 18 where the resonance layer is changed for the ICRF heat-ing. The configurations of the standard resonance layer case: A and the central heating case: B for ICRF are shown in Fig. 18 (a). The Hα signal indicates the ablation of the polystyrene of TESPEL. The case A indicates more amount of fast particle production as shown in Fig. 18 (b) than the case B shown in Fig. 18 (c) [37]. The red circle shows the location of the energy increase in case A com-pared to case B.
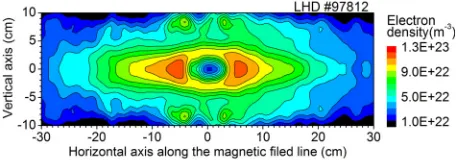
For the quantitative analysis of the fast ion measure-ments, the density profile of the ablation cloud surround-ing the TESPEL has been measured [42]. Figure 19 shows an example of the 2-Dneprofile in the TESPEL ablation
cloud, which is deduced from the 2-D measurement of Hβ
(Stark broadening) profile in the cloud [43], which is ob-tained with a nine-optical-lens system with different nar-row filters on a fast-shuttered C-MOS camera.
5. Application to the Spectroscopy
For the study of spectroscopy, interested atoms are put as tracer in TESPEL. It has been done especially in the range of EUV spectra from Nd, Gd [44, 45], Sn [46, 47] and W [48–50] and also the other heavy atoms. For ex-ample, spectra of highly charged Neodymium is studied with Neodymium tracer in the TESPEL having a diameter of 900µm under the plasma condition withTe(0)=2 keVand ¯ne=4×10¹⁹m−3. In this case, a line due to 3d3/24p1/2–
3d3/24d3/2transition (7.413 nm) of Ni-like Nd32+has been
assigned experimentally for the first time at LHD. The EUV emission of Sn around 13.5 nm will be applied for the future semiconductor lithography, and the emission of Gd around 6.8 nm is also interested for a shorter wavelength light source. These spectra are also investigated with the TESPEL method.
Fig. 18 (a) Location of the ICRF resonance layer for the stan-dard heating case A and the central heating case B. Fig-ures 18 (b, c) indicate that the fast particles are produced more in the case A than in the case B. The figures (b) and (c) are from Ref. [37], and red circle and arrow are added for highlighting the relevant point.
Fig. 19 2-Dneprofile in the TESPEL ablation cloud, which is deduced from the 2-D measurement of Hβprofile in the cloud.
6. Discussion
The impurity behaviors in the plasma core and pe-riphery have been studied by a triple-tracer TESPEL
in-jection. So far it has been found that the impurity transport property in the plateau regime is different from that in the PS regime. The experimental data are analyzed with the STRAHL calculation. The property of the long confine-ment time of the impurity deposited inside the plasma in the PS regime suggests that impurities coming in a flake form may remain for a long time, and that the He ash pro-duced inside the plasma may remain also for a long time in a future reactor machine. The high density operation is one of candidates for the helical type fusion reactor scheme. Especially, the extremely high density plasma called as a super dense core plasma has been successfully produced at LHD [51]. So, the collisionality in the plasma periphery of the future reactor relevant to the long confinement of impurities or He ash might be in the PS regime. As the im-purity shielding effect or outflow of the impurity exists in the plasma periphery in the PS regime, if we can transport the impurity to the plasma periphery, the impurity may be flushed away. The concrete measure for this is the future subjects to be studied.
As for the impurity transport study, it is essential to measure the temporal developments of the location of the impurities. This is done here by comparing the specific emission line and the measured electron temperature pro-file with calculation (for example, STRAHL code). Several chords of such observation of the specific emission line will be helpful for spatial resolution. But, for the moment, the number of chords is very limited. We are now devel-oping the measurement system of Kαlines in the chords with the order of 100 channels. On the other hand, there is a possibility to measure directly the spatially resolved impurities using a charge exchange recombination spec-troscopy. This is based on the charge exchange of the im-purity with the neutral beam of NBI for heating. There have been activities in the visible range [52,53] and soft X-ray range [54, 55] for this purpose. Although some signals were obtained through these activities, this method has not yet been used for a routine measurement due to the prob-lem of the background light.
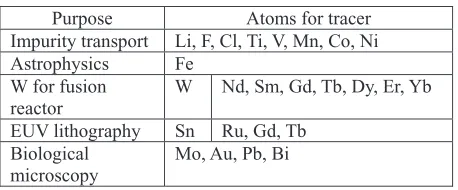
So far, 23 different elements have been utilized as tracer in TESPEL for the corresponding purposes as sum-marized in Table 2. For example, as a collaboration with the field of astrophysics, spectroscopic modelling for Fe ions in non-equilibrium ionization plasma has been de-veloped taking advantage of the well measured electron temperature and density of the LHD plasma for the Fe emission data, and it is applied to analyze the solar spec-tra observed by HINODE [56]. Except for these spec-tracers, TESPEL is also contributing to the investigation about the non-local transport owing to the flexibility of the pellet size, and it is also applied to the fast ion measurements. Thus, TESPEL are contributing to the various research fields.
Table 2 Implemented tracer atoms in TESPEL.
23 different atoms have been utilized. The third column of W for fusion reactor is for analyzing the W atom configura-tion with comparing the lower Z atoms. The third column of EUV lithography shows the shorter wavelength of the light source for higher accuracy than the standard atom of Sn. The atoms in the column of biological microscopy is for develop-ing the light source for transparent to the water (in the range of 300∼500 eV).
to avoid the carbon contamination, a tracer-encapsulated cryogenic pellet (TECPEL) is also developed [57–62]. In this case, the outer layer of the TECPEL is only hydrogen. The technology of producing and ejecting a TECPEL has been established [63]. The outer diameter of the TECPEL is about 3 mm, and it is not easy to change the diameter. This is the drawback of TECPEL compared to TESPEL.
7. Conclusion
It has been demonstrated that the advantages of TESPEL are useful for diagnostics in various fields. Espe-cially, impurity transport study is carried out using the fol-lowing unique features of TESPEL: (a) the local deposition of tracers inside the plasma is possible, (b) the deposited amount of the tracer inside the plasma can be known pre-cisely, (c) a relatively wide selection of the tracer mate-rial is possible, and (d) the variable penetration depth is possible due to a relatively wide range of the size. As a result, it was found that the impurity transport characteris-tics between the plateau and Pfirsch-Schlüter regimes are quite different. Using TESPELs with different shell thick-ness and the Ar gas puffing, it is shown that the impurity source location is essential for the impurity transport fea-ture. Namely, in the PS regime, the impurity deposited in-side the plasma is kept for a long time, while the impurity coming from the outside of the plasma cannot enter into the plasma core. On the other hand, in the plateau regime, the impurity deposited inside the plasma flows away easily from the core of the plasma, and the impurity coming from the outside of the plasma enters relatively easily into the plasma core.
Except for the impurity transport study, TESPEL con-tributed to the following studies: (1) when the plasma pe-riphery is cooled down by a small TESPEL injection, then abrupt increase of electron temperature in the plasma core is observed in case of relatively low collisionality regime. Such a non-local thermal transport has been studied
in-tensively using TESPEL injection, (2) spatially resolved energy distribution of the high energy particles has been observed with a TESPEL pellet charge exchange method, (3) longer impurity containment inside the magnetic island is observed by depositing the tracers in the O-point of the magnetic island by means of the TESPEL injection, and (4) new spectral lines are identified using interested atoms contained in the core of the TESPEL.
Acknowledgments
S. Sudo thanks Professors B. Kuteev and V. Sergeev for long continuing collaboration on the TESPEL devel-opments, and Prof. I. Viniar for the successful collabora-tion on the TECPEL developments. He would also like to acknowledge Drs. K.V. Khlopenkov, D. Kalinina, P.R. Goncharov, E. Veschev and Mr. I.A. Sharov for collabo-ration in the various fields related to the TESPEL activi-ties. He thanks Prof. T. Norimatsu of Osaka univ., Dr. M. Takagi and Mr. N. Satoh of Hamamatsu Photonics K.K. for the support on the polystyrene pellet preparation which is essential for the TESPEL production. He would like to thank Mr. S. Goto and JECC TORISHA Co., Ltd. for the support of the TESPEL injector construction. He thanks Osaka Vacuum, Ltd. and Mr. M. Kanno for support on the design and construction of the pellet injection line with the differential pumping system. As for the TECPEL develop-ments, the support from Mr. H. Ito and Nippon Sanso Cor-poration (the present Taiyo Nippon Sanso CorCor-poration) is very much appreciated. The authors would like to thank the technical staffs of LHD for their excellent support on the experimental preparation. This work is supported by a Grant-in-Aid for Scientific Research (B) (No. 19340179 and 23360415) from JSPS Japan and budgetary Grants-in-Aid of ULHH012 and ULHH017 from NIFS.
[1] S. Sudo, J. Plasma Fusion Res.69, 1349 (1993).
[2] K.V. Khlopenkov and S. Sudo, Rev. Sci. Instrum.69, 3194 (1998).
[3] S. Sudoet al., 17th IAEA CN-69 EXP1/18 (1998). [4] K.V. Khlopenkov and S. Sudo, Plasma Phys. Control.
Fu-sion43, 1547 (2001).
[5] N. Tamuraet al., J. Plasma Fusion Res. SERIES4, 442 (2001).
[6] S. Sudo et al., Plasma Phys. Control. Fusion 44, 129 (2002).
[7] N. Tamuraet al., J. Plasma Fusion Res. SERIES5, 400 (2002).
[8] S. Sudoet al., Plasma Phys. Control. Fusion 45, A425 (2003).
[9] N. Tamura et al., Plasma Phys. Control. Fusion45, 27 (2003).
[10] S. Sudoet al., J. Plasma Fusion Res.2, S1013 (2007). [11] S. Sudoet al., Nucl. Fusion52, 063012 (2012).
[12] S. Sudoet al., Plasma Phys. Control. Fusion55, 095014 (2013).
[13] J.L. Schwob, A.W. Wouters, S. Suckewer and M. Finkenthal, Rev. Sci. Instrum.58, 1601 (1987).
[15] S. Sudo and N. Tamura, Rev. Sci. Instrum. 83, 023503 (2012).
[16] R. Burhennet al., Nucl. Fusion49, 065005 (2009). [17] K. Idaet al., Plasma Phys. Control. Fusion45, 1931 (2003). [18] Y. Nakamuraet al., Nucl. Fusion43, 219 (2003).
[19] K. Behringer, Rep. JET-R(87)08, JET Joint Undertaking, Abingdon (1987).
[20] M. Kobayashiet al., Fusion Sci. Technol.58, 220 (2010). [21] M. Kobayashiet al., in Fusion Energy 2008 (Proc. 22nd Int.
Conf. Geneva, 2008) (Vienna: IAEA) CD-ROM file EX/ 9-4 and http://www-naweb.iaea.org/napc/physics/FEC/ FEC2008/html/index.htm.
[22] http://www-amdis.iaea.org/FLYCHK/
[23] N. Tamuraet al., J. Plasma Fusion Res.78, 837 (2002). [24] N. Tamuraet al., J. Plasma Fusion Res. SERIES8, 0975
(2009).
[25] S. Inagakiet al., Phys. Rev. Lett.92, 055002 (2004). [26] K. Idaet al., Nucl. Fusion44, 290 (2004).
[27] N. Tamuraet al., Phys. Plasmas12, 110705 (2005). [28] N. Tamuraet al., Nucl. Fusion47, 449 (2007). [29] N. Tamuraet al., Fusion Sci. Technol.58,122 (2010). [30] N. Tamuraet al., Contrib. Plasma Phys.50, 514 (2010). [31] S. Inagakiet al., Phys. Rev. Lett.107, 115001 (2011). [32] S. Inagaki et al., Plasma Phys. Control. Fusion46, A71
(2004).
[33] P.R. Goncharovet al., Rev. Sci. Instrum.74, 1869 (2003). [34] P.R. Goncharovet al., Rev. Sci. Instrum.75, 3613 (2004). [35] T. Ozakiet al., Rev. Sci. Instrum.77, 10E917 (2006). [36] P.R. Goncharov et al., Rev. Sci. Instrum. 77, 10F119
(2006).
[37] T. Ozakiet al., J. Plasma Fusion Res.2, S1072 (2007). [38] T. Ozakiet al., Fusion Eng. Des.82, 1251 (2007). [39] T. Ozakiet al., Rev. Sci. Instrum.79, 10E518 (2008). [40] T. Ozaki et al., J. Plasma Fusion Res. SERIES 8, 1089
(2009).
[41] T. OZAKIet al., Plasma Fusion Res.7, 2402138 (2012). [42] N. Tamuraet al., Rev. Sci. Instrum.79, 10F541 (2008). [43] I.A. Sharovet al., in Proceedings of the 37th EPS
Con-ference on Plasma Physics, Dublin, Ireland, 2010, p.5.131; also see http://ocs.ciemat.es/EPS2010PAP/pdf/P5.131.pdf. [44] C. Suzukiet al., J. Phys. B: At. Mol. Opt. Phys.45, 135002
(2012).
[45] C. Suzukiet al., Phys. Scr.T156, 014078 (2013). [46] C. Suzukiet al., J. Phys.: Conf. Series163, 012019 (2009). [47] C. Suzukiet al., J. Phys. B: At. Mol. Opt. Phys.43, 074027
(2010).
[48] C.S. Harteet al., J. Phys. B: At. Mol. Opt. Phys.43, 205004 (2010).
[49] C. Suzukiet al., J. Phys. B: At. Mol. Opt. Phys.44, 175004 (2011).
[50] D. Katoet al., Phys. Scr.T156, 014081 (2013). [51] N. Ohyabuet al., Phys. Rev. Lett.97, 055002 (2006). [52] V.Yu. Sergeevet al., Plasma Phys. Control. Fusion44, 277
(2002).
[53] D. Kalininaet al., J. Plasma Fusion Res.6, 634 (2004). [54] D. Kalininaet al., J. Plasma Fusion Res.80, 545 (2004). [55] D. Stutmanet al., Rev. Sci. Instrum.76, 013508 (2005). [56] I. Murakamiet al., Plasma Fusion Res.9, 1401056 (2014). [57] S. Sudo and H. Itoh, in Proceedings of the 16th SOFE con-ference, Illinois, 1995 (IEEE, New York) 2, 1589 (1996). [58] S. Sudo, H. Itoh and K.V. Khlopenkov, Fusion Technol.1,
853 (1996).
[59] S. Sudo and H. Itoh, Fusion Eng. Des.34-35, 343 (1997). [60] S. Sudo, H. Itoh and K. Khlopenkov, Rev. Sci. Instrum.68,
2717 (1997).
[61] I. Viniaret al., Rev. Sci. Instrum.72, 2575 (2001). [62] I. Viniaret al., Fusion Eng. Des.58-59, 295 (2001). [63] S. Sudo, I. Viniar, A. Lukin, P. Reznichenko and A. Umov,