Removal of Shells in Palm Kernel Cake via Static Cling and
Electrostatic Separation
Muhamad Akhmal Hakim Roslan
1, Norhani Abdullah
1,2*, Shuhaimi Mustafa
31Institute of Tropical Agriculture, Universiti Putra Malaysia, 43400, UPM Serdang. Selangor. Malaysia.
2Department of Biochemistry, Faculty of Biotechnology & Biomolecular Sciences,
Universiti Putra Malaysia, 43400, UPM Serdang, Selangor., Malaysia.
3Department of Microbiology, Faculty of Biotechnology & Biomolecular Sciences,
Universiti Putra Malaysia, 43400, UPM Serdang, Selangor., Malaysia.
*Corresponding author: Prof. Dr. Norhani Abdullah, Department of Biochemistry,
Faculty of Biotechnology & Biomolecular Sciences/ Institute of Tropical Agriculture, Universiti Putra Malaysia,
43400, UPM Serdang, Selangor, Malaysia. Email: [email protected]
Tel. +603-89471147 Fax: +603-8938 1612.
INTRODUCTION
In 2013, Malaysia has more than 4.49 million hectares of oil palm plantation, producing more than 2.2 million tonnes of palm kernel cake (PKC) per annum. Palm kernel cake is the residue left from the kernel after oil extraction. The Malaysian Palm Oil Board (MPOB) reported that 2.23 million tonnes of PKC which accounted 93% of PKC produced in 2011 was exported to countries such as the European Union for formulation of ruminant feeds [1]. Successful application of PKC as a concentrate feed for ruminant is well established [2, 3].
The protein content of PKC was about 14 to 21% [4] and metabolisable energy of 9.74 MJ kg-1 [5]. Due to its relatively
high protein content, PKC has been considered as a feed ingredient for poultry [6-8]. Earlier studies by Osei and Amo [9]
showed inclusion rate of up to 10% PKC in broiler diet did not affect the feed conversion efficiency, and later Okeudo et al. [10] reported that inclusion rate of 30% did not significantly affect broilers performance. However, broilers fed with diet containing 45% PKC suffered significant performance reduction even with the supplementation of lysine and methionine. Although these results clearly indicate the potential of PKC as a poultry feed, its utilization is still not widely accepted, due to inconsistency of research findings [4].
Due to the rising cost of imported feed ingredients like corn and soybean, local feed resources has to be seriously considered to sustain the local poultry production. As PKC is available throughout the year, and is non-competitive as human food, its utilization as poultry feed has to be enhanced. The main problem in PKC for it to be considered as an alternative feed ingredient for poultry is the high shell and dirt content of
HISTORY
Received: 9th February 2015
Received in revised form: 11th of April 2015
Accepted: 12th of July 2015
ABSTRACT
Palm kernel cake (PKC), a by-product of the palm oil industry is limited in its use as a feed ingredient for poultry due to its high fibre and lignin content. The presence of these anti-nutritive components is the result of shells contaminating the by-product. The anti-nutritive value of PKC has to be improved in order to increase its inclusion rate in poultry diet. In this study, PKC was subjected to a separation method using static cling and electrostatic separation to remove the shells present in PKC. Response surface methodology based on Box-Behnken design was used to optimize the separation method with moisture content (8 to 18%), particle size distribution (0.5 to 2.5 mm) and feed rate (20 to 200 g/min) as the independent variables evaluated. According to the regression coefficients and significance of the quadratic polynomial model, the optimum separation parameters were as follows: 13% PKC moisture content; <1.5 mm PKC particle size and 110 g/min feed rate. Under these conditions, the total lignin content of PKC was reduced to 8.1% PKC and crude fibre to 10.2%.
KEYWORDS
palm kernel cake static cling separation shells lignin
JOURNAL OF BIOCHEMISTRY, MICROBIOLOGY
AND BIOTECHNOLOGY
3.6 to 21.4% [11,12], lignin 15% [13] and fibre 18 to 21% [14-16]. These components greatly reduced nutrient digestibility [17].
The shells in the PKC are indigestible and are generally considered as the main source of lignin [18]. The shells cannot be eliminated from PKC during palm kernel processing prior to oil extraction. It is also difficult to completely remove the shells because they are of various sizes, irregular in shapes and also of similar densities to the kernel residue. Due to these factors, the PKC available in the market is contaminated with broken shells. Sinurat et al. [19] reported the removal of shells in PKC via sieving method, was not successful in removing shells with particle size of lower than the size of sieve pores.
Electrostatic separation method based on electromagnetic characteristics has been developed for industries such as agriculture and mineral beneficiation [20]. In agriculture, electrostatic separation was used to separate fiber from the dry-milled corn [21] and fibre-containing oilseeds [22], separate aleurone and pericarp fraction of bran [23] and separate broken and complete wheat seeds [24]. In mineral beneficiation, electrostatic separation was used to separate unburned carbon from coal fly ash [25].
The phenomenon whereby light objects have the tendency to be attracted and stick to other objects owing to static electricity is called static cling. The static cling ability is associated with triboelectric effect whereby different materials can become electrically charged via electron transfer when they come in contact through friction [26]. In the present study, electrostatic separation technique was evaluated to reduce the lignin and fibre content of PKC based on the interaction of three dependent variables (moisture content, PKC particle size distribution and feed rate) using response surface methodology (RSM).
MATERIALS AND METHODS
Sample preparation
The PKC (purchased from Ace Edible Oil Industries Sdn. Bhd. from Kapar, Selangor) was milled to obtain <0.5 mm, <1.5 mm and <2.5 mm diameter particle size fractions. The PKC moisture content was adjusted to 8%, 13% and 18% by adding distilled water. The treated PKC samples were sealed in polyethylene bags and stored at -20°C. Palm kernel shells were also collected, ground (1.5 mm sieve) and dried at 60°C.
Separation technique
An apparatus was designed to remove shells from PKC via static cling and electrostatic separation technique. Different types of polymers (chiffon, acrylic, polyester, jute fiber and acetate fiber) were evaluated as separators. Two hundred gram of PKC were spread on the surface of the separator sheet. Horizontal shaking (reciprocal movement) caused the shell particles to fall off from the separator, leaving the PKC residue sticking on the surface of the separator, which was collected manually using a scrapper. The separation process was standardized by maintaining 160 g of PKC collected on the surface of the separator, while the amount of unwanted PKC was set at 40 g from the total 200 g of PKC used for every run.
Response Surface Methodology (RSM)
The experiment for three independent variables was conducted using Box-Behnken design and RSM [27]. The independent variables were PKC moisture content (8 to 8%), PKC particle size (0.5 to 2.5 mm) and feed rate (20 to 200 g/min). The feed rate was the amount PKC placed on the surface of separator per minute. The experimental design for three independent
variables was investigated using Box-Behnken and RSM. The PKC moisture content (Z1, %), particle size distribution (Z2,
mm), and feed rate (Z3, g/min) were taken as independent
variables. The coded and actual variable levels of the three independent variables used in this study are presented in Table 1. The total lignin content of the collected PKC and unwanted PKC was used as the dependent variables of the samples. The experimental design, which resulted in 17 runs was developed using Design Expert 7.0.0 (2005). Regression analysis was performed for the results of dependent variables and fitted to the empirical second-order polynomial model.
Chemical Analyses
Crude fibre and protein were measured according to standard AOAC procedures [28]. The insoluble or klason lignin content was measured based on the modified standardized method of American Society for Testing and Materials (ASTM) D-1106 [29]. Three millilitres of 72% sulphuric acid were added to 150 mg of sample. The sample was placed in water bath at 30 °C for one hour. Eighty four millilitres of de-ionized water were added, and the sample mixture was placed in an autoclave at temperature of 125 °C for one hour. The sample was cooled into room temperature and filtered using a crucible filter. The insoluble lignin was washed using 50 ml of deionized water. The sample was dried in an oven at temperature of 103 °C until constant weight. The insoluble lignin content was calculated by the formula below:
W
x
100
W
IL
PKC lignin
=
Where,
IL = insoluble lignin content (%)
Wlignin = Weight of dry insoluble lignin or Klason lignin (g)
WPKC = Weight of dry matter of PKC (g)
The soluble lignin content was determined via spectrophotometric method using the filtrate obtained above. Five millilitres of 3% sulphuric acid were added to 5 ml of the filtrate. The absorbance was taken at 205 nm using a UV spectrophotometer. The soluble lignin content was calculated by the formula below:
SL
1000
CV
xW
x
100
PKC
=
Where,
SL = soluble lignin content (%)
V = total volume of the filtrate (ml)
WPKC = Weight of dry matter of PKC (g)
C = concentration of soluble lignin in the filtrate (g/l),
The concentration of soluble lignin in the filtrate (C) is given by:
=
initial final
V
V
A
C
110
Where,
A = Abs205nm
V final = final volume of the solution (ml)
V initial = initial volume of the solution (ml)
The total lignin content was obtained as shown below: Total lignin (TL) = Insoluble lignin (SL) + Soluble lignin (IL)
Statistical Analysis
Australia) were used for t-test and ANOVA analysis. All significant differences were considered at significant level of p < 0.05.
RESULTS AND DISCUSSION
Selection of separator
Contact electrification is a process whereby two dissimilar objects produces surface charges when they are come into contact by rubbing or frictional contact [30]. In textile, contact electrification is the most important source of electrostatic charge [31]. The development of electrostatic charge on fibres, fabrics and other textile assemblies can cause many serious problems. For example, the formation of electrostatic attraction due to contact charging can cause fabric cling that impede the opening of parachutes [31]. The lunar dust that cling to the astronaut’s spacesuit can reduced the external visibility on landing [32]. Instead of considering the contact electrification and static cling of textiles as a problem, the phenomenon could be applied for the separation of shells from PKC since PKC was accidentally observed to adhere on the surface of textiles, while the shells showed less ability to cling on the surface of textiles.
In the present study, five different types of polymers (chiffon, acrylic, polyester, jute fiber and acetate fiber) were evaluated as separators. The results clearly showed that the separation was dependant on the types of separator used. Table 1 shows that polyester gave the highest separation efficiency to produce collected PKC with the lowest total lignin content. It is probably because polyester has higher static electrification compared to other materials used in the present study. The chiffon made up from synthetic fiber showed the lowest separation efficiency as PKC particles could not adhere to the material surface.
Table 1.The effect of the types of separator on the removal of lignin from PKC.
Types of separator Total lignin (%)
Untreated PKC Collected PKC Unwanted PKC Control 15.80±0.49a
Chiffon 14.39±0.26b 18.33±0.58c
Polyester 7.64±0.45b 42.22±0.60c
Acrylic 8.81±0.31b 40.82±0.52c
Jute fiber 12.39±0.64b 26.75±0.93c
Acetate fiber 13.18±0.31b 22.54±0.26 c
Note:
(PKC moisture content, 8 %; particle size, <2.5 mm; and feed rate, 100 g/min)
Means ± standard deviation (n=3) with different superscripts within a row are significantly different (p<0.05)
Lignin content based on RSM
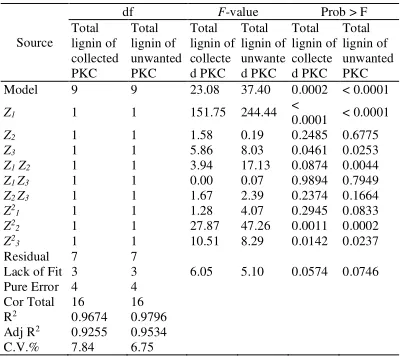
Table 2 show the experimental and predicted results of 17 separation runs on the content of total lignin of collected and unwanted PKC. The amount of total lignin of collected and unwanted PKC changed significantly in the range of 5.2% to 13.2% and 13.1% to 54.0%, respectively, under different experimental conditions. The analysis of variance for the predictive models developed for the total lignin of collected PKC and total lignin of unwanted PKC is shown in Table 3. The analysis showed that both models are acceptable (P<0.05) and has insignificant lack of fit which indicates the models could be used to predict values for the total lignin of collected and unwanted PKC. The coefficient of determination (R2) shows
that only 3.3% and 2.0% of total variation for total lignin models of collected and unwanted PKC are not explainable.
For the predictive model of total lignin of collected PKC, the linear coefficients (Z1, Z3) and quadratic coefficients (Z22,
Z2
3) were found to be significant, indicated by the small P-value
(P<0.05). The other term coefficients (Z2, Z1Z2, Z1Z3, Z2Z3, Z21)
were not significant with large P-values (P>0.05).
For the predictive model of total lignin of unwanted PKC, the linear coefficients (Z1, Z3), cross product coefficients (Z1Z2)
and quadratic coefficients (Z2
2, Z23) were found to be
significant, indicated by the small P-value (P<0.05). The other term coefficients (Z2, Z1 Z3, Z2 Z3, Z21) were not significant with
large P-values (P>0.05). The following second-order polynomial equations showed the relationship of the independent and dependent variables of the separation method experiments:
Total lignin of collected PKC, % = 7.66+3.17Z1+0.32Z2+0.62
Z3 -0.72 Z1 Z2-5E-3 Z1 Z3-0.47 Z2Z3+0.40Z21+1.87 Z22 +1.15 Z23
(Eq. 1)
Total lignin of unwanted PKC, % = 44.13-13.92Z1+0.39 Z2
-2.52 Z3 +5.21 Z1 Z2 -0.34 Z1 Z3+1.94Z2 Z3-2.48 Z21-8.44 Z22
-3.53 Z2
3 (Eq. 2)
Table 2. Experimental design for PKC and shell separation method with respective uncoded factors and response functions for total lignin of collected and unwanted PKC.
Note: Exp. Experimental Pred. Predicted
Table 3. Analysis of variance (ANOVA) for optimization of lignin reduction in PKC by static cling and electrostatic separation technique.
Source
df F-value Prob > F Total
lignin of collected PKC
Total lignin of unwanted PKC
Total lignin of collecte d PKC
Total lignin of unwante d PKC
Total lignin of collecte d PKC
Total lignin of unwanted PKC Model 9 9 23.08 37.40 0.0002 < 0.0001
Z1 1 1 151.75 244.44 <
0.0001 < 0.0001
Z2 1 1 1.58 0.19 0.2485 0.6775
Z3 1 1 5.86 8.03 0.0461 0.0253
Z1 Z2 1 1 3.94 17.13 0.0874 0.0044
Z1 Z3 1 1 0.00 0.07 0.9894 0.7949
Z2 Z3 1 1 1.67 2.39 0.2374 0.1664
Z2
1 1 1 1.28 4.07 0.2945 0.0833
Z2
2 1 1 27.87 47.26 0.0011 0.0002
Z2
3 1 1 10.51 8.29 0.0142 0.0237
Residual 7 7
Lack of Fit 3 3 6.05 5.10 0.0574 0.0746 Pure Error 4 4
Cor Total 16 16 R2 0.9674 0.9796
Adj R2 0.9255 0.9534
Effects of static cling and electrostatic separation technique on lignin content
The separation method evaluated significantly reduced (P<0.05) lignin in PKC by 50%. The response surface plots as shown in Fig. 1 to Fig. 3 illustrate the conditions for optimum reduction of lignin in PKC. The lowest value of lignin content was obtained when the moisture content was low, with moderate PKC particle size and feed rate.
During the separation process, contact electrification occurred when different materials contacted each other. In this case, the contact of the separator with the PKC contaminated with shells. During the separation process, the PKC particles and shells behaved differently. Most PKC remain attached to the separator and adhered to the separator surface. The PKC was detached from the surface of the separator by using a scrapper. On the other hand, most of the shells and some the PKC fell off during the shaking process. The amount of PKC attached to the surface of separator increased as the separator shaking cycles and speed increased. This was possibly due to the increased of static charge as the rubbing cycle, strength and speed increased [33,34].
As shown in Fig. 1, when the moisture content of PKC decreased, the efficiency of separation process was increased. This was indicated by the decrease and increase of the total lignin of collected and unwanted PKC respectively. The efficiency of separation was reduced with humidity, possibly due to the reduction of charge when the relative humidity is high [30,35,36].
Fig. 2 shows the total lignin content of collected PKC decreased as particle size increased up to <1.3 mm. This can be explained by the increase of particle electrification (eg. PKC and polyester in this case) with particle size that resulting in stronger particle-wall adhesion [36,37]. However, larger particle size could result in reduced adhesion on the surface [38]. For example, the use of PKC with higher particle size (>1.3 mm) showed reduction of separation efficiency probably because of low surface charge-to-mass ratio that reduce the static cling strength of PKC to the separator.
As shown in Fig. 3, the increased of feed rate up to 110 g/min increased the separation efficiency, but higher feed rate caused a reduction in separation efficiency. This is because the amount of PKC spread on the surface of separator was overloaded. Hence, the amount of PKC that come in contact with the surface of separator was reduced.
Fig. 1. The effect of moisture content and feed rate on total lignin of collected and unwanted PKC (particle size <1.5 mm).
Fig. 2. The effect of moisture content and particle size on total lignin of collected and unwanted PKC (feed rate 110 g/min).
Fig. 3. The effect of particle size and feed rate on total lignin of collected and unwanted PKC (moisture content 13%).
Optimization and Model Verification Performance
The amount of total lignin in collected PKC would influence the nutritive value of PKC. Therefore, the conditions of separation method evaluated were set to produce low amount of lignin in the collected PKC. Numerical RSM optimization methods were used in the study by selecting the desired goals for each independent and dependent variables.
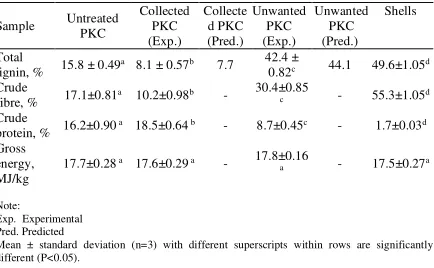
energy between the shells and the PKC. Therefore, the gross energy is not affected after removal of shells from PKC. It is anticipated that further reduction in lignin and crude fibre present in PKC could be achieved by increasing the frictional contact time, different separator materials and adjusting the speed rate.
Table 5. Chemical composition of untreated PKC, treated PKC and shells.
Sample Untreated PKC Collected PKC (Exp.) Collecte d PKC (Pred.) Unwanted PKC (Exp.) Unwanted PKC (Pred.) Shells Total
lignin, % 15.8 ± 0.49
a 8.1 ± 0.57b 7.7 42.4 ±
0.82c 44.1 49.6±1.05d
Crude
fibre, % 17.1±0.81
a 10.2±0.98b - 30.4±0.85
c - 55.3±1.05d
Crude
protein, % 16.2±0.90
a 18.5±0.64 b - 8.7±0.45c - 1.7±0.03d
Gross energy, MJ/kg
17.7±0.28 a 17.6±0.29 a - 17.8±0.16
a - 17.5±0.27a
Note: Exp. Experimental Pred. Predicted
Mean ± standard deviation (n=3) with different superscripts within rows are significantly different (P<0.05).
CONCLUSIONS
The present study demonstrated that removal of shells via static cling and electrostatic separation technique has the potential to reduce the lignin and fibre content of PKC. Under the experimental conditions conducted, the level of lignin was reduced to 8.1%, while that of crude fibre to 10.2%.
ACKNOWLEDGEMENTS
The fund granted by the Ministry of Education, Malaysia, under the Long Term Research Grant Scheme (Project number: UPM/700-1/3/LRGS) and Universiti Putra Malaysia for the facilities are acknowledged.
REFERENCES
[1] MPOB. Overview of the Malaysian oil palm industry. Malaysia: Malaysian Palm Oil Board; 2011.
[2] Jaafar DM, Hamali AY. Palm kernel cake as ruminant feed. In: Proceedings of the World Congress on Vegetable Protein Utilization in Human Foods and Animal Feedstuffs. 1989. p. 463.
[3] Umunna NN, Magaji IY, Adu IF, Njoku PC, Balogun TF, Alawa JP, et al. Utilization of palm kernel meal by sheep. J Appl Anim Res. 1994;5(1):1–11.
[4] Sundu B, Kumar A, Dingle J. Palm kernel meal in broiler diets: Effect on chicken performance and health. Worlds Poult Sci J. 2006;62(2):316–325.
[5] Panigrahi S, Powell CJ. Effects of high rates of inclusion of palm kernel meal in broiler chick diets. Anim Feed Sci Technol. 1991;34(1-2):37–47.
[6] Iyayi EA, Ogunsola O, Ijaya R. Effect of three sources of fibre and period of feeding on the performance, carcase measures, organs relative weight and meat quality in broilers. Int J Poult Sci. 2005;4(9):695–700.
[7] Bello KM, Oyawoye EO, Bogoro SE, Dass US. Available feedstuffs such as palm performance of broilers fed varying levels of palm kernel cake. Int J Poult Sci. 2011;10(4):290–4. [8] Khadijat BM, Enoch OO, Suleiman BE. Performance, carcass
characteristics and blood composition of broilers fed varying levels of palm kernel meal (Elaise guinensis) supplemented with different levels of fishmeal. Int J Poult Sci. 2012;11(1):73–7. [9] Osei SA, Amo J. Research note: palm kernel cake as a broiler
feed ingredient. Poult Sci. 1987;66(11):1870–3.
[10] Okeudo NJ, Onyike IL, Okoli CV, Chielo IL. Production performance, meat quality and feed cost implications of utilizing high levels of palm kernel cake in broiler finisher diets. Int J Poult Sci. 2006;5(12):1160–3.
[11] Siew WL. Characteristics and uses of Malaysian palm kernel cake. Palm Oil Research Institute of Malaysia, Ministry of Primary Industries; 1989.
[12] Mardhati M, Wong HK, Noraini S. Growth performance and carcass quality of broilers fed with palm kernel meal-based rations. J Trop Agric Food Sci. 2011;39(2):157–66.
[13] Cerveró JM, Skovgaard PA, Felby C, Sørensen HR, Jørgensen H. Enzymatic hydrolysis and fermentation of palm kernel press cake for production of bioethanol. Enzyme Microb Technol. 2010;46(3-4):177–84.
[14] Nwokolo EN, Bragg DB, Kitts WD. The availability of amino acids from palm kernel, soybean, cottonseed and rapeseed meal for the growing chick. Poult Sci. 1976;55(6):2300–4.
[15] Lawal TE, Lyayi EA, Adeniyi BA, Adaramoye OA. Biodegradation of palm kernel cake with multienzyme complexes from fungi and its feeding value for broilers. Int J Poult Sci. 2010;9(7):695–701.
[16] Sundu B, Kumar A, Dingle J. Comparison of feeding values of palm kernel meal and copra meal for broilers. Recent Adv Anim Nutr Aust. 2005;15:16A.
[17] Saenphoom P, Liang JB, Ho YW, Loh TC, Rosfarizan M. Effects of enzyme treated palm kernel expeller on metabolizable energy, growth performance, villus height and digesta viscosity in broiler chickens. Asian-Australas J Anim Sci. 2013;26(4):537–44.
[18] O’Mara PP, Mulligan FJ, Cronin EJ, Rath M, Caffrey PJ. The nutritive value of palm kernel meal measured in vivo and using rumen fluid and enzymatic techniques. Livest Prod Sci. 1999;60(2-3):305–16.
[19] Sinurat AP, Purwadaria T, Pasaribu T. Improving nutrient values of palm kernel cake (PKC) by reducing shell contamination and enzymes supplementation. J Ilmu Ternak Dan Vet. 2013;18(1):34–41.
[20] Higashiyama Y, Asano K. Recent progress in electrostatic separation technology. Part Sci Technol. 1998;16(1):77–90. [21] Giesfeldt JT. Process for separating fiber from dry-milled corn.
Washington, DC; 4,738,772, 1988.
[22] Delrue R, Van De Watering CG. Reduction of fibre content in fibre-containing oilseeds. European Patent Office; 1,908,355, 1988.
[23] Hemery Y, Rouau X, Dragan C, Bilici M, Beleca R, Dascalescu L. Electrostatic properties of wheat bran and its constitutive layers: Influence of particle size, composition, and moisture content. J Food Eng. 2009;93(1):114–24.
[24] Abdel-Salam M, Ahmed A, El-Kishky H. Seeds sorting by electrostatic separation: An experimental study. In 2004. p. 377– 80.
[25] Kim J-K, Cho H-C, Kim S-C, Chun H-S. Electrostatic beneficiation of fly ash using an ejector-tribocharger. J Environ Sci Health - Part ToxicHazardous Subst Environ Eng. 2000;35(3):357–77.
[26] Sakaguchi M, Makino M, Ohura T, Iwata T. Contact electrification of polymers due to electron transfer among mechano anions, mechano cations and mechano radicals. J Electrost. 2014;72(5):412–6.
[27] Ferreira SLC, Bruns RE, Ferreira HS, Matos GD, David JM, Brandão GC, et al. Box-Behnken design: An alternative for the optimization of analytical methods. Anal Chim Acta. 2007;597(2):179–86.
[28] AOAC. Official methods of analysis. 15th ed. Washington, DC, USA: Association of Official Analytical Chemists; 1990. [29] American Society for Testing and Materials (ASTM). Standard
D, ASTM D 1106-96 standard test method for acid-insoluble lignin in wood. West Conshohocken, PA: ASTM international; 2001.
[30] Diaz AF, Felix-Navarro RM. A semi-quantitative tribo-electric series for polymeric materials: The influence of chemical structure and properties. J Electrost. 2004;62(4):277–90. [31] Holme I, McIntyre JE, Shen ZJ. Electrostatic charging of
[32] Stubbs TJ, Vondrak RR, Farrell WM. Impact of dust on lunar exploration. In 2007. p. 239–43.
[33] Perumalraj R, Jayashree P, Kanimozhi J, Ramya R. Design and development of electrostatic discharge tester for textile materials. Electr Eng. 2011;40.
[34] Matsuda H, Seo D-S, Yoshida N, Fujibayashi K, Kobayashi S, Yabe Y. Estimation of the static electricity and optical retardation produced by rubbing polyimide and polyamide films with different fabrics. Mol Cryst Liq Cryst Sci Technol Sect Mol Cryst Liq Cryst. 1995;264:23–8.
[35] Nifuku M, Katoh H. A study on the static electrification of powders during pneumatic transportation and the ignition of dust cloud. Powder Technol. 2003;135-136:234–42.
[36] Lacks DJ, Mohan Sankaran R. Contact electrification of insulating materials. J Phys Appl Phys. 2011;44(45).
[37] Guardiola J, Rojo V, Ramos G. Influence of particle size, fluidization velocity and relative humidity on fluidized bed electrostatics. J Electrost. 1996;37(1-2):1–20.