Melt Flow Behavior and Thermal Properties of Palm Kernel Shell
Filled High Density Polyethylene Composites
B. Y. Lim1, 2*, C. H. Voon3 and M. C. Teh1
1School of Materials Engineering, Universiti Malaysia Perlis, Taman Muhibbah, 02600 Jejawi, Perlis,
Malaysia.
2Centre of Excellence for Frontier Materials Research, School of Materials Engineering, No 66-68, Blok B,
Taman Pertiwi Indah, Universiti Malaysia Perlis (UniMAP), 01000, Kangar, Perlis, Malaysia.
3Institute of Nano Electronic Engineering, Universiti Malaysia Perlis, 01000 Kangar, Perlis, Malaysia.
ABSTRACT
High density polyethylene (HDPE)/palm kernel shell (PKS) composites were prepared through melt mixing by incorporating different PKS loading into HDPE matrix. PKS was chemically treated with stearic acid with the aim to enhance its compatibility with HDPE. The results showed that the addition of PKS into HDPE had decreased the melt flow index (MFI) values while the increasing of temperature help to increase MFI values of composites. It was discovered that stearic acid managed to increase the MFI values of composites. This was attributed to the improved dispersion of PKS in HDPE matrix. Besides, the differential scanning calorimeter results revealed that the presence of PKS had increased the crystallinity of HDPE/PKS composites because PKS was functioned as nucleation site. Fourier Transform Infrared spectroscopy had proven the success of stearic acid treatment on PKS surface.
Keywords: High Density Polyethylene, Palm Kernel Shell, Stearic Acid.
1. INTRODUCTION
In recent years, increment of agricultural waste is one of the reasons affected ecological problems and economic factors in Malaysia. Thus many researchers and industries are actively involved in the investigation of the natural filler based composite materials [1]. The natural fiber composites are known to be low density and high specific strength, low cost and low hazardous to the operator and environment [2]. Majority of the components in biocomposites are obtained from agricultural based. Therefore, it helps to provide solution for waste disposal, minimization in agricultural residues and also decrease the environmental pollution [3].
Lignocellulosic fillers like palm kernel shell can be easily found in Malaysia, which is the top palm oil exporter country in the world after Indonesia. Malaysia produces around 52.8% of the total production of world’s palm kernel oil. Recently, PKS have been used as reinforced filler in order to replace synthetic fillers, either in thermoplastic or thermoset polymer composites due to the attractive mechanical properties, productivity and cost [4-6]. In addition, PKS fillers are the renewable sources and available in a large amount which is more eco-environment and less harmful to human as compared to the synthetic fillers [7-10].
Incorporation of natural filler with polymer may lead to incompatibility of matrix and natural fillers, so filler treatment is extensively utilized to enhance interfacial bonding between the hydrophobic polymer and the hydrophilic filler. Filler treatment are selected with the aim to improve the mechanical properties and moisture resistance of biocomposites in order to
40
Enhancement of interfacial adhesion between natural filler and polymer matrix can be done through stearic acid treatment and strongly improved the final properties of polymer composites[13]. Kiattipanich et al. studied the effect of stearic acid in polypropylene composites filled with sugarcane fiber [14]. They discovered that stearic acid had effectively enhanced the compatibility between sugarcane fiber and polypropylene. In addition, stearic acid also served as lubricant that increased the melt flow index (MFI) values of the composites.
Melt flow behavior of a material is investigated by using MFI test. MFI is the weight of the extruded polymer in grams forced out in ten minutes through a die. It is important to estimate the viscosity, melt flow rate, melt index, grading thermoplastics and indirectly the approximate average molecular weight. The MFI test (ASTM D 1238) has been extensively used in applications of plastics industry which to specify polymer processability [15-18]. By understanding the role of rheology, it helps to optimize the plastic processing and minimize the product defects. Besides melt flow behavior, thermal properties of the materials are also important in the processing of composites. Generally, the thermal properties of composites are affected with the addition of filler. In this study, HDPE/PKS composites were prepared at 10 to 40 php PKS loading by the means of Z-blade mixer. In order to investigate the effect of stearic acid, the PKS was treated with stearic acid prior to compounding. The untreated and treated HDPE/PKS composites were then subjected to MFI test and differential scanning calorimeter.
2. EXPERIMENTAL
2.1 Materials
HDPE was obtained from Lotte Chemical Titan (M) Sdn. Bhd., Pasir Gudang, Johor, Malaysia while PKS in powder form was obtained from DRPTS Manufacturing Sdn. Bhd., Melaka, Malaysia. PKS powder was subjected to sieving process and powder with particle size smaller than 75 µm was selected. After that, PKS was dried out in oven at 80 ºC for 24 hours to remove its moisture content. The stearic acid was supplied by Syarikat Saintifik Jaya, Shah Alam, Selangor, Malaysia.
2.2 Stearic Acid Treatment
The PKS was first soaked in stearic acid (3 wt % of PKS) solution with toluene and acetone. The mixture was covered with aluminum foil and left for 24 hours. After that, the precipitate was dried in oven at 60 ºC for 48 hours to remove the solvent. After drying, the treated PKS was ground and sieved again to ensure the particle size was smaller than 75 µm.
2.3 Preparation of Untreated and Treated HDPE/PKS Composites
41 Table 1. Formulation of untreated and treated HDPE/PKS composites.
Materials HDPE/PKS Untreated Treated HDPE/PKS
High Density Polyethylene (HDPE) (php) 100 100 Palm Kernel Shell (PKS) (php) 0, 10, 20, 30, 40 10, 20, 30, 40
Stearic Acid (wt %)* - 3
*3 wt % of stearic acid from weight (grams) of PKS [19] *php = part per hundred polymer
2.4 Melt Flow Index (MFI) Test
A MFI test was carried out according to ASTM D1238. The die length and diameter are 8.000 mm and 2.095 mm, respectively. The entry angle was 180º. After a residence time of 6 min, the melt was extruded through the die. The testing temperatures were varied at 180 ºC, 190 ºC, 200 ºC, and 210 ºC, with the load of 5 kg. The equation involved in determining the melt flow behavior of the composites is shown in Equation 1:
MF value seconds (1)
where
WE = weight of extruded polymer and tE = time of extruded polymer.
2.5Differential Scanning Calorimeter (DSC)
A DSC test with the model DSC-Q10 was carried out according to ASTM D 3418. The samples were weighed about 9-11 mg, and exposed to a heating rate of 10 ºC/min at temperature range of 30 ºC to 200 ºC under nitrogen flow of 50 ml/min. The degree of crystalinity, Xc was
calculated from the DSC data by using Equation 2:
c f
f p (2)
Where = heat of fusion of composite, = heat of fusion for 100% crystalline HDPE ( = 293 J/g), Wp = polymer weight fraction.
2.6 Fourier Transform Infrared Spectroscopy (FTIR)
FTIR was used to determine the functional groups present in the treated PKS powder. The model used was Perkin Elmer Spectrum 400 series FTIR. The potassium bromide (KBr) method was used. Each sample underwent four scans in the frequency range 450 - 4000 cm-1 at a
resolution of 4 cm-1.
3. RESULTS AND DISCUSSION
3.1 Melt Flow Index (MFI) Test
42
one another easily as the temperature increased thus resulted in higher MFI values. Salmah et al. [17] had discovered that the increasing MFI values of LDPE/PKS at higher temperature was due to the accelerated molecular motion, availability of greater free volume, decreased entanglement density and weaker intermolecular interaction between the filler and matrix.
Figure 1. MFI values of control HDPE and untreated HDPE/PKS composites at different filler loading.
Besides temperature, the MFI values of composites were also influenced by presence of fillers. It was noticed that the MFI values of HDPE/PKS composites reduced with increasing filler loading. The addition of PKS into HDPE matrix had hindered the flow of polymer chains and increased the viscosity of composites. Escócio et al. [20] had reported that the MFI values declined as the sponge gourd residue filler increased due to the tendency to form agglomerates during processing, which might further retard the polymer matrix flow.
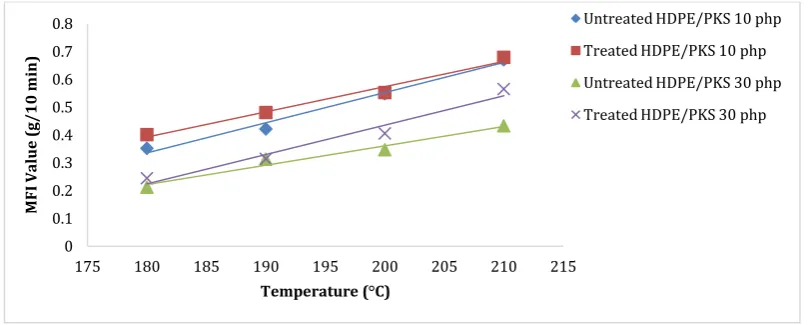
At a similar filler loading, HDPE/PKS composites with stearic acid exhibited higher MFI value compared to the composites without stearic acid as shown in Figure 2. The incorporation of stearic acid into HDPE/PKS composites decreased the viscosity of the composites and improved their flowability. The lower viscosities observed for the stearic acid treated samples was attributed to the surface coating that reduces the adhesive forces between the particles. It helped to break up the agglomerates and aids dispersion of individual particles. Hence, better molecular motion between polymer chains can be achieved. Nekkaa et al. [21] discovered that at constant broom fiber content, there was increase in the MFI value for stearic acid treated polypropylene composites and this was due to the enhanced dispersion of the fibers that reduced the formation of agglomerates.
Figure 2. MFI value versus temperature of untreated and treated HDPE/PKS composite at different filler loading. 0 0.1 0.2 0.3 0.4 0.5 0.6 0.7 0.8
175 180 185 190 195 200 205 210 215
M FI V al ue ( g/ 1 0 m in )
Temperature (°C)
Control HDPE
Untreated HDPE/PKS 10 php Untreated HDPE/PKS 20 php Untreated HDPE/PKS 30 php Untreated HDPE/PKS 40 php
0 0.1 0.2 0.3 0.4 0.5 0.6 0.7 0.8
175 180 185 190 195 200 205 210 215
M FI V al ue (g /1 0 m in)
Temperature (°C)
Untreated HDPE/PKS 10 php
Treated HDPE/PKS 10 php
Untreated HDPE/PKS 30 php
43
3.2 Differential Scanning Calorimetry (DSC) Analysis
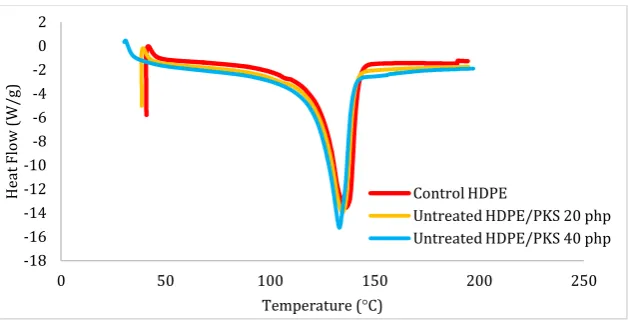
Figure 3 illustrates the DSC curve of control HDPE and untreated HDPE/PKS composites at different filler loading. The data of DSC also summarized in Table 2. From Table 2, it can be clearly seen that the addition of 20 php PKS in HDPE slightly reduced the melting temperature (Tm) of HDPE from 136.21 ºC to 134.72 ºC and it was further shifted to lower temperatures
when the amount of PKS contents was increased. This can be related to formation of voids in the HDPE/PKS composite as well as the interaction between PKS and HDPE formed immobile phase [22].
Based on Table 2, the heat of fusion is decreased steadily as the filler loading increased and this was due to the less energy needed to melt the composites. In other words, a smaller amount of the HDPE in the composites requires less heat to melt. According to Lee et al. [23], they reported as the bamboo fiber content increased, the heat fusion of the composites decreased, representing that less energy was needed to melt the composites.
According to Table 2, crystallinity of the composites was increased with the addition of PKS filler loading to a level even higher than the pure HDPE. This can be explained by nucleation activity was occurred when filler was added into the matrix. Ikhlef et al. [24] had reported that the crystallinity increased with untreated flour loading which due to cellulosic filler acts as nucleation sites which alter the kinetics of crystallization of the semi crystalline polymer.
Figure 3. DSC curves of control HDPE and untreated HDPE/PKS composites at different filler loading.
Table 2 DSC data of control HDPE and untreated HDPE/PKS composites at different filler loading
Samples Temperature (TMelting m,
ºC)
Heat Fusion (Hf, J/g)
Polymer Weight Fraction (Wp)
Crystallinit y (Xc, %)
Control HDPE 136.21 122.7 1 41.88
Untreated HDPE/PKS 20 php 134.72 117.8 0.8 50.26
Untreated HDPE/PKS 40 php 133.21 101.6 0.6 57.80
3.3 Fourier Transform Infrared (FTIR) Analysis
As shown in Figure 4, the FTIR spectra of PKS before and after treatment with stearic acid in a range of wavenumber 450 cm-1 and 4000 cm-1. A new peak at 2850 cm-1 was observed in treated
PKS and this peak indicates that the presence C-H stretching vibration mode. Hence, it was predicted to be the C-H stretching mode in the stearic acid. Fuji et al. [25] reported that FTIR spectroscopy confirms the successful of calcium carbonate filler with stearic acid treatment
-18 -16 -14 -12 -10 -8 -6 -4 -2 0 2
0 50 100 150 200 250
He
at
Flo
w
(W
/g)
Temperature (°C)
Control HDPE
44
addition of C-H bond.
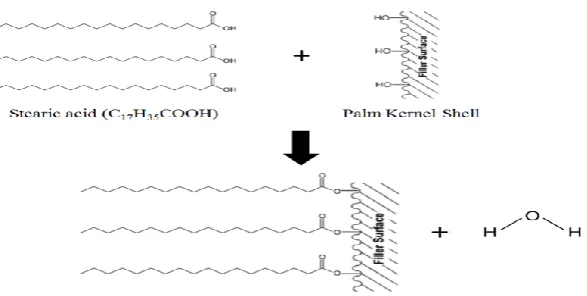
The peak at 1733 cm-1 was attributed to the carbonyl groups of PKS. After the treatment of
stearic acid, the carboxyl group from stearic acid was expected to interact with the hydroxyl group from PKS through esterification reaction, as proposed in Figure 5. However, the carbonyl groups of the PKS seem to obscure the detection on the ester link. Therefore, the intensity change of the peak at 1733 cm-1 was not obvious. On the other hand, it was noticed that the peak
at 3403 cm-1 was shifted to 3395 cm-1, indicated that the concentration of hydroxyl group from
PKS was reduced. This is evidence that the interaction between PKS and stearic acid had taken place. Other peaks were contributed by cellulose, lignin and hemicelluloses in PKS according to different functional groups and vibrations.
Figure 4. FTIR spectra of HDPE/PKS composite with and without the stearic acid treatment.
4000 3600 3200 2800 2400 2000 1800 1600 1400 1200 1000 800 600 450
cm-1
% T
Treated PKS Untreated PKS
3402.95
2924.55
2373.12 2345.41
2133.17 1869.00
1733.62
1610.33 1510.57
1457.62 1381.34 1319.22
1249.41 1165.02
1035.48 897.24
851.99 770.97
542.44
2917.98 2850.07
2371.20
2345.52 2141.83 1869.08
1733.84 1610.25
1510.28 1382.62
1319.25
1271.93
1164.86 1036.26 896.83
851.34 770.77
546.86
45 Figure 5. Schematic illustration of the reaction between stearic acid and PKS.
4. CONCLUSION
The HDPE/PKS composites were successfully prepared with different filler loading of PKS and stearic acid was selected as coupling agent. It was discovered that the rising temperature from 180 °C to 210 °C had increased the MFI values of the composite. The composites melt were capable to obtain more energy to slide past one another, thus increase its flowability. Besides, the presence of PKS in composites disturbed the melt flow behavior of composites and resulting in higher viscosity. Though the MFI values of composites declined with addition of PKS as filler, the stearic acid treatment was managed to improve the melt flow. This was attributed to the ability of stearic acid that reduced agglomeration and enhanced dispersion of PKS. On the other hand, the DSC results revealed that presence of PKS slightly reduce melting temperature and heat fusion but increased the crystallinity of HDPE/PKS composites. Lastly, the FTIR spectrum suggested bonding was formed between PKS and stearic acid as the hydroxyl groups in PKS was reduced.
ACKNOWLEDGMENTS
The authors would like to acknowledge the financial support from Fundamental Research Grant Scheme (FRGS) under a grant number of FRGS/1/2014/TK04/UNIMAP/02/6 from the Ministry of Higher Education Malaysia.
REFERENCES
[1] S. C. Koay, S. Husseinsyah & H. Osman, Bioresources 8, 3 (2013) 3260-3275.
[2] K. L. Pickering, M. G. A. Efendy & T. M. Le, Compos. Part A Appl. Sci. Manuf. 83 (2016) 98-112.
[3] M. E. Mngomezulu, M. J. John, V. Jacobs & A. S. Luyt, Carbohydr. Polym. 111 (2014) 149-182.
[4] M. A. Dato'Hasnan, S. Husseinsyah, L. B. Ying & M. F. A. Rahman, Bioresources 11, 3 (2016) 6639-6648.
[5] B. Y. Lim, S. Husseinsyah & P. L. Teh, Adv. Mater. Res. 626 (2013) 615-619.
[6] O. Nabinejad, D. Sujan, M. Rahman & I. J. Davies, Materials & Design 65 (1980-2015), 823-830.
[7] U. J. Alengaram, B. A. A. Muhit & M. Z. b. Jumaat, Constr. Build. Mater. 38 (2013) 161-172. [8] C. U. Atuanya, V. S. Aigbodion, S. O. Obiorah, M. Kchaou & R. Elleuch, Journal of the
Association of Arab Universities for Basic and Applied Sciences, (2015).
46
373.
[11] N. Ayrilmis & A. Kaymakci, Ind. Crops Prod. 43 (2013) 457-464.
[12] E. Papirer, J. Schultz & C. Turchi, Eur. Polym. J. 20, 12 (1984) 1155-1158.
[13] S. Mihajlović, Ž. Sekulić, A. Daković, D. Vučinić, V. Jovanović & J. Stojanović, Ceram. Silik. 53, 4 (2009) 268-275.
[14] N. Kiattipanich, N. Kreua-Ongarjnukool, T. Pongpayoon & C. Phalakornkule, J. Polym. Eng.
27, 6-7 (2007) 411-428.
[15] T. Bremner, A. Rudin & D. Cook, J. Appl. Polym. Sci. 41, 7-8 (1990) 1617-1627.
[16] M. Kontopoulou, Applied polymer rheology: polymeric fluids with industrial applications: John Wiley & Sons, (2011).
[17] H. Salmah, B. Lim & P. Teh, Int. J. Polymer. Mater. 61, 14 (2012) 1091-1101. [18] A. V. Shenoy, S. Chattopadhyay & V. M. Nadkarni, Rheol. Acta 22, 1 (1983) 90-101.
[19] R. Raj, B. Kokta, F. Dembele & B. Sanschagrain, J. Appl. Polym. Sci. 38, 11 (1989) 1987-1996.
[20] V. A. Escócio, E. B. A. V. Pacheco, A. L. N. da Silva, A. de Paula Cavalcante & L. L. Y. Visconte, Int. J. Polym. Sci. (2015) 7.
[21] S. Nekkaa, F. Chebira & N. Haddaoui, J. Eng. Appl. Sci. 1, 3 (2006) 278-283. [22] N. Zuhaira, A. Aziz & M. Rahmah, Adv. Mater. Res. 812 (2013) 175-180.
[23] S.-Y. Lee, S.-J. Chun, G.-H. Doh, I.-A. Kang, S. Lee & K.-H. Paik, J. Compos. Mater. 43, 15 (2009) 1639-1657.
[24] S. Ikhlef, S. Nekkaa, M. Guessoum & N. Haddaoui, ISRN Polymer Sci. (2012).