OPTIMIZATION OF MACHINING PARAMETERS IN
TURNING OF EN-31 ALLOY STEEL USING
RESPONSE SURFACE METHODOLOGY
Sonu Ram
1, Raj Kumar yadav
21
M. Tech, Mechanical engineering,
2Associate professor, SLIET Longowal, Sangrur, Punjab, (India)
ABSTRACT
In this paper a detail study was performed on the CNC lathe machine for turning of the EN-31 alloy steel.
Response surface methodology (RSM) is used for design of experiments which is based on second order face
centred central composite design (CCD). The effect of process parameters viz. Spindle speed, feed rate and
depth of cut on the surface roughness and material removal rate is carried out and optimize the response
variables (for maximum material removal rate and minimum surface roughness). In present era the requirement
of industries it may be micro, small and medium is mainly concerned with high quality products with minimum
cost is desirable. So turning is the basic starting process for any product which came from casting, forging,
extrusion and drawing process for remove the undesirable material in high quantity without compromising the
quality of the product (Basic function) for which the product mainly design for intended purpose. In turning
process the tool is moved parallel to the work piece axes or in linear direction and work piece is held fixed in
the jaw of chuck and rotate together with the rotation of spindle which is attach to the chuck. The big challenge
for any industry in India is to produce high quality products in large quantity with the same resources and
within the time limit. So this is possible with the help of CNC machine which is desirable for automation and to
achieve high accuracy, flexibility and saving of time and include lower production cost with increased
productivity without compromising with quality of the product.
Keywords:
CNC lathe, EN-31 alloy steel, Material removal rate, Response surface methodology
(RSM), Surface roughness, Turning operation.
I. INTRODUCTION
For present thesis work EN-31 high carbon alloy steel is used as a material and CNC turning as a process for
study. Design of experiments is done using the response surface methodology which is based on face centered
second order central composite design (CCD). In the past many researcher made attempt the study on optimising
process parameters for increasing tool life, minimum cutting forces, power with different coolant and different
tools. Also the work is done on manual Lathe machine. Researchers mainly used the Taguchi method for design
of experiments and grey relational analysis for optimization. But this research paper is mainly focused on dry
study the effect of spindle speed, feed rate, and depth of cut on the surface roughness and material removal rate
(MRR) using TIN (chemical vapour deposition) coated carbide insert of korloy make is used. In this study,
Response surface methodology is used to develop mathematical modelling and ANOVA is used to check the
significance of the develop model and also to verify the effect of process parameters whether it is significant or
not. Optimization has been attempted for surface roughness and material removal rate for combination of
process parameters spindle speed, feed rate and depth of cut. All experimental data analysis and plot is done
using the design of expert software. Prediction of optimization value is done by the mathematical model using
design of expert software and after that the selected combination of process parameters for optimization is used
to perform set of confirmation runs. The difference between predicted and actual value is below the 5% or under
the 95% confidence interval which is desirable. So the present thesis work result is useful for the industry it will
show that material removal rate and surface finish can be predicted with the help of developed model and the
predicted values are near to the actual values.
II. LITERATURE REVIEW
Ravinder Tonk, Jasbir Singh Ratol (2012) Investigated the effects of the parametric variations in turning
process of En31 alloy steel. Taguchi's robust design methodology has been used for statistical planning of the
experiments. Experiments were conducted on conventional lathe machine in a completely random manner to
minimize the effect of noise factors present while turning EN31 under different experimental conditions. The
analysis of results shows that input parameter setting of cutting tool as carbide, cutting condition as dry, spindle
speed at 230 rpm, feed at 0.25mm/rev and depth of cut at 0.3 mm has given the optimum results for the thrust
force and input parameter setting of cutting tool as HSS, cutting fluid as soluble oil, spindle speed at 230 rpm,
feed at 0.25 mm/rev and depth of cut at 0.3 mm have been given the optimum results for the feed force when
EN31 was turned on lathe.
Jitendra J. Thakkar et. al (2014) Study optimizes the process parameters for surface roughness and Material
Removal Rate (MRR) in turning of SS 410 round bars on CNC machine. The experimentation was carried out
with PVD-coated (WNMG) cutting tools; the multi response optimization problems i.e. Optimization of SR and
MRR are solved by using Genetic Algorithm (GA). The optimization is done using twenty seven experimental
runs based on L’27 orthogonal array.Feed rate is found the most significant effect on surface roughness.
Increase in feed rate, value of surface roughness is increase. Increase in cutting speed, value of surface
roughness is decrease. Increase in depth of cut value of surface roughness is increase .The percentage
contribution of cutting speed is 12.01 %, feed of 78.45 % and depth of cut of 2.04 % on surface roughness for
straight turning operation. Feed and Depth of cut are found the most significant effect on material removal rate.
Increase in feed and depth of cut, value of material removal rate is increase.The percentage contribution of
cutting speed is 14.67 %, feed of 18.14 % and depth of cut of 58.57 % on material removal rate for turning
operation.
Richard Geo, Jose Sheril D’cotha (2014) Studied the effect of machining parameters (cutting speed, feed rate,
considered in this experimental work are HSS and tungsten carbide tool. Comparison of power consumed by the
tools was done. The power consumed by both tools is measured by measuring the forces acting on the cutting
tool using a lathe tool dynamometer with a digital display for measuring the forces acting on three axes. From
the model it was found that cutting speed is the most important factor that influences power consumed by the
tool and feed rate has less influence. From the comparison of the tools it was found that during turning of EN-
24 steel rod with both tools the HSS tool consumes more power than the carbide tool.
Poornima, Sukumar (2012) Study involves in identifying the optimized parameters in CNC turning of
martensitic stainless steel. The optimization techniques used in this study are Response surface methodology,
and Genetic algorithm. The results obtained from RSM are R-Sq obtained was 99.9% which indicates that
selected parameters (speed, feed, depth of cut) significantly affect the response (surface roughness). The Best
ranges obtained by using the genetic algorithm approach are Cutting velocity (speed) -119.93 m/min, Feed-0.15
m/min and Depth of cut -0.5mm. Hence the Optimal surface roughness from GA is 0.74 microns.
S.R. Das et. al (2012) Study on optimization method of the cutting parameters (cutting speed, depth of cut and
feed) in dry turning of AISI D2 steel to achieve minimum tool wear and low work piece surface temperature.
The experimental layout was designed based on the Taguchi’s L9 (34) Orthogonal array technique and analysis
of variance (ANOVA) was performed to identify the effect of the cutting parameters on the response variables.
The results showed that depth of cut and cutting speed are the most important parameter influencing the tool
wear. The minimum tool wear was found at cutting speed of 150 m/min, depth of cut of 0.5 mm and feed of
0.25 mm/rev. Similarly low work piece surface temperature was obtained at cutting speed of 150 m/min, depth
of cut of 0.5 mm and feed of 0.25 mm/rev.
III. OBJECTIVES
The main objectives of this paper are:-
To find out the effect of process parameters viz. spindle speed, feed rate, and depth of cut on the
surface roughness and material removal rate.
To develope the mathematical model for surface roughness and material removal rate for predicting the
value of responses.
To find out which process parameters are more significant and which is less significant to affect the
material removal rate and surface roughness.
To identify the non significant parameters which are to be removed from the mathematical model.
Optimize the process parameters for minimum surface roughness and maximum material removal rate.
To find out the combination of process parameters which is used to optimize the responses with the
help of predicted value from the model and by performing confirmation run on same combination if
error is less than 5% then optimization is confirmed because in this paper 95% confidence interval is
IV. RESEARCH METHODOLOGY
In this research paper for design of experiment Response surface methodology has been used for design the
matrix to perform the experimental work. Response surface methodology (RSM) is a combination of various
mathematical and statistical techniques in which modelling and analysis of problem is done. It is useful in the
problems where response of the problem is directly influenced by the different variables in same manner or
different manner. So there are three important terms related to response surface methodology which completely
define its purpose to where it used in the problems for design of experiments. First the input parameters (x1, x2,
...) which are also called variables, second output or response (Y) of the experiment which is depend on the input
parameters. So the input parameters are independent and response is dependent on the input parameters. Third is
the error (e) which is occurred during the measurement of response.
Y = f(x1, x2, ...) + e
Disadvantage of first order model is that it is not used when the response surface having curvature effect. So that
in present research paper second order model is used.
So the function with 3 variables having second order model is:
Y = β0 + β1X1 + β2X2 + β3X3 + β11X2 + β22X2 + β33X2 + β12 X1 X2 + β13 X1 X3 + β23 X2 X3+ ε
RSM is used to:-
To determine the factor levels that will simultaneously satisfy a set of desired specifications,
To determine the optimum combination of factors that yields a desired response and describes the
response near the optimum,
To determine how a specific response is affected by changes in the level of the factors over the
Specified levels of interest,
When response surface topography is studied like local minimum, ridge lines, local maximum etc.
Find the region in response surface where the optimal solution occurs. The aim is to get a maximum or
minimum response along a path with quick and efficient move so that response is optimized.
There are many designs available for fitting a second order model but in this research paper central composite
design (CCD) is used. Face centred composite design having subdivided into three parts i) factorial points (2k) ii) star points (2k) iii) centre points (n), where k is the number of input parameters or variables. So for this thesis
work 3 variables spindle speed, feed rate and depth of cut is chosen.
Variables Factorial points
(2k)
Star points
(2k)
Centre points
(n)
Total number of
experiment
(N)
Value of α
3 8 6 6 20 1.0
4.1 DESIGN OF EXPERIMENTS AND DATA ANALYSIS
FACTORS UNIT TYPE LEVEL
1
LEVEL
2
LEVEL
3
Spindle speed(N)
Feed rate (F)
Depth of cut (D)
RPM
mm/rev
mm
Numeric
Numeric
Numeric
1000
0.10
0.1
1500
0.15
0.2
2000
0.20
0.3
Table 4.2: Observed value for performance characteristics
4.2 RESULTS
4.2.1 MATHEMATICAL MODEL
Std. order Run order Factor A Factor B Factor C Response 1 Response 2
Spindle
speed
(N)
(RPM)
Feed rate
(F)
(mm/rev)
Depth of cut
(D)
(mm)
Surface
roughness
(Ra)
(µm)
Material removal
rate
(MRR)
(mm3/sec)
6 1 2000 0.1 0.3 0.84 63.10
14 2 1500 0.15 0.3 0.97 80.13
11 3 1500 0.1 0.2 0.81 19.72
9 4 1000 0.15 0.2 1.23 29.59
7 5 1000 0.2 0.3 1.42 38.46
16 6 1500 0.15 0.2 0.86 48.08
3 7 1000 0.2 0.1 1.3 14.25
13 8 1500 0.15 0.1 0.79 32.05
2 9 2000 0.1 0.1 0.67 12.82
1 10 1000 0.1 0.1 1.15 6.75
18 11 1500 0.15 0.2 0.9 64.10
15 12 1500 0.15 0.2 0.86 32.05
4 13 2000 0.2 0.1 0.73 25.64
5 14 1000 0.1 0.3 1.22 12.82
17 15 1500 0.15 0.2 0.85 16.03
10 16 2000 0.15 0.2 0.72 64.10
8 17 2000 0.2 0.3 0.85 64.10
20 18 1500 0.15 0.2 0.85 48.08
12 19 1500 0.2 0.2 0.92 42.74
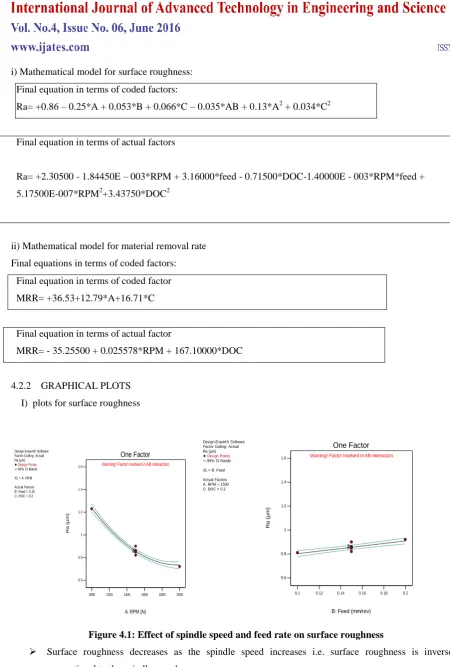
i) Mathematical model for surface roughness:
Final equation in terms of coded factors:
Ra= +0.86 – 0.25*A + 0.053*B + 0.066*C – 0.035*AB + 0.13*A2 + 0.034*C2
Final equation in terms of actual factors
Ra= +2.30500 - 1.84450E – 003*RPM + 3.16000*feed - 0.71500*DOC-1.40000E - 003*RPM*feed +
5.17500E-007*RPM2+3.43750*DOC2
ii) Mathematical model for material removal rate
Final equations in terms of coded factors:
Final equation in terms of coded factor
MRR= +36.53+12.79*A+16.71*C
Final equation in terms of actual factor
MRR= - 35.25500 + 0.025578*RPM + 167.10000*DOC
4.2.2 GRAPHICAL PLOTS
I) plots for surface roughness
Design-Expert® Software Factor Coding: Actual Ra (µm)
Design Points
95% CI Bands
X1 = A: RPM
Actual Factors B: Feed = 0.15 C: DOC = 0.2
A: RPM (N)
1000 1200 1400 1600 1800 2000
R
a
(
µ
m
)
0.6 0.8 1 1.2 1.4
1.6 Warning! Factor involved in AB interaction.
22
One Factor
Design-Expert® Software Factor Coding: Actual Ra (µm)
Design Points
95% CI Bands X1 = B: Feed Actual Factors A: RPM = 1500 C: DOC = 0.2
B: Feed (mm/rev)
0.1 0.12 0.14 0.16 0.18 0.2
R
a
(
µ
m
)
0.6 0.8 1 1.2 1.4
1.6 Warning! Factor involved in AB interaction.
2 2 One Factor
Figure 4.1: Effect of spindle speed and feed rate on surface roughness
Surface roughness decreases as the spindle speed increases i.e. surface roughness is inversely
proportional to the spindle speed.
Surface roughness increases as the value of feed rate increase i.e. surface roughness is directly
proportional to feed rate.
Design-Expert® Software Factor Coding: Actual Ra (µm)
Design Points 95% CI Bands
X1 = C: DOC
Actual Factors A: RPM = 1500 B: Feed = 0.15
C: DOC (mm)
0.1 0.15 0.2 0.25 0.3
R a ( µ m ) 0.6 0.8 1 1.2 1.4 1.6 22 One Factor Design-Expert® Software Factor Coding: Actual Ra (µm)
Design Points
1.42
0.67
X1 = A: RPM X2 = B: Feed Actual Factor C: DOC = 0.2
1000 1200 1400 1600 1800 2000 0.1
0.12 0.14 0.16 0.18
0.2 Ra (µm)
A: RPM (N)
B : F e e d ( m m /r e v ) 0.8 0.9 1 1.1 1.2 6
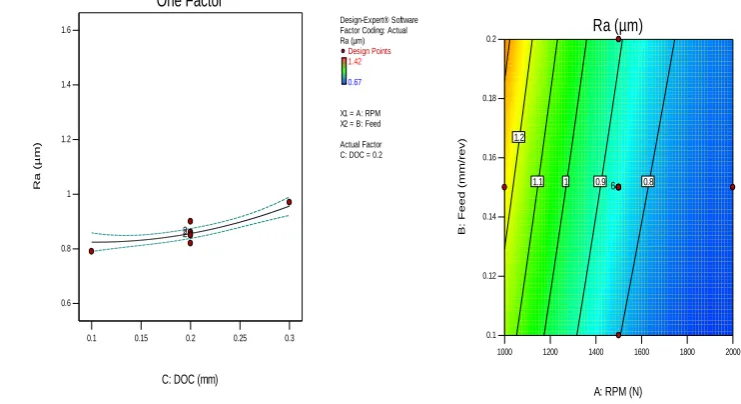
Figure 4.2: Effect of depth of cut on surface roughness and contour plot for surface roughness
Surface roughness increases as the value of depth of cut is increases.
Design-Expert® Software Factor Coding: Actual Ra (µm)
Design points above predicted value
Design points below predicted value
1.42
0.67
X1 = A: RPM X2 = B: Feed Actual Factor C: DOC = 0.2
0.1 0.12 0.14 0.16 0.18 0.2 1000 1200 1400 1600 1800 2000 0.6 0.8 1 1.2 1.4 1.6 Ra (µ m )
A: RPM (N) B: Feed (mm/rev)
Design-Expert® Software Factor Coding: Actual MRR (mm^3/sec)
Design Points 95% CI Bands
X1 = A: RPM
Actual Factors B: Feed = 0.15 C: DOC = 0.2
A: RPM (N)
1000 1200 1400 1600 1800 2000
M R R ( m m ^ 3 /s e c ) 0 20 40 60 80 100 2 2 One Factor Design-Expert® Software Factor Coding: Actual MRR (mm^3/sec)
Design Points
95% CI Bands X1 = C: DOC Actual Factors A: RPM = 1500 B: Feed = 0.15
C: DOC (mm)
0.1 0.15 0.2 0.25 0.3
M R R ( m m ^ 3 /s e c ) 0 20 40 60 80 100 2 2 One Factor
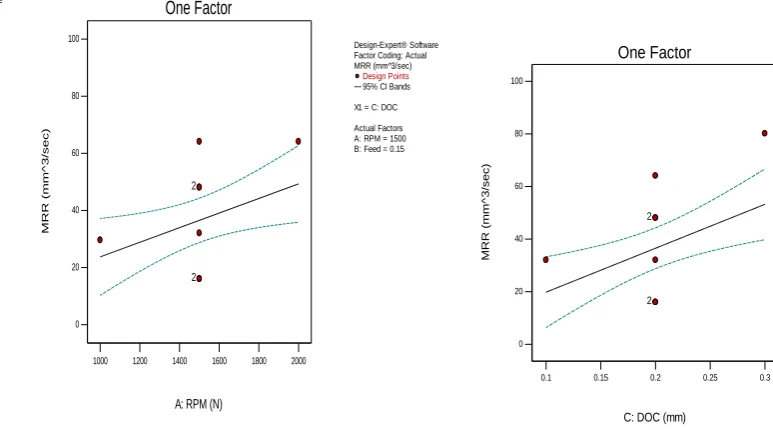
Figure 4.4: Effect of spindle speed and depth of cut on material removal rate
Material removal rate is increases as the value of spindle speed and depth of cut is increases.
Feed rate has insignificant effect on material removal rate.
Design-Expert® Software Factor Coding: Actual MRR (mm^3/sec)
Design Points
80.13
6.75
X1 = A: RPM X2 = C: DOC Actual Factor B: Feed = 0.15
1000 1200 1400 1600 1800 2000 0.1
0.15 0.2 0.25
0.3 MRR (mm^3/sec)
A: RPM (N)
C : D O C ( m m ) 10 20 30 40 50 60 6 Design-Expert® Software Factor Coding: Actual MRR (mm^3/sec)
Design points above predicted value
Design points below predicted value
80.13
6.75
X1 = A: RPM X2 = B: Feed Actual Factor C: DOC = 0.2
0.1 0.12 0.14 0.16 0.18 0.2 1000 1200 1400 1600 1800 2000 -20 0 20 40 60 80 100 M R R ( m m ^ 3 /s e c )
A: RPM (N) B: Feed (mm/rev)
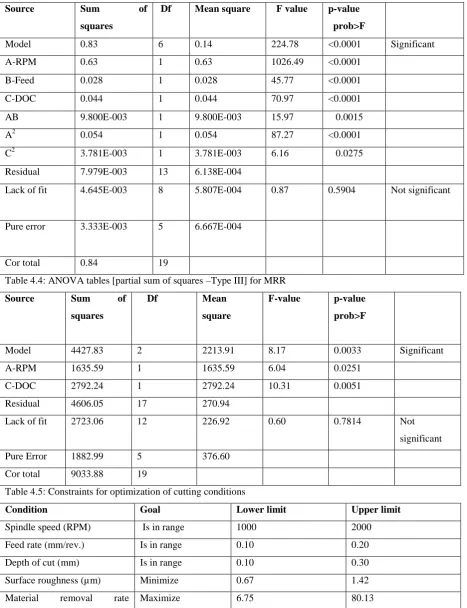
Table 4.3: ANOVA tables [partial sum of squares –Type III] for surface roughness
Source Sum of
squares
Df Mean square F value p-value
prob>F
Model 0.83 6 0.14 224.78 <0.0001 Significant
A-RPM 0.63 1 0.63 1026.49 <0.0001
B-Feed 0.028 1 0.028 45.77 <0.0001
C-DOC 0.044 1 0.044 70.97 <0.0001
AB 9.800E-003 1 9.800E-003 15.97 0.0015
A2 0.054 1 0.054 87.27 <0.0001
C2 3.781E-003 1 3.781E-003 6.16 0.0275
Residual 7.979E-003 13 6.138E-004
Lack of fit 4.645E-003 8 5.807E-004 0.87 0.5904 Not significant
Pure error 3.333E-003 5 6.667E-004
Cor total 0.84 19
Table 4.4: ANOVA tables [partial sum of squares –Type III] for MRR
Source Sum of
squares
Df Mean
square
F-value p-value
prob>F
Model 4427.83 2 2213.91 8.17 0.0033 Significant
A-RPM 1635.59 1 1635.59 6.04 0.0251
C-DOC 2792.24 1 2792.24 10.31 0.0051
Residual 4606.05 17 270.94
Lack of fit 2723.06 12 226.92 0.60 0.7814 Not
significant
Pure Error 1882.99 5 376.60
Cor total 9033.88 19
Table 4.5: Constraints for optimization of cutting conditions
Condition Goal Lower limit Upper limit
Spindle speed (RPM) Is in range 1000 2000
Feed rate (mm/rev.) Is in range 0.10 0.20
Depth of cut (mm) Is in range 0.10 0.30
Surface roughness (µm) Minimize 0.67 1.42
Material removal rate
(mm3/sec)
Table 4.6: Predicted value for optimization of responses
sr. no. Spindle
speed
(RPM)
Feed rate
(mm/rev)
Depth of cut
(mm)
Surface
roughness
(µm)
Material
removal rate
(mm3/sec)
Remarks
1. 2000 0.10 0.3 0.817 66.03 Selected
*desirability 0.806
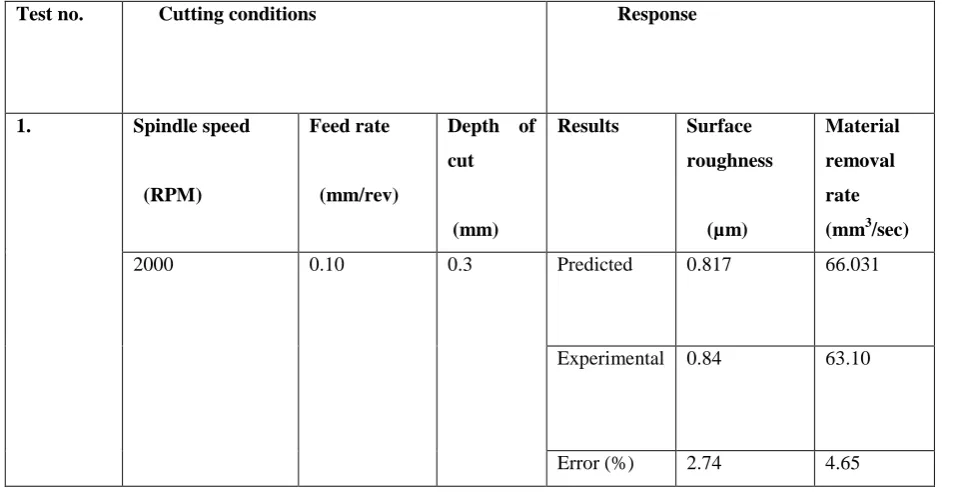
Table 4.7: Plan of confirmation experiments and optimization results
Test no. Cutting conditions Response
1. Spindle speed
(RPM)
Feed rate
(mm/rev)
Depth of
cut
(mm)
Results Surface
roughness
(µm)
Material
removal
rate
(mm3/sec)
2000 0.10 0.3 Predicted 0.817 66.031
Experimental 0.84 63.10
Error (%) 2.74 4.65
V. CONCLUSIONS AND FUTURE SCOPE OF WORK
A three level three numeric factors response surface methodology based on face centered central composite
design technique has been used for the development of mathematical models to predict the surface roughness
and material removal rate.
The important conclusions drawn from the present work has been summarized as follows:-
1. SURFACE ROUGHNESS
Surface roughness increases as the cutting speed decreases and surface roughness decreases as the
cutting speed increases.
Surface roughness increases as the level of feed rate increases i.e. surface roughness is proportional to
the feed rate.
Surface roughness decreases as the depth of cut decreases or vice versa.
In concerned with the surface roughness spindle speed seems to be the most significant and influential
parameter followed by depth of cut. The feed rate has the least effect on the surface roughness.
Material removal rate is increased with the increment of spindle speed and depth of cut and vice
versa.
Out of three process parameters depth of cut seems to be the most significant and influential
parameter followed by spindle speed.
The feed rate has insignificant influence on the material removal rate.
3. The results of ANOVA and the confirmation runs verify that the developed mathematical model for surface
roughness and material removal rate show excellent fit and provide predicted values of surface roughness and
material removal rate that are close to the experimental values, with a 95% confidence level.
4. The percentage error between the predicted and experimental values of the response factor during the
confirmation experiments are within 5 percent.
5. The developed mathematical model can be used for direct evaluation or surface roughness and material
removal rate under various combinations of machining parameters during the turning process.
6. The optimal sets of process parameters have been obtained for various performance measures using response
surface methodology (RSM) based on face centered central composite design of experiment methodology. The
summary results of predicted optimal values of the responses and their confidence intervals (both for
confirmation experiment and prediction) are given as under:
Test no. Cutting conditions Response
1. Spindle speed
(RPM)
Feed rate
(mm/rev)
Depth of
cut
(mm)
Results Surface
roughness
(µm)
Material
removal
rate
(mm3/sec)
2000 0.10 0.3 Predicted 0.817 66.031
Experimental 0.84 63.10
Error (%) 2.74 4.65
5.1 Future scope of work
Although the CNC turning has been thoroughly investigated for EN-31 alloy steel work piece, still there is a
scope for further investigation. This paves a way for following future work:
To study the effect of cutting fluids and tool geometry on the surface roughness and material removal
rate.
To analyze the effect of these three input parameters on response chip - tool interface temperature.
In this study, mathematical modelling and optimization has been attempted only for surface roughness
tool interface temperature, machining time, tool wear, different coolant, nose radius and tool geometry
etc.
In the present work Ra value (arithmetic average of absolute values) have been measured for surface
roughness. However Rt (maximum height of profile) can also be considered for measuring surface
roughness in case of die steels.
REFERENCES
1) Tonk, R., and Ratol, J. S. (2012). Investigation of the Effects of the Parametric Variations in Turning
Process of En31 Alloy. International Journal on Emerging Technologies, 3(1), 160-164.
2) Borse, S. C. (2014). Optimization of Turning Process Parameter In Dry Turning of Sae52100 Steel.
International Journal of Mechanical Engineering and Technology (IJMET), ISSN, 0976-6340.
3) Bala Raju, J., Leela Krishna, J., and Tejomurthy, P. (2013). Effect and Optimization of Machining
Parameters on Cutting Force and Surface Finish in Turning of Mild Steel and Aluminum. International
Journal of Research in Engineering and Technology, 2(11).
4) Basil K Mathew Paul, Tina Raju, Dr. Biju B.(2014). Optimization of Cutting Parameters in Hard Turning
of AISI 4340 Steel. International Journal of Innovative Research in Advanced Engineering (IJIRAE)
ISSN: 2349-2163 Volume 1 Issue 8.
5) Jitendra J. Thakkar Mitesh I. Patel Viral B. Prajapati Sachin Patel.(2014). Optimization of Process
Parameters For Surface Roughness And Material Removal Rate For Ss410 Material During Turning
Operation. International Journal for Scientific Research & Development| Vol. 2, Issue 03, 2014 | ISSN
(online): 2321-0613.
6) Mahdavinejad, R. A., and Bidgoli, H. S. (2009). Optimization of surface roughness parameters in dry
turning. Journal of achievements in materials and manufacturing engineering, 37(2), 571-577.
7) Ganesh, N., Kumar, M. U., Kumar, C. V., and Kumar, B. S. (2014). Optimization of Cutting Parameters
in Turning of EN 8 Steel Using Response Surface Method and Genetic Algorithm. International Journal
of Mechanical Engineering and Robotics Research, 3(2), 75.
8) Richard Geo, Jose Sheril D’cotha.(2014). Effect of Turning Parameters on Power Consumption in EN 24
Alloy Steel using Different Cutting Tools. International Journal of Engineering Research and General
Science Volume 2, Issue 6, October-November, 2014, ISSN 2091-2730.
9) Poornima, Sukumar.(2012). OPTIMIZATION OF MACHINING PARAMETERS IN CNC TURNING
OF MARTENSITIC STAINLESS STEEL USING RSM AND GA. International Journal of Modern
Engineering Research. Vol.2, Issue.2, Mar.-Apr. 2012 pp-539-542 ISSN: 2249-6645.
10) Sharda R. Nayse, M. G. Rathi.(2014). Optimization of Turning Parameters Using Taguchi Method.
International Journal Of Modern Engineering Research (IJMER). Vol. 4 | Iss.11 ISSN: 2249–6645.
11) Das, S. R., Nayak, R. P., and Dhupal, D. (2012). Optimization of Cutting Parameters On Tool Wear And
Workpiece Surface Temperature In Turning Of Aisi D2 Steel. International journal of lean thinking, 3(2),
12) Saini, A., Dhiman, S., Sharma, R., and Setia, S. (2014). Experimental estimation and optimization of
process parameters under minimum quantity lubrication and dry turning of AISI-4340 with different
carbide inserts. Journal of Mechanical Science and Technology, 28(6), 2307-2318.
13) Dhar, N. R., Kamruzzaman, M., and Ahmed, M. (2006). Effect of minimum quantity lubrication (MQL)
on tool wear and surface roughness in turning AISI-4340 steel. Journal of materials processing
technology, 172(2), 299-304.
14) Varadarajan, A. S., Philip, P. K., and Ramamoorthy, B. (2002). Investigations on hard turning with
minimal cutting fluid application (HTMF) and its comparison with dry and wet turning. International
Journal of Machine Tools and Manufacture, 42(2), 193-200.
15) Sharma, P., and Bhambri, K. (2012). Multi-response optimization by experimental investigation of
machining parameters in CNC turning by Taguchi based grey relational analysis. Int. J. Eng. Res. Appl,
2, 1594-1602.
16) Singh, J., Singh, H., and Dhindsa, G. S. (2016). Optimization of Machining Parameters during CNC
turning of Aluminium 6061 with CNMG EN-TM (H20TI) insert using Response Surface Methodology
(RSM).
17) N. Sathiya Narayanan, M. Ganesan, V. Prem Kumar, P. Vijayakumar, N. Baskar.(2014). Constrained
machining parameter optimization of EN8 steel using taguchi approach, International Journal of
Innovative research in technology, Volume 1 Issue 11 | ISSN: 2349-6002.
18) Richard Geo, Jose Sheril D’cotha.(2014). Effect of Turning Parameters on Power Consumption in EN 24
Alloy Steel using Different Cutting Tools, International Journal of Engineering Research and General
Science Volume 2, Issue 6, October-November, 2014 ,ISSN 2091-2730.
19) SUNIL P. MAGHODIYA, PROF. JAYESH V. DESAI.(2015). Effect of Machining Parameters on
Surface Roughness in Hard Turning Process, International Journal for Research in Education, Vol. 4,
Issue:2, February : 2015 (IJRE) ISSN: (P) 2347-5412 ISSN: (O) 2320-091X.
20) Pawar, K., and Palhade, R. D. (2015). Multi-objective Optimization of CNC Turning Process Parameters
for High Speed Steel (M2) Using Taguchi and ANOVA Method. International Journal of Hybrid