University of Pennsylvania
ScholarlyCommons
Publicly Accessible Penn Dissertations
Fall 12-21-2011
Optimal Control of Mobile Malware Epidemics
MHR. Khouzani
University of Pennsylvania, [email protected]
Follow this and additional works at:
http://repository.upenn.edu/edissertations
This paper is posted at ScholarlyCommons.http://repository.upenn.edu/edissertations/444 For more information, please [email protected].
Recommended Citation
Optimal Control of Mobile Malware Epidemics
Abstract
Malware attacks constitute a serious security risk that threatens our ever-expanding wireless networks.
Developing reliable security measures against outbreaks of malware facilitate the proliferation of wireless
technologies.
The first step towardthis goal is to investigate potential attack strategies and the extent of damage they can
incur. Given the flexibility that software-based operation provides, it is reasonable to expect that new malware
will not demonstrate a fixed behavior over time. Instead, malware can dynamically change the parameters of
their infective hosts in response to the dynamics of the network, in order to maximize their overall damage.
We first considerpropagation of malware in a battery-constrained mobile wirelessnetwork by an epidemic
model in which the worm can dynamicallycontrol the transmission ranges and/or the media scanning rates of
the infective nodes. The malware at each infective node may seek to contact more susceptible nodes by
amplifying the transmission range andthe media scanning rate and thereby accelerate its spread. Thismay
however lead to (a)~easier detection of the malware and thus moreeffective counter-measure by the network,
and (b)~faster depletion of the battery which may in turn thwart further spread of the infection and/or
exploitation of that node. We prove, using Pontryagin Maximum Principle from optimal control theory, that
the maximum damage in this case can be attained using simple three-phase strategies: in the first phase,
infective nodesuse maximum transmission ranges and media access rates to amass infective nodes.In the next
phase, infective nodes reduce their access attempts and enter a stealth-mode to preserve their battery and hide
from detection. In the last phase, they once again use maximum transmission attempts with largest rates but
this time the primary effect is killing the infective nodes by draining their batteries.
In an alternative attack scenario, we consider the case in which the malware can control the rate of killing the
infective nodes as an independent parameter of control. At each moment of time the worm at each node faces
the following decisions: (i)~choosing the transmission ranges and media scanning rates so as to maximize the
spread of infection subject to not exhausting its batteries by the end of the operation interval; and
(ii)~whether to kill the node to inflict a large cost on the network, however at the expense of losing the chance
of infecting more susceptible nodes at later times. We establish structural properties of the optimal strategy of
theattacker over time.Specifically, we prove that it is optimal forthe attacker to defer killing of the infective
nodes in the propagation phase until reaching a certain time and then start theslaughter with maximum effort.
We also show that in the optimalattack policy, the battery resources are used according to a decreasing
function of time, i.e., most aggressively during the initial phaseof the outbreak.
Upon detection of a malware outbreak, the network manager can counter the propagation of the malware by
reducing the communication rates of the nodes and patching. We in turn investigate the optimal defense
policies of rate reduction and patching.
The distribution of patches consumes bandwidth which is specially scarce in wireless networks, and must
therefore be judiciously controlled in order to attain desired trade-offs between security risks and bandwidth
consumption. We consider both
non-replicative
and
replicative
dissemination of patches:a pre-determined set
of dispatcher nodes distribute the patches in the former, whereas the dispatcher set continually grows in the
latter as the nodes that receive the patch become dispatchers themselves. In each case, the desired trade-offs
can be attained by activating at any given time only fractions of dispatchers and selecting their packet
transmission rates. We formulate the above trade-offs as optimal control problems that seek to minimize the
aggregate network costs that depend on security risks and the overall extra energy and bandwidth used in the
network for dissemination of the security patches. We prove that the dynamic control strategies have simple
structures: when the cost function associated with the energy/bandwidth consumed in patching is concave,
the control strategies are bang-bang with at most one jump from the maximum to the minimum value, i.e.,
maximum patching rates until a certain threshold and then stop. When the cost function is strictly convex, the
above transition is strict but continuous. We compare the efficacy of different dispatch models and also those
of the optimum dynamic and static controls using numerical computations.
Next, we consider the case in which both malware and network can dynamically vary their parameters over
time in response to the changes of the state of the system and also to each other's controls.The infinite
dimension of freedom introduced by variation over time and antagonistic and strategic optimization of
malware and network against each other demand new attempts for modeling and analysis. We develop a
zero-sum dynamic game model and investigate the structural properties of the saddle-point strategies. We
specifically show that saddle-point strategies are still simple threshold-based policies and hence, a robust
dynamic defense is practicable. Finally, we develop a unified mathematical framework for calculating optimal
controls of systems governed by epidemic evolution using Pontryagin’s Maximum Principle, and we
demonstrate how it can be applied to contexts beyond network security. Specifically, we show how our
framework can be specialized for marketing, dissemination of messages in DTN or p2p networks, health-care,
etc. This dissertation in part demonstrates how using simple real analysis arguments, one can extract
substantial information about the structure of optimal policies for nonlinear systems in the absence a
closed-form solution.
Degree Type
Dissertation
Degree Name
Doctor of Philosophy (PhD)
Graduate Group
Electrical & Systems Engineering
First Advisor
Saswati Sarkar
Keywords
OPTIMAL CONTROL OF MOBILE MALWARE EPIDEMICS
MHR. Khouzani
A DISSERTATION
in
Electrical and Systems Engineering
Presented to the Faculties of the University of Pennsylvania
in
Partial Fulfillment of the Requirements for the
Degree of Doctor of Philosophy
2011
Saswati Sarkar
Supervisor of Dissertation
Roch Gu´erin
Graduate Group Chairperson
D
ISSERTATIONC
OMMITTEERoch Gu´erin, Professor, ESE, UPenn
Ali Jadbabaie, Professor, ESE, UPenn
Dedication
I dedicate this work to all the people who have the courage to be unselfish.
Acknowledgments
This piece of work could not have come into existence without the continuous support of my
advisor, Professor Saswati Sarkar. I immensely value her unremitting guidance and her sound
advice, which are imprinted throughout this work. I will be indefinitely indebted to her – even if
only for the fact that she graciously tried to foster in me the skill of critical thinking and analytical
integrity.
I would like to also thank my dissertation committee: Professor Jadbabaie, Professor Guerin,
Professor Javidi and Professor Bas¸ar for their support and their insightful guidance. Special
thanks to Professor Eitan Altman as he sparked the direction that became this thesis, and
intelec-tually encouraged me throughout the journey.
I wish to express my most heartfelt appreciation to my parents, Effat and Jaffar, and my
ABSTRACT
OPTIMAL CONTROL OF MOBILE MALWARE EPIDEMICS
MHR. Khouzani
Saswati Sarkar, Advisor
Malware attacks constitute a serious security risk that threatens our ever-expanding wireless
networks. Developing reliable security measures against outbreaks of malware facilitate the
pro-liferation of wireless technologies. The first step toward this goal is to investigate potential attack
strategies and the extent of damage they can incur. Given the flexibility that software-based
oper-ation provides, it is reasonable to expect that new malware will not demonstrate a fixed behavior
over time. Instead, malware can dynamically change the parameters of their infective hosts in
response to the dynamics of the network, in order to maximize their overall damage.
We first consider propagation of malware in a battery-constrained mobile wireless network by
an epidemic model in which the worm can dynamically control the transmission ranges and/or
the media scanning rates of the infective nodes. The malware at each infective node may seek
to contact more susceptible nodes by amplifying the transmission range and the media
scan-ning rate and thereby accelerate its spread. This may however lead to (a) easier detection of the
malware and thus more effective counter-measure by the network, and (b) faster depletion of the
battery which may in turn thwart further spread of the infection and/or exploitation of that node.
We prove, using Pontryagin Maximum Principle from optimal control theory, that the maximum
damage in this case can be attained using simple three-phase strategies: in the first phase,
infec-tive nodes use maximum transmission ranges and media access rates to amass infecinfec-tive nodes.
In the next phase, infective nodes reduce their access attempts and enter a stealth-mode to
pre-serve their battery and hide from detection. In the last phase, they once again use maximum
nodes by draining their batteries.
In an alternative attack scenario, we consider the case in which the malware can control the
rate of killing the infective nodes as an independent parameter of control. At each moment of
time the worm at each node faces the following decisions: (i) choosing the transmission ranges
and media scanning rates so as to maximize the spread of infection subject to not exhausting its
batteries by the end of the operation interval; and (ii) whether to kill the node to inflict a large
cost on the network, however at the expense of losing the chance of infecting more susceptible
nodes at later times. We establish structural properties of the optimal strategy of the attacker
over time. Specifically, we prove that it is optimal for the attacker to defer killing of the infective
nodes in the propagation phase until reaching a certain time and then start the slaughter with
maximum effort. We also show that in the optimal attack policy, the battery resources are used
according to a decreasing function of time, i.e., most aggressively during the initial phase of the
outbreak.
Upon detection of a malware outbreak, the network manager can counter the propagation
of the malware by reducing the communication rates of the nodes and patching. We in turn
investigate the optimal defense policies of rate reduction and patching.
We introduce quarantining the malware by reducing the reception gain of nodes as a defense
mechanism. In applying this counter-measure we confront a trade-off: reducing the
commu-nication range suppresses the spread of the malware, however, it also deteriorates the network
performance by introducing delay. Using Pontryagin’s Maximum Principle, we derive structural
characteristics of the optimal communication range as a function of time for a wide class of cost
functions. In both of the defense controls, our numerical computations reveal that the dynamic
optimal controls significantly outperforms static choices and is also robust to errors in estimation
of the network and attack parameters.
The distribution of patches consumes bandwidth which is specially scarce in wireless
security risks and bandwidth consumption. We consider bothnon-replicativeandreplicative
dis-semination of patches: a pre-determined set of dispatcher nodes distribute the patches in the
for-mer, whereas the dispatcher set continually grows in the latter as the nodes that receive the patch
become dispatchers themselves. In each case, the desired trade-offs can be attained by activating
at any given time only fractions of dispatchers and selecting their packet transmission rates. We
formulate the above trade-offs as optimal control problems that seek to minimize the aggregate
network costs that depend on security risks and the overall extra energy and bandwidth used
in the network for dissemination of the security patches. We prove that the dynamic control
strategies have simple structures: when the cost function associated with the energy/bandwidth
consumed in patching is concave, the control strategies are bang-bang with at most one jump
from the maximum to the minimum value, i.e., maximum patching rates until a certain
thresh-old and then stop. When the cost function is strictly convex, the above transition is strict but
continuous. We compare the efficacy of different dispatch models and also those of the optimum
dynamic and static controls using numerical computations.
Next, we consider the case in which both malware and network can dynamically vary their
parameters over time in response to the changes of the state of the system and also to each other’s
controls. The infinite dimension of freedom introduced by variation over time and antagonistic
and strategic optimization of malware and network against each other demand new attempts for
modeling and analysis. We develop a zero-sum dynamic game model and investigate the
struc-tural properties of the saddle-point strategies. We specifically show that saddle-point strategies
are still simple threshold-based policies and hence, a robust dynamic defense is practicable.
Finally, we develop a unified mathematical framework for calculating optimal controls of
sys-tems governed by epidemic evolution using Pontryagin’s Maximum Principle, and we
demon-strate how it can be applied to contexts beyond network security. Specifically, we show how
our framework can be specialized for marketing, dissemination of messages in DTN or p2p
arguments, one can extract substantial information about the structure of optimal policies for
Contents
1 Overview 1
1.1 Motivation . . . 1
1.2 System state evolution . . . 3
1.3 Decision problems of the attackers . . . 4
1.4 Decision problems of the defense . . . 5
1.5 Summary of the contributions . . . 7
1.5.1 Formulation of maximum damage attack . . . 7
1.5.2 Formulation of the maximum efficacy countermeasure . . . 9
1.5.3 Dynamic game of defense v.s. attack . . . 10
1.5.4 A unified framework and further applications . . . 11
1.6 Related literature . . . 11
2 Notations and Assumptions 16
I
Attack
21
3 Battery Depletion Attack 22 3.1 System model . . . 233.1.2 Maximum damage battery depletion attack . . . 26
3.2 Malware’s optimal control . . . 28
3.3 Structural properties of optimumu(t) . . . 30
3.4 Numerical computations . . . 35
4 Seek and Destroy Attack 40 4.1 System model . . . 41
4.1.1 Dynamics of state evolution . . . 41
4.1.2 Maximum damage seek and destroy attack . . . 43
4.2 Worm’s optimal control . . . 47
4.3 Structure of the maximum damage attack . . . 52
4.4 Proofs of Theorems 4.3.1 and 4.3.2 . . . 55
4.4.1 Proof of Theorem 4.3.1: optimal rate of killing . . . 57
4.4.2 Proof of Theorem 4.3.2: optimal scanning rate/Tx range . . . 60
4.5 Numerical computations . . . 62
II
Defense
70
5 Rate Reduction 71 5.1 System model . . . 725.2 Optimal reception gain control . . . 77
5.3 Structural results . . . 80
5.3.1 Concaveh(u): . . . 80
5.3.2 Strictly convexh(u): . . . 85
5.4 Distribution of patches through the underlying network . . . 88
5.5 Implementation and practical issues . . . 90
6 Patching 99
6.1 System model . . . 101
6.1.1 Non-replicative dispatch . . . 101
6.1.2 Replicative dispatch . . . 106
6.1.3 Remarks . . . 108
6.2 Optimal non-replicative dispatch . . . 108
6.2.1 Numerical framework . . . 109
6.2.2 Structure of an optimal non-replicative dispatch . . . 110
6.3 Optimal replicative dispatch . . . 115
6.3.1 Numerical famework . . . 115
6.3.2 Structure of optimal replicative dispatch . . . 116
6.4 Implementation and practical issues . . . 123
6.5 Numerical computations . . . 125
III
Game
133
7.1 System model . . . 1377.2 Network-malware dynamic game . . . 140
7.2.1 Formulation . . . 140
7.2.2 A framework for computation of the saddle-point strategies . . . 143
7.2.3 Structural properties of saddle-point defense strategy . . . 145
7.2.4 Structure of the saddle-point attack strategy . . . 149
7.3 Performance evaluation . . . 151
IV
Generalization and Applications
156
8.1 Introduction . . . 1578.2.1 Dynamics of non-replicative dispatch . . . 160
8.2.2 Dynamics of replicative dispatch . . . 162
8.2.3 Motivation of the models and instantiation . . . 165
8.2.4 The objective function . . . 165
8.3 Optimal non-replicative dispatch . . . 168
8.3.1 Structure of the optimal non-replicative dispatch . . . 169
8.3.2 Proof of lemma 8.3.2 . . . 172
8.4 Optimal replicative dispatch . . . 175
8.4.1 Structure of the optimal replicative dispatch . . . 175
8.4.2 Proof of lemma 8.4.2 . . . 177
9 Summary and Future Research 180
A Model Verification 184
List of Tables
2.1 List of notations of measures. . . 17
List of Figures
3.1 State transitions:S, I, R, Drespectively represent susceptible, infective, recovered,
dead states. Here,u(t)is product of the transmission range and media scanning
rate of infectives at time t.The parameters β, ρand functionsB(·), Q(·) will be
defined in Section 3.1.1. . . 26
3.2 Optimal controls and the corresponding levels of infection for differentβ, I0, π.In
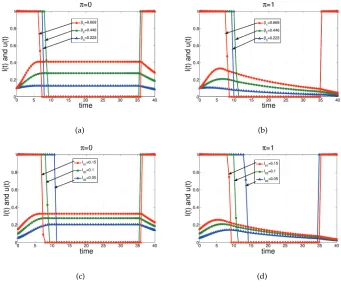
figs (a) and (b),I0 = 0.1, and in figs (b), (c),β = 0.446. In each, the plots that are
always below0.4representI(·). In figs (a), (b) ((c), (d), resp.) the higher infection
levels are for the largerβ’s (I0’s, resp.). . . 37
3.3 Optimal controls and the corresponding levels of infection for different β, π for
strictly convexQ, B.Here,I0= 0.1. The plots that are always below0.4represent
I(·).The higher infection levels are for the largerβ’s. . . 37
3.4 Comparison of the damages for optimal dynamic and static policies for different
β, π.HereI0= 0.1. . . 38
3.5 Comparison of the damages for optimal dynamic and static policies for different
I0, π. Hereβ= 0.446. . . 38
3.6 Reduction in the aggregate damage due to incorrect estimations of network
pa-rameters by the malware. The real values of the papa-rameters areI0= 0.1,β = 0.446,
4.1 Transitions.S, I, R, Drespectively represent fraction of the susceptible, infective,
recovered and dead.u(t)andν(t)are the control parameters of the malware. . . . 43
4.2 Evaluation of the optimal controllers and the according states as functions of time. Here, h(u) = u2, β = 0.9, umax = 1,γ = 0.2, andπ = 0in left andπ = 1 in right. Thus βumax = 0.9 > 0.4 ≥ (γ+πγ). Therefore, the fast-healing regime does not hold. However, as we can see, the pattern for optimaluis consistent with statement of by theorem 4.3.2 and strictly convexh(u). . . 63
4.3 Jump points of optimalν(starting time of the slaughter period) versusγfor both π= 0andπ= 1.Note that forπ= 1and forγ ≥0.30,malware starts killing the infectives from time zero. . . 64
4.4 The optimalu(media scanning rate times the transmission rates of infectives) for different values ofγfor bothπ= 0(left) andπ= 1(right). . . 64
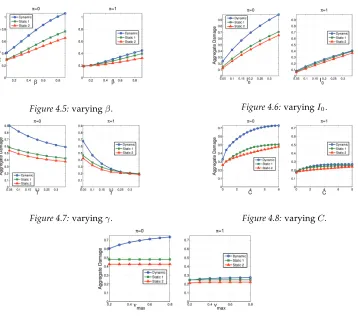
4.5 varyingβ. . . 66
4.6 varyingI0. . . 66
4.7 varyingγ. . . 66
4.8 varyingC. . . 66
4.9 varyingνmax. . . 66
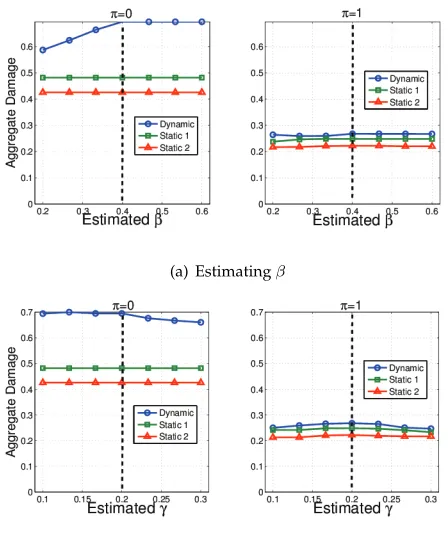
4.11 Robustness of the dynamic attack strategy with respect to clock drifts. . . 68
4.12 System cost (malware’s damage + the cost of patching) versusγ(rate of patching). 69 4.13 System cost (malware’s damage + the cost of quarantining) versusβ. . . 69
5.1 u(t)is the reception gain of the susceptible nodes at timet. . . 76
5.3 Optimal u,varying β. Here, I0 = 0.1, K = 50, and other parameters are as in
fig. 5.2. . . 93
5.4 Optimal u,varying γ. Here, I0 = 0.1, K = 50, and other parameters are as in
fig. 5.2. . . 94
5.5 Optimal u,varying C. Here, I0 = 0.1, K = 50, and other parameters are as in
fig. 5.2. . . 95
5.6 An optimal uwith two jumps. Here, h(u) = 1−u, umin = 0.1, γ = 0.22, β =
0.4, I0= 0.05, R0= 0, C= 0.8andK= 60. . . 96
5.7 Cost comparison: optimum dynamic versus the static policies. The parameters are
T = 25,umax= 1,umin= 0.1γ= 0.2,I0= 0.2,C= 5K= 50andh(u) = 1−u. . . 97
5.8 Comparison of the costs achieved by our dynamic optimal control and a heuristic
control that uses (noisy) local state information. . . 97
5.9 The first two figures respectively demonstrate the robustness with respect toβand
I0respectively forh(u) = 1−u. The last two figures demonstrate robustness with
respect to quantization in the control forh(u) = (1−u)1.5.In the last figure, the
x-axis represents the number of levels available foru, and the control is rounded
to the level closest to the optimal value, e.g.,x= 2means the output is rounded to
uminand1. The other parameters for all the figures areβ = 0.5,I0 = 0.2,R0 = 0,
γ= 0.2,umin≈0,umax= 1,C= 10,T= 20. . . 98
6.1 The top figures represent the optimal controls and the bottom figures the
corre-sponding system states as functions of time for non-replicative dispatch with
con-caveh(.). Here,f(I) = 10I2,g(D) = 20D2, T = 100, β0 = β1 = 0.2,δ = 0.005,
6.2 The optimal control and the corresponding system states as functions of time for
non-replicative dispatch. The parameters are the same as in fig. 6.1, except that
h(ϑ) = 10(R0ϑ)2,hence a strictly convex function. Also, Left:π= 0,Right:π= 1. 109
6.3 The jump point of the bang-bang optimum control for replicative and non-replicative
dispatch. Here, f(I) = 10I2, g(D) = 20D2, h(x) = K
ux, and T = 100, δ =
0.005, β0=β1=β. . . 118
6.4 (Continuation of) the jump point of the bang-bang optimum control for replicative and non-replicative dispatch. Refer to fig. 6.3 for the paramers of choice. . . 119
6.5 (Continuation of) the jump point of the bang-bang optimum control for replicative and non-replicative dispatch. Refer to fig. 6.3 for the paramers of choice. . . 120
6.6 varyingβ.Here,R0= 0.1, Ku= 10,δ= 0.005andI0= 0.1.. . . 129
6.7 varyingR0.Here,β = 0.20, Ku= 10, δ= 0.005andI0= 0.1 . . . 129
6.8 varyingKu.Here,β= 0.20, R0= 0.1,δ= 0.005andI0= 0.1 . . . 129
6.9 varyingI0.Here,β = 0.20, R0= 0.1, δ= 0.005andKu= 10. . . 130
6.10 varyingδ.Here,β= 0.20, R0= 0.1, Ku= 10,I0= 0.1. . . 130
6.12 Robustness of the patching with respect to clock drift. The increase in the overall cost is less than15%. . . 132
7.13 State transitions. uNi(t)anduNr(t)are the control parameters of the network whileuM(t)is the control parameter of the malware. . . 139
7.14 State evolution and saddle-point strategies. The parameters of the game are as follows:κI = 10, κD = 13, κu = 10, κr= 5, KI =KD = 0, β2 =β1=β0 = 4.47, π= 1, and initial fractionsI0= 0.15, R0= 0.1, D0= 0,andT = 4. . . 151
7.18 Comparison of the maximum damage for the best static choice of defense parameters and dynamic saddle-point
defense strategies. . . 155 8.19 State transitions for non-replicative case. The only difference in the replicative
case is that transition rates fromStoRis at rateβ1εuRSand fromI toRat rate πβ1εuRIinstead. . . 162
A.1 The top two figures compare the simulated (averaged over 100 runs) and the
calcu-lated (from the epidemic model) state trajectories for a network ofN = 500nodes,
and the bottom two figures compare the simulated and calculated damages for
dif-ferent values ofN. The inter-contact times are exponentially distributed. In all the
figures the dashed and the solid lines respectively represent the calculated values
and the simulation results. The error-bars represent the standard deviations. The
dashed and solid lines mostly overlap, and the deviations diminish asNincreases. 190
A.2 Comparison of the simulated (averaged over 100 runs) damages and calculated
(from the epidemic model) damages under power-law distributed inter-contact
times for different value ofI0. . . 191
A.3 Simulated and calculated trajectories of the states for a network of41nodes with
exponential inter-contact times. The solid lines represent the trajectories obtained
from the epidemic model (calculated trajectories), and the dashed lines are the
averages of the trajectories over100simulation runs. . . 192
A.4 Comparison of the simulated and calculated costs for a network of41nodes with
exponentially distributed inter-contact times. The solid lines represent the cost
derived from the epidemic model (calculated cost), and the dashed lines are the
A.5 Simulated and calculated trajectories of the states for a network of400nodes with
exponential inter-contact times. The solid lines represent the trajectories obtained
from the epidemic model (calculated trajectories), and the dashed lines are the
averages of the trajectories over100simulation runs. . . 194
A.6 Comparison of the simulated and calculated costs for a network of400nodes with
exponentially distributed inter-contact times. The solid lines represent the cost
derived from the epidemic model (calculated cost), and the dashed lines are the
averages over100simulation runs for different values ofI0. . . 195
A.7 Simulated and calculated trajectories (i.e., sample paths) of the states for a network
of41nodes with truncated power-law inter-contact times. The solid lines represent
the trajectories obtained from the epidemic model (calculated trajectories), and the
dashed lines are the averages of the trajectories over100simulation runs. . . 195
A.8 Comparison of the simulated and calculated costs for a network with power-law
distributed inter-contact times. The solid lines represent the cost derived from the
epidemic model (calculated cost), and the dashed lines are the averages over100
simulation runs. . . 196
A.9 Robustness of the saddle-point strategy with respect to clock drift. The increase in the overall cost is less than9%. . 196
A.10 Optional caption for list of figures . . . 197
Chapter 1
Overview
1.1
Motivation
Malicious self-replicating codes, known as malware, pose substantial threat to the wireless
com-puting infrastructure. Malware can be used to launch attacks that vary from the less intrusive
confidentiality or privacy attacks, such as traffic analysis and eavesdropping, to the more
intru-sive methods that either disrupt the nodes normal functions such as those in relaying data and
establishing end-to-end routes (e.g., sinkhole attacks [37]), or even alter the network traffic and
hence destroy the integrity of the information, such as unauthorized access and session
hijack-ing attacks [82], [32]. Malware outbreaks like those of Slammer [54] and Code Red [88] worms
in wired Internet have already inflicted expenses of billions of dollars in repair after the viruses
rapidly infected thousands of hosts within few hours. New investments have increasingly been
directed toward wireless infrastructure thanks to the rapid growth of consumer demands and
advancements in wireless technologies. The economic viability of these investments is, however,
contingent on the design of effective security countermeasures.
The first step in devising efficient countermeasures is to anticipate malware hazards, and
the above, specific attacks such as the wormhole [34], sinkhole [37], and Sybil [22], that utilize
vulnerabilities in the routing protocols in a wireless sensor network, and their counter-measures,
have been investigated before they were actually launched. The first questions addressed in this
dissertation are (i) quantifying fundamental limits on the damages that the attackers can inflict
by intelligently choosing their actions, and (ii) identifying the optimal actions that inflict the
max-imum damage on the network. Such quantification is motivated by the fact that while attackers
can pose serious threats by exploiting the fundamental limitations of wireless network, such as
limited energy, unreliable communication, constant changes in topology owing to mobility [80],
their capabilities may well be limited by the above as well since they rely on the same network
for propagating the malware.
Our next step is to characterize maximum efficacy defense, attained by intelligent and
dy-namic choice of counter-measure parameters such as immunization rates and reception gains of
nodes that are yet to be infected. This is motivated by the fact that the choice of counter-measure
parameters is constrained by the inherent resource limitations in the network. We also seek to
identify the optimal counter-measures that maximally limit the damage imposed by the attacker.
The answers in both cases depend on the network parameters such as communication ranges of
the nodes, mobility parameters, and also the counter-measure parameters such as the rates of
updates of security patches, etc.
Given the flexibility that software-based operation provides, it is reasonable to expect that
new malware will not demonstrate a fixed behavior over time. Instead, malware can
dynami-cally change its modus operandi in response to the dynamics of the network, in order to
maxi-mize the overall damage it inflicts. However, in return, the network can also dynamically change
its counter-measure policy to more effectively oppose the spread of the infection. The infinite
dimension of freedom introduced by variation over time and antagonistic optimization of
mal-ware and network against each other demand new attempts for modeling and analysis of their
damage dynamic strategies of attack and devises robust dynamic defense.
1.2
System state evolution
Worms spread during data or control message transmission from nodes that are infected (
infec-tives) and those that are vulnerable, but not yet infected (susceptibles). We consider a pernicious
worm that may (i) eavesdrop, (ii) analyze, (iii) alter or destroy traffic and (iv) disrupt the infective
host’s normal functions (such as relaying data or establishing routes), and evenkillthe host, that
is, render it completely dysfunctional (dead). This killing process may be triggered by performing
a code which inflicts irretrievable hardware damage. For instance, Chernobyl virus [57] could
re-flash the BIOS, corrupting the bootstrap program required to initialize the system. The worm can
determine the time to kill, or equivalently the rate of killing the hosts, by regulating the rate at
which it triggers such codes.
Counter-measures can be launched by installing security patches that eitherimmunize
sus-ceptible nodes against future attacks, by rectifying their underlying vulnerability, orhealthe
in-fectives of the infection and render them robust against future attacks. For instance, for
SQL-Slammer worms [54], while StackGuard programs [17] immunize the susceptibles by removing
the buffer overflow vulnerability that the worms exploit, specialized security patches [71] are
required to remove the worm from (and thereby heal) the infectives. Nodes that have been
im-munized or healed are denoted as recovered. Thus, depending on whether the worm kills the
infective before it fetches a security-patch, the state of an infective changes to dead or recovered.
States of susceptible nodes change to infective or recovered depending on whether they
com-municate with infectives before installing the security-patches. Note that the counter-measures
incur costs, since the patches must be obtained through the bandwidth-limited wireless media
involving energy-expensive communications, and different patches potentially incur different
must be resorted to, selectively and judiciously.
1.3
Decision problems of the attackers
The goal of the attacker is to infect as many nodes as possible, and use the worms to disrupt
the hosts as well as the network functions, while being cognizant of the countermeasures [81].
We consider two different attack settings in Chapters 3 and 4, which we respectively refer to as
battery depletionandseek and destroyattacks.
In the battery depletion attack setting, the malware decides the rate at which an infective
node accesses the media in search of new susceptible nodes. At any given time, the infectives
can accelerate the rate of spread of the worm by increasing their contact rates with susceptibles
by selecting higher transmission gains and media scanning rates. Such a choice however
de-pletes their energy reserves which are limited as those of any other nodes in wireless networks.
Depending on whether the malware drains an infective’s battery before the node fetches the
secu-rity patch, its state changes to dead or recovered. Killing an infective host by draining its battery
sooner rather than later disrupts its functions and thereby inflicts damage on the network right
away, but also prevents it from propagating the infection in the network and performing its other
baleful activities such as eavesdropping, traffic destruction,etc. Deferral of killing, on the other
hand, may allow the host to be healed of the infection before it can be killed, or infect other hosts.
Moreover, the elevated media access rate and battery usage might also expose the malware to
anomaly detection tools and hence lead to higher overall recovery rates. Recognizing all these
inter-twined trade-offs, it is therefore interesting to determine the instantaneous rate of media
access rates that maximizes the aggregate damage inflicted by the worm.
In the seek and destroy attack setting, similar to the battery depletion attack, the malware
can use an infective node as long as is battery is not completely drained. However, the malware
whenever it wishes by invoking specific codes that inflicts irretrievable hardware or software
damage in the node and make it completely dysfunctional. In the battery depletion model,
mal-ware could only deplete the battery to impair an infective node, which is more benign compared
to the seek and destroy attack where the malware can permanently extirpate the node. Thus in
the seek and destroy attack, the malware selects the transmission gains and media access rates
so that the battery reserves last during the period of the infection in order to utilize the infective
nodes and exterminate them as an independent decision with time. We consider the transmission
range of the infective nodes and the rate of killing as distinct dynamic control functions of the
worm which arejointlyoptimized in order to inflict the maximum damage.
1.4
Decision problems of the defense
The counter-measure focuses on the containment of infection in a mobile wireless network.
Sev-eral wireless properties enhance the severity of the infection. However, these unique features
can also be utilized to contrive new counter-measures against the spread of the infection. An
infected node can transmit its infection to another node only if they are in communication range
of each other. We propose to quarantine an infection by regulating the communication range of
the nodes. Specifically, the reception gain of the healthy nodes can be reduced to abate the
fre-quency of contacts between the mobile nodes and thus suppress the spread of the infection. This
is achieved, however, at an expense: reducing the communication range of nodes can deteriorate
the QoS offered by the network, as the overall badwidth decreases and end-to-end
communica-tion delays increase. The defense needs to choose the recepcommunica-tion gain of the nodes (that is, for the
nodes whose reception gains the defense can control - the ones that are yet to be infected) so as
to optimize the trade-off between QoS and damage due to infection.
The susceptible nodes can be immunized and infectives can be healed through installation of
the network. Hence, the propagation and dispatching of a security patch, if not carefully
con-trolled, can become a menace itself which threatens to deteriorate the function of the network
by taxing the limited transmission and processing resources such as spectrum and energy. An
example of such a predicament in wired networks was experienced in the case of the outbreak
of Welchia [14, 62]. Welchia, a variant of Blaster worm itself, was designed as a counter-worm to
defeat Blaster, but its uncontrolled propagation proved even more disruptive in terms of
crash-ing and slowcrash-ing systems. This threat is but more dire in a wireless settcrash-ing since due to media
being common and the channels being unreliable, the bandwidth can be a more restrictive
con-straint. Also, mobile nodes are limited in their energy resources. An important decision problem
of the counter-measure is to decide the rate at which such security patches should be
propa-gated in the system. We consider two different settings for dispatching and distribution of the
security patches in a mobile wireless network. In the first model, a number of mobile (or
sta-tionary) agents pre-loaded with the security patch deliver the security patch upon a contact with
a functioning node which has not received the security patch yet. In the second scenario, the
receptors of the security patch themselves propagate the security patch by forwarding it to other
susceptible or infective nodes. We respectively refer to these two models asnon-replicativeand
replicativepatchings. The decision of the defense policy is that at each given time, what portion
of the dispatchers are activated, and at which rates they should transmit the security patches,
without knowing the instantaneous state of the system. Activation of more of such nodes and
increase of their rates of transmission accelerate the spread of the security patch, however, at the
expense of consuming more of the underlying resources of the mobile wireless network such as
1.5
Summary of the contributions
1.5.1
Formulation of maximum damage attack
In part I, we hold the perspective of an attacker, assuming the defense parameters are fixed over
time. For both battery depletion(Chapter 3) and seek and destroy(Chapter 4) attack settings, we
develop mathematical frameworks which cogently model the effect of the decisions of the
at-tackers on the state dynamics and their resulting trade-offs through a combination of epidemic
models and damage functions. Specifically, we assume that the damage inflicted by the worm is
a cumulative function increasing in the number of infected and dead hosts, both of which change
with time. The worm seeks to maximize the damage subject to satisfying certain constraints on
the energy and power consumption of its hosts by dynamically selecting its control parameters
while assuming full knowledge of the network parameters and the counter-measures. The
max-imum value of the damage function then quantifies the fundamental limits on the efficacy of the
worm, particularly, since we assume that the worm has complete knowledge of all the
contribut-ing factors, and uses optimal dynamic strategies. The damage maximization problem is cast as
optimal control problems which can be solved numerically by applying Pontryagin’s Maximum
Principle [24, 47, 63].
Second, we answer the natural next question of whether in practice the worm can indeed
in-flict the damage quantified above, or the above quantifications constitute only theoretical upper
bounds. Specifically, if the optimal policies that inflict the above maximum damage are complex
to execute, then the worm may not be able to execute them since they are limited by the
capabil-ities of their resource constrained hosts as well. Towards this end, we investigate structures of
the optimum policies for the worms. Our results have negative connotations from the
counter-measures point of view since we show that an attacker can inflict the maximum damage by using
very simple decisions. In the battery depletion attack setting, we establish (§3.3) that the malware
ceases its media access activities altogether and enters an energy-saving mode while furtively
performing its malicious activities If the malware seeks also to increase the final tally of the dead
nodes, then a finalslaughterphase follows the initialblitzand intermediatestealthphases. In the
final slaughter phase, the malware resumes, at the maximum power, the media access activities
of the infected nodes, seeking primarily to kill them by depleting their residual energy reserves.
In the optimal control terminology [24, 47, 63], we have shown that the optimal strategy has a
bang-bangstructure, that is, at any given time, the battery usage is either at its minimum or
max-imum possible values, and has at most two jump which necessarily culminates at the maxmax-imum
possible value.
In the seek and destroy setting, we prove (§4.3) that the optimal killing rate has the following
simple structure: until a certain time (which can be zero depending on the network and
counter-measure parameters), the worm does not kill any host, and right after that, it annihilates its hosts
at the maximum possible rate until the end of the optimization period. Thus the optimal killing
rate is bang-bang but with at most one jump, which culminates at the maximum value. We also
prove that when the energy consumption costs are strictly convex the worm’s optimal energy
consumption rate is a decreasing function of time. Thus, the worm seeks to infect as many hosts
as possible early on by selecting the maximum possible values of the media scanning rates and
transmission ranges, and thereafter starts to behave more conservatively so as to satisfy the
en-ergy consumption constraints. When the enen-ergy consumption costs are concave, the structure
is even more specific: the optimal media scanning rates and transmission ranges are not only
decreasing functions of time, but also have a bang-bang nature with at most one jump from the
maximum possible value to the minimum possible value. Therefore, the joint optimal controls
delineate two phases to the optimal attack, the first phase is toamassthe infectives and then
ar-rives theslaughtertime. The result carries a qualitative cautionary message for countermeasures
as well: an apparently inoffensive malware with little disruptive behavior might well be stacking
1.5.2
Formulation of the maximum efficacy countermeasure
In part II, we adopt the viewpoint of the network and assuming the attack parameters do not
vary over time, we formulate defense decisions based on deterministic epidemic modeling. We
propose an optimal control framework to characterize the trade-off between the containment
efficacy, and communication capabilities of the nodes by reducing the reception gain of the
sus-ceptibles (Chapter 5) and the extra resources used for patching (Chapter 6).
For both of the defense mechanisms, we investigate whether the optimal policies that inflict
the minimum cost are complex to execute, which could turn them impractical to implement in
reality. Our results are promising: we show that minimum overall cost is achieved by executing
very simple strategies. In reception gain reduction, the optimal policy in general can be divided
into three time phases: the first phase (which depending on the parameters of the system can
have length zero) is less intense reception gain reduction. This is followed by a potentially
sec-ond phase during which the rate reduction is extreme. In the last phase, which extends till the
end of the optimization period, the reception gain is increased to normal. The transitions
be-tween these phases are abrupt for concave QoS costs, and is smooth for strictly convex QoS costs.
In patching, in both non-replicative and replicative models, we prove that optimal policies have
simple structures: for a concave bandwidth consumption cost, activate all dispatchers and choose
the maximum possible transmission rate for them until a certain time; subsequently all
dispatch-ers must be de-activated until the end of the network operation period. We have therefore shown
that the optimal control isbang-bangwith at most one jump that terminates at the minimum
pos-sible value. The optimal control has a similar structure for a convex bandwidth consumption
cost, except that its transition from the maximum to minimum values is (strict but) continuous
1.5.3
Dynamic game of defense v.s. attack
When both defense and attack can strategically change their parameters of control with time,
we have a dynamic game setting. Then arobustcounter-measure is one that seeks to minimize
the damage inflicted by the malware assuming that the malware chooses its strategy so as to
maximize this damage with full knowledge of the counter-measure. Due to the aforementioned
trade-offs and since an optimal strategy of the malware depends on the strategy of the network
andvice versa,determination of robust strategies for either is non-trivial. In part III, we propose
a method to answer these questions. First, we construct a mathematical framework which
co-gently models the strategic confrontations between the malware and the network as a zero-sum
dynamic game (§7.1). We then prove the existence of therobust(i.e.,saddle-point) strategies of
the network and the malware (§7.1), and compute them (§7.2.2). Existence of such strategies and
also their computations are not clear a priori, since the strategy set of each player is uncountably
infinite and consists of functions of time and the model is nonlinear.
We prove that the robust defense strategy has a simple two-phased structure (§7.2.3): (i) patch
at the maximum possible rate until a threshold time, and then stop patching (ii) choose the
min-imum possible reception rate (i.e., the maxmin-imum packet drop rate at the receivers) until a
thresh-old time and subsequently revert to the normal reception rate. The initial aggressive defense
limits the spread of infection and thereby the pool of nodes that can potentially be compromised
or killed; this guarantees an upper bound on the damage inflicted irrespective of the malware’s
choice of annihilation strategy. Given its simple structure, the defense control can readily be
im-plemented in resource constrained wireless devices. From a game-theoretical point of view, the
structural results are somewhat surprising given the non-linear dynamics of state evolutions and
the non-monotonicity of the state functions, and their proofs rely on non-standard techniques.
Our numerical computations reveal that our robust dynamic defense strategy attains
for heuristic static choice of defense parameters. Our dynamic strategies are shown robust to
parameter estimation and clock drifts.
1.5.4
A unified framework and further applications
Epidemic models based on nonlinear differential equations have been extensively applied in
a variety of systems as diverse as infectious outbreaks, marketing, diffusion of beliefs, etc., to
the dissemination of messages in DTN or p2p networks. In part IV, we investigate whether
our optimal control framework and structural results can be applied to setting beyond network
security. In this regard, we motivate various instantiations of the model in contexts of DTN
routing, marketing and health-care. We develop a unified optimal control framework based on
a nonlinear deterministic epidemic model and generalized costs to capture the system dynamics
and optimization objective in the above contexts. We establish that our structural results extend
to the generalized formulation as well.
1.6
Related literature
Epidemic modeling based on the classic Kermack-Mckendrick model [18] has extensively been
used to analyze the spread of malware in wired networks [15, 42–45, 65, 70, 79, 88, 89], etc, and
more recently in wireless networks [16, 51, 72–75]. These works show, through simulations and
matching with actual data, that when the number of nodes in a network is large, the deterministic
epidemic models can successfully represent the dynamics of the spread of the malware.
Most of the existing work on dynamic control of parameters of the malware or the
net-work propose heuristic dynamic policies in different contexts, and evaluate them using
simu-lations. [13, 39–41, 59] investigate different attack mechanisms. [59] describes a vulnerability in
MMS services in cellular networks that enables an attacker to drain the device batteries, and [13]
rather than merely depleting, the device batteries for maximizing the overall damage inflicted on
the network which is fostered both by the spread of the infection and the battery depletion. The
closest to our attack setting are [41] and [39] which propose strategies for utilizing the infectives’
available energy so as to increase the spread of the malware; [41] proposes heuristics which do
not provide any damage guarantee, whereas [39] focuses on the static (as opposed to dynamic)
optimum choice of the malware’s parameters. [19, 64, 68, 78, 84, 85] assume the defense point
of view against malware outbreaks. Control theoretic tools have been used in [19] to propose a
feedback-based (but heuristic) strategy for containment of malware in a wired network. [64,84,85]
consider reduction of communication rates as a defense mechanism. However, [84] is based on
heuristics and simulations, and unlike our work, [85] does not propose a formal framework for
at-taining desired trade-offs, and considers only a static choice of the communication rate, whereas
we allow the communication range of the nodes to dynamically evolve over time as the infection
level fluctuates. [64] proposes to contain a worm in the initial phase of infection by limiting the
total number of distinct contacts per node over the containment cycle, and models the growth
of the worm using a stochastic branching process. However, this work only applies to the
ini-tial phase of infection and their countermeasure is ineffective once the epidemic starts. Patching
as a defense mechanism is investigated in [68, 78] among others. Both of these works consider
replicative and non-replicative dispatch in wired networks. The analytical tools and the results
presented there do not however apply in our context since (i) the patching rate is assumed
con-stant in [68,78], whereas we consider dynamic patching policies and (ii) [68,78] consider the final
(maximum, resp.) number of the infective nodes as the performance metric whereas we
investi-gate more general cost functions based on the level of infection as well as the overall bandwidth
consumed by the dispatchers.
Models of propagation of malware which consider the underlying topology of the network
(hence primarily focused on static wired/social networks) are studied in [7,11,28] among others.
topol-ogy is known, do not consider dynamic (changing with time) policies; they focus on SIS models
of treatmen (where the patched nodes are again susceptible to infection) and mostly focus on the
probability of having a long term level of infection and the size of such a population. [11]
con-siders the resource limitation of patching, however, provides optimality only in long term sense
and provides order results (in the number of nodes in the network). In contrast, we assume a
large enough network in which the spread of malware can be approximated by its mean-field
represenation. At the cost of this loss of accuracy in the modeling, we achieve absolute
optimal-ity over any desired time horizon and using dynamic policies, and we characterize the nature of
the optimal solutions.
Very few research works have in fact tried to adopt malware propagation models to
investi-gate optimal dynamic attack and countermeasure responses based on a quantified damage
func-tion in wired or wireless networks. [9, 10, 86], which assume the defense point of view, constitute
notable exceptions. Our defense framework differs from [9, 10, 86] in that we consider (i)
re-duction of reception gain of nodes as well as patching (both replicative and non-replicative), and
(ii) more general network state evolution dynamics in that the counter-measure involves both
im-munization and healing, moreover the worm may cause mortality, and (iii) cost functions which
are only assumed to be either concave or convex and therefore more general than quadratic
func-tions in [9, 10, 86]. Also unlike [9, 10] we do not use any linearization of the system which can be
very poor in the context of epidemic behavior. Moreover, we provide provable structural results
for fairly general system dynamics and cost functions.
In contexts other than network security, optimal control has been extensively used to find the
best deployment of resources e.g. in treating infectious epidemics [6,83], advertising and
market-ing [25,66,67] and recently, in epidemic routmarket-ing [2,3]. An extensive overview of the existmarket-ing work
is beyond the scope of this article. In what follows, we mention and differentiate from some of
the most related works. Formal application of optimal control theory in treatment of infectious
the cost is linear in the treatment rate and/or there is no mortality among infectives [6, 83]. In
contrast, our generalized framework integrates both vaccination and healing/quarantining, the
cost of treatment is any general concave or convex function, and it depends on both infective
and the deceased. Moreover, there is no equivalent of replicative immunization in the case of
infectious diseases. Also, our unified framework generalizes the existing treatment of models in
advertising and marketing [25, 66, 67] which mostly consider only either public advertisement
or word-of-mouth advertisement with linear benefits, and optimizations are mostly with respect
to the steady state behavior of the market, rather than the transitional patterns, which is the
salient feature of the diffusion of new technologies. We consider a nonlinear system and general
cost functions, and consider the transients of the evolution of the states as well. Interestingly,
the optimal control strategies in a related context, that of epidemic forwarding of packets in an
energy-constrained delay tolerant wireless network [2,3], follow similar structures as our optimal
dispatch strategies. The objective in that context is to deliver a message to its destination before
a deadline through forwarding upon contact. The control variable is whether or not (and with
what rate) a recipient of message should transmit it to the next node which it contacts. [2,3] show
that the forwarding decisions are bang-bang with at most one jump. But, we need a different
set of analytical arguments to establish our structure results, because [2, 3] rely on some crucial
assumptions that are ruled out in our context. Specifically, [2] considers only networks that use
two-hop routing, and therefore, the resulting dynamics of the number of infectives(i.e., nodes
that have received the packet) is not representative of an epidemic behavior which is central to
the propagation of malware in wireless networks. Also, [3] investigates a monotonicepidemic
model, which arises when none of the nodes that have received a desired packet loses it (i.e., the
infectives do not lose their infection). By contrast, in our context, counter-measures as well as
mortality may reduce the infection.
Game theory has been used in the context of security in networks as it is apt to model the
inference of the intents, objectives and strategies of a new attacker and apply it to a DDoS attack.
In their work, however, the sets of actions of both the attack and the defense are finite, and
struc-tural property of Nash Equilibria or saddle-points have not been obtained; the work focuses on
the modeling and numerical evaluations. Algorithmic implementations of (variations of) models
in [53] are pursued in [36], [31],etc.[76] combined a deterministic worm propagation model with
a game theoretic process that involves learning, in order to incorporate decisions of users about
whether to install or uninstall a security patch in a wired network. We apply dynamic zero-sum
games to model the strategic confrontations of a malware and the defense in a wireless network,
and delve into the structural properties of the saddle-point strategies, when the attack and
de-fense can intelligently choose the annihilation, patching and reception rates respectively. Thus,
unlike most of the existing work, the defense operates also at the MAC and physical layers, as
opposed to only at the routing or application layers. Indeed, we analyze not only the security
risks (fraction of infectives, dead nodes), but also the QoS degradations (packet drops) and the
lower layer bandwidth consumptions (in transmission of patches) associated with the tradeoffs.
Also, the strategy sets of each player is uncountably infinite since the strategies are functions of
continuous time with continuous ranges. The differences in the contexts and the nature of choices
require a substantially different analytical approach. Our contributions complement [1], which
focuses on detecting the intrusion of a worm that dynamically controls the intensity of its
activ-ity, but does not investigate subsequent defense. [49, 56] assume a network in which each user
autonomously decides whether or not install a security measure, depending on his/her utility
function, and they show that a pure Nash equilibrium (of these decisions) exist. They however,
assume the actions of the malware, and of the users once decided, are fixed over time, and the
game is between the users. In contrast, in our model, the actions of the users and the malware
can dynamically and strategically vary over time and the game is between the network and the
Chapter 2
Notations and Assumptions
In this chapter, we introduce common notations and model assumptions which will be used
throughout the thesis. Asusceptiblenode is a communication device that is not contaminated
by the worm, yet is vulnerable to infection. A node isinfectiveif it is contaminated by the worm.
An infective spreads the worm to a susceptible node while transmitting data or control messages
to it. The worm cankillan infective host,i.e., render it completely dysfunctional - such nodes are
denoteddead. A functional node that is immune to the worm is referred to asrecovered.
Let the total number of nodes in the network beN. Let the number of susceptible, infective,
recovered and dead nodes at timetbe denoted bynS(t), nI(t), nR(t)andnD(t),respectively, and
the corresponding fractions be S(t) = nS(t)/N, I(t) = nI(t)/N, R(t) = nR(t)/N,andD(t) =
nD(t)/N(Table 2.1) respectively. Then,S(t) +I(t) +R(t) +D(t) = 1.At the time of the outbreak
of the infection, that is at time zero, some but not all nodes are infected: 0 < I(0) =I0<1.For
simplicity, letR(0) =D(0) = 0.Thus,S(0) = 1−I0.
In this thesis, we model the dynamics of the propagation of the infection using deterministic
epidemic models based on the classic Kermack-Mckendrick model [18]. Experiments as well as
network simulations have validated that such models provide an acceptable representation for
indepen-S(t) fraction of the susceptible nodes
I(t) fraction of the infective nodes
R(t) fraction of the recovered nodes
D(t) fraction of the dead nodes
Table 2.1:List of notations of measures.
dently validate them in Appendix A. These epidemic models rely on some abstraction which we
motivate and justify next. We ground our assumptions in the context of two driving applications,
Delay Tolerant Networks (DTN) and Multimedia Messaging Service (MMS) in a 3G/4G network.
A DTN (Delay Tolerant Network) is a mobile ad-hoc network (MANET) in which the
communi-cation range is very small compared to the roaming area. Such networks are highly mobile and
continuous connectivity is rare. Application of DTN arises in the contexts of military networks,
sensor-actuator networks, networks in extreme terrestrial environments, etc [23]. MMS in the
context of cellular network is a service which allows users to send multimedia messages which
contains elements such as pictures, audios and videos to other users in a the cellular network.
An infective initiates communication with a susceptible when it generates a valid ID of a
sus-ceptible handset in cellular networks with MMS service, or detects the presence of a sussus-ceptible
node in its communication range in a DTN, and spreads the worm to the susceptible during such
communications. Two nodes are said to be incontactwhenever they communicate. An infective
is equally likely to initiate communication with each node, and hence with each susceptible, say
at rate βˆ. The property that this rate is equal for each pair is often referred to ashomogeneous
mixing. Homogeneous mixing constitutes a key assumption in our models, and in what follows
we justify this assumption in the context of MMS networks and DTNs.
In a 3G/4G network, homogeneous mixing property can arise when infective nodes generate
pairwise communication involves two wireless hops between mobile nodes and access points or
base stations, and one fast wireline backbone between the access points or base stations. The
relative location of communicating nodes determines the number of hops in the fast backbone
network, for which, in comparison to the wireless channel, the delays are often negligible. Thus
the contact rates are not affected by the relative location of pairs.
In DTNs, an infective transmits a message to a susceptible with a given probability whenever
the infective detects the presence of the susceptible in its transmission range. This probability
is proportional to the rate u0 at which the infective scans the media in search of susceptibles
nearby, and the proportionality constant is determined by the message collision probabilityη1,
which is determined by the communication range of the nodes, and the overall node density
(N/A). Under mobility models such as the random waypoint or random direction model [8],
Groeneveltet al.[30] have shown that the time between consecutive arrivals of a specific pair of
nodes in each others’ communication ranges is nearlyexponentiallydistributed, and the rateη2
of this exponential process is equal to 2wEA[V∗]u1, wherewis a constant factor pertaining to the
specific mobility model, E[V∗] is the average relative speed between two nodes, andu1 is the
communication range of the pair, which itself is proportional to the product of the transmission
gain of the antenna of the transmitter and the reception gain of the antenna of the receiver. Note
also that this rate is inversely proportional to the roaming area, i.e.,η2∝ 1
A. This result has been
proved when the communication range of the nodes is small compared to the total area of the
region and v is sufficiently high and is validate through simulations. Thus, a given
infective-susceptible pair contacts as per an exponential random process whose rate at any given timetis
ˆ
β, whereβˆ=η1η2u0., and homogeneous mixing holds.
Patches are distributed when a dispatcher communicates (i.e., contacts) with an infective or a
susceptible node. If the receptor of a security patch is a susceptible node, it installs the security
patch, is subsequently immunized, and its state changes to recovered. If however the receptor
We capture the above possibility, by introducing a coefficient 0 ≤ π ≤ 1. π = 0corresponds
to the case where the patch is completely unable to remove the worm from infectives, and only
immunizes the susceptibles, whereasπ= 1represents the other extreme scenario where a patch
can equally well immunize and heal susceptibles and infectives, and intermediate values ofπ
represent probabilistic or delayed recovery for infectives.
The details of the model for patching slightly varies between our chapters.1 Here, we provide
a high-level road-map of the patching rates considered in each chapter. In part I, the patching
rate is fixed over time, as the focus is on the dynamic control of the attacker. In Chapter 3 of
part I (unlike in the rest of the paper), we could manage to consider the rates of recovery to also
depend on the activity level of the malware, as higher power usage activity can potentially trigger
abnormality detection softwares and lead to higher rates of patching. In neither one of Chapters 3
or 4, π (the relative efficiency of patching in healing the infectives compared to immunizing
the succeptibles) has to be less than one. Indeed, we do not mentionπin the analytical results
therein. In Chapter 5 of part II, the patching rate is fixed, as the focus is on the optimization of
rate reduction as the dynamic defense control. The patching is assumed to be able to only heal
the infectives (no immunization is considered).2 In Chapter 6 of part II as well as in part III, the
patching is dynamic andπis assumed to be bellow one.
Another assumption that we make in our model construction is that although controls vary
with time, at a given time all node use the same control as opposed to an individual-based policy.
In what follows we justify this assumption. Note that distinction between an infective node
and a susceptible node is difficult a priori. Indeed, we assume that from the system’s point of
view, information about whether or not a node is infective is not available to any other node.
Therefore, information about the state of the nodes is either nonexistent or at best represents a
statistics about the average state of the whole network. Hence, at any given time t,all nodes 1The analytical results in each chapter is derived assuming the specific choices. However, they may not be necessary
conditions in general.
choose identical controls, either for defense or attack. Nevertheless, the reception gain of the
nodes, the fraction of activated dispatchers and the rate of dispatching can be allowed to vary
with time,i.e., selected dynamically, though identically among individual nodes.
In part I, to obtain fundamental bounds on the potency of the attack, we assume that the
net-work parameters are known to the malware. Similarly, in part II, in order to obtain fundamental
bounds on the efficacy of the defense, we assume that the network computes its optimal controls
assuming full knowledge of the attack parameters. However, in the numerical sections of the
corresponding chapters, we investigate the effect of errors in the estimation of these parameters
on the aggregate damage. We also assume that the parameters of the opponent is selected a priori
and does not change them with time. In contrast, in part III, we consider the case in which the
parameters of neither the attack nor the defense are fixed and rather can be selected dynamically,