ScholarlyCommons
Publicly Accessible Penn Dissertations
2017
The Role Of Attributions In The Perception Of
Criticism
Kelly M. Allred
University of Pennsylvania, [email protected]
Follow this and additional works at:https://repository.upenn.edu/edissertations Part of theClinical Psychology Commons
This paper is posted at ScholarlyCommons.https://repository.upenn.edu/edissertations/2869 For more information, please [email protected].
Recommended Citation
Allred, Kelly M., "The Role Of Attributions In The Perception Of Criticism" (2017).Publicly Accessible Penn Dissertations. 2869.
Abstract
Perceived criticism from loved ones is a predictor of poor clinical outcomes for patients with a range of psychological disorders. Previous research indicates that attributions of criticism, the explanations individuals make about the intentions underlying relatives’ criticism, may play a role in the perception of criticism. The goal of the present research was to explore the relationship between attributions of criticism and perceived criticism in undergraduate, community, and clinical samples. In Chapter 1, we examined the longitudinal relationship between attributions and perceived constructive and destructive criticism in a sample of undergraduates. Results showed that positive attributions predicted increases in perceived constructive criticism, whereas negative attributions predicted increases in perceived destructive criticism over time. Conversely, destructive criticism predicted increases in negative attributions and decreases in positive attributions over time. In Chapter 2, we examined the relationships among attributions, perceived constructive and destructive criticism, upset due to criticism, and warmth in a sample of Black and White community participants and tested for differences across race. Results proved consistent across race: Positive attributions were associated with greater perceived constructive criticism and less upset, whereas negative attributions were associated with greater perceived destructive criticism and upset. Warmth was related to greater perceived constructive criticism, less destructive criticism, and less upset. Blacks were less upset by relatives’ criticism than Whites if they perceived their relative to be warm. In Chapter 3, we examined the relationships among attributions, perceived criticism, and upset due to criticism among individuals with anxiety disorders and those without psychopathology. Negative attributions were associated with greater global perceived criticism and upset due to criticism. Negative attributions also contributed to greater perceived criticism and upset over and above the effect of observer-rated criticism during a problem-solving interaction. Positive attributions were not significantly related to any perceived criticism or upset measure. These patterns were consistent across clinical and normal control groups. Taken together, results suggest that attributions of criticism play an important role in the perception of criticism and point to attributions as a potential target of interventions to reduce perceived criticism and upset and ultimately improve clinical outcomes for patients with psychological disorders.
Degree Type Dissertation
Degree Name
Doctor of Philosophy (PhD)
Graduate Group Psychology
First Advisor
Dianne L. Chambless
Keywords
attributions, couples, family relationships, perceived criticism, racial differences, upset due to criticism
Clinical Psychology
THE ROLE OF ATTRIBUTIONS IN THE PERCEPTION OF CRITICISM Kelly M. Allred
A DISSERTATION in
Psychology
Presented to the Faculties of the University of Pennsylvania in
Partial Fulfillment of the Requirements for the Degree of Doctor of Philosophy
2018
Supervisor of Dissertation
_________________________________
Dianne L. Chambless, Professor of Psychology
Graduate Group Chairperson
_________________________________
Sara R. Jaffee, Professor of Psychology
Dissertation Committee
ACKNOWLEDGMENT
Foremost, I would like to thank my adviser Dianne Chambless. In fantasy, I could not have conceived of a better mentor. Your keen mind, meticulous guidance, trenchant but tactful criticism, kind encouragement, boundless patience, and natural generosity surely eased my progress and fostered the confidence I needed to bring this project to fruition. I will always think of myself as a fortunate sibling among your numerous academic progeny.
I also want to thank my committee members Geoff Goodwin and Coren Apicella whose guidance, encouragement, and helpful suggestions have made this a better
dissertation and me a better researcher.
To the Ladies of the Lab: Eliora Porter, Moriah Brier, and Rachel Schwartz. Thank you for your careful reading of manuscripts, your companionship, and your commiseration over the years.
I would also like to thank Jasmine Rogasner and all the other talented research assistants and summer volunteers without whose careful checking, coding, and clerical support this project would have been an immeasurably more difficult task.
I am grateful to my clinical supervisors Melissa Hunt, Virginia O’Hayer, Alan Goldstein, and Rob DeRubeis who taught me where the theoretical rubber meets the therapeutic road. You have guided me through the very difficult practical work of being a therapist and have introduced me to the true art of this discipline.
I owe a debt of gratitude to my early mentors in psychology: Ayelet Ruscio and Angela Duckworth. Ayelet, you started me on this journey by allowing me to volunteer in your lab as an undergraduate and by sharing your thoughts and insights and giving me your close attention and encouragement. Angie, by taking me on as a research
coordinator you truly introduced me to the grit necessary to get through this arduous process.
ABSTRACT
THE ROLE OF ATTRIBUTIONS IN THE PERCEPTION OF CRITICISM Kelly M. Allred
Dianne L. Chambless
Perceived criticism from loved ones is a predictor of poor clinical outcomes for patients with a range of psychological disorders. Previous research indicates that attributions of criticism, the explanations individuals make about the intentions underlying relatives’ criticism, may play a role in the perception of criticism. The goal of the present research was to explore the relationship between attributions of criticism and perceived criticism in undergraduate, community, and clinical samples. In Chapter 1, we examined the longitudinal relationship between attributions and perceived constructive and destructive criticism in a sample of undergraduates. Results showed that positive attributions
predicted increases in perceived constructive criticism, whereas negative attributions predicted increases in perceived destructive criticism over time. Conversely, destructive criticism predicted increases in negative attributions and decreases in positive attributions over time. In Chapter 2, we examined the relationships among attributions, perceived constructive and destructive criticism, upset due to criticism, and warmth in a sample of Black and White community participants and tested for differences across race. Results proved consistent across race: Positive attributions were associated with greater perceived constructive criticism and less upset, whereas negative attributions were associated with greater perceived destructive criticism and upset. Warmth was related to greater
TABLE OF CONTENTS
ACKNOWLEDGMENT ... II
ABSTRACT ... IV
LIST OF TABLES ... VII
LIST OF APPENDICES ... IX
CHAPTER 1 ... 1
Abstract ... 2
References ... 22
CHAPTER 2 ... 32
Abstract ... 33
References ... 61
CHAPTER 3 ... 72
Abstract ... 73
References ... 101
LIST OF TABLES
CHAPTER 1
Table 1: Summary Statistics and Zero-Order Correlations for Attributions,
Perceived Constructive and Destructive Criticism, and DASS Depression at Time 1 and Time 2
Table 2: Factor Loadings for Exploratory Structural Equation Model (ESEM) with Geomin Rotation of Attributions of Criticism Scale (ACS) Items
Table 3: Multiple Regression of Attributions, Perceived Constructive Criticism, and DASS Depression at Time 1 Predicting Perceived Constructive Criticism at Time 2
Table 4: Multiple Regression of Attributions, Perceived Destructive Criticism, and DASS Depression at Time 1 Predicting Perceived Destructive Criticism at Time 2
Table 5: Multiple Regression of Perceived Constructive and Destructive Criticism, Positive Attributions, and DASS Depression at Time 1 Predicting Positive Attributions at Time 2
Table 6: Multiple Regression of Perceived Constructive and Destructive Criticism, Negative Attributions, and DASS Depression at Time 1 Predicting
Negative Attributions at Time 2
CHAPTER 2
Table 1: Factor Loadings for Exploratory Structural Equation Model (ESEM) with Geomin Rotation of Attributions of Criticism Scale (ACS) Items
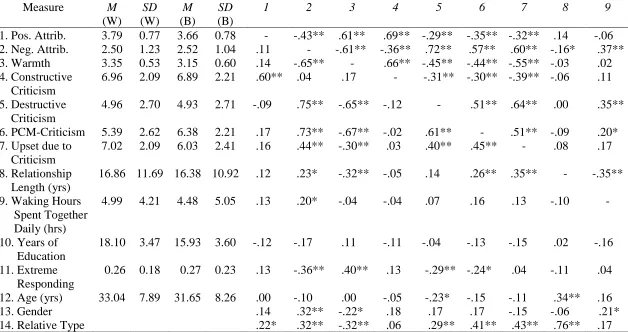
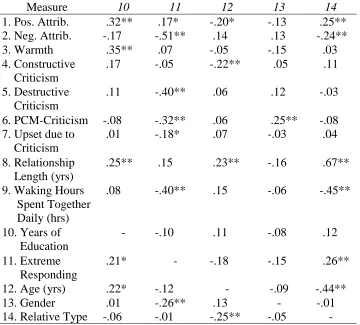
Table 2: Summary Statistics and Zero-Order Correlations for Attributions, Warmth, Perceived Criticism, Relationship Factors, and Demographic Variables for Blacks and Whites
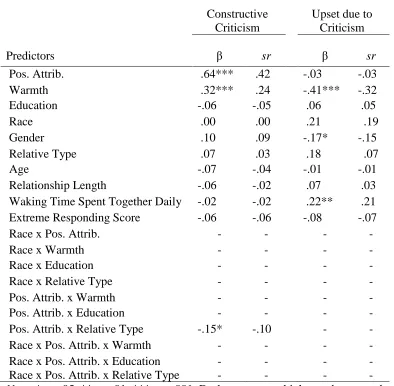
Table 3: Regressions Predicting Constructive Criticism and Upset due to Criticism from Positive Attributions
CHAPTER 3
Table 1: Zero-Order Correlations among Attributions, Perceived Criticism and Upset, and Relationship Satisfaction
Table 2: Demographics and Descriptive Statistics for Study Measures by Diagnostic Group
Table 3: Multiple Regression of Clinical Status, Attributions, and Relationship Satisfaction Predicting Global Perceived Criticism and Upset
Table 4: Multiple Regression of Clinical Status, Attributions, Observed Criticism, and Relationship Satisfaction Predicting Perceived Criticism and Upset for Non-Anxiety-Related Interaction
LIST OF APPENDICES
CHAPTER 1
Appendix A: Variables Included in Multiple Imputation Model
CHAPTER 2
CHAPTER 1
Attributions Predict Changes in Perceived Constructive and Destructive Criticism
Abstract
Objective(s): This investigation sought (a) to continue psychometric work on the Attributions of Criticism Scale (ACS), which measures attributions about the intentions underlying relatives’ criticism, and (b) to examine the longitudinal relationship between attributions of criticism from one’s relative and perceived constructive and destructive criticism from that relative.
Method: Undergraduates (N = 193) completed measures of attributions of criticism and perceived criticism at two time points five weeks apart.
Results: Consistent with previous findings, the ACS displayed a two-factor solution of positive and negative attributions. These factors demonstrated good psychometric properties. Positive attributions predicted increases in perceived constructive criticism over time, whereas negative attributions predicted increases in destructive criticism. Conversely, destructive, but not constructive, criticism predicted increases in negative attributions as well as decreases in positive attributions over time.
Attributions Predict Changes in Perceived Constructive and Destructive Criticism
over Time
The criticism that patients receive from their loved ones is an important predictor of poor clinical outcomes for a range of mental disorders (Butzlaff & Hooley, 1998). Traditionally relatives’ criticism has been assessed by interviewing the relative with the Camberwell Family Interview and subsequently submitting the recording of that
interview to analysis by trained coders (Vaughn & Leff, 1976). However, an emerging body of literature indicates that much can be gained by simply asking the patient to rate the relative’s criticism using a single item measure, the Perceived Criticism Measure (Hooley & Teasdale, 1979). This single item predicts poor outcomes for schizophrenia, major depression, bipolar disorder, obsessive-compulsive disorder, panic disorder, and substance use and may be a stronger predictor of outcome than criticism assessed by the traditional method (see review by Masland & Hooley, 2015).
individuals have about the intentions driving their relatives’ behavior (Weiner, 1986). An example may better illustrate this distinction. Imagine a mother who tells her son that she dislikes his style of dress. When the son reports being criticized by his mother, he is reporting perceived criticism. He may also make various attributions about the intentions behind his mother’s comments: He may view her intentions as positive (e.g., “My mother wants me to look neat and put my best foot forward”) or negative (e.g., “My mother is trying to attack my style choices and undermine my autonomy”). The kinds of
attributions the son makes about his mother’s intentions are proposed to influence the extent to which he feels criticized by her. For example, if he makes mostly positive attributions about her comments, he may perceive her as less destructively critical. Thus, attributions are theorized to precede and influence the judgment of criticism.
Consistent with this model, cross-sectional research has established a link between attributions and perceived criticism. In a study of community couples,
example illustrates, attributions may also be positive. Despite these limitations, the research suggests that changing attributions may be an effective way to decrease perceived criticism and mitigate its negative effects.
associated with greater constructive and less destructive criticism in a community sample, whereas the opposite associations were found for negative attributions. However, causal inferences are precluded by this study’s cross-sectional design.
In the current investigation, we sought to build on previous research by exploring the longitudinal relationship between attributions and perceived criticism in an
undergraduate sample. Although our model clearly proposes that attributions make a causal contribution to perceived criticism, all of the research on attributions and perceived criticism to date has been cross-sectional in nature, preventing causal
A secondary goal of the current study was to continue psychometric work on the ACS. The psychometric properties of this scale have already been examined in
undergraduate and community samples (Allred & Chambless, 2013, 2014). The ACS demonstrated a three-factor structure in the previous undergraduate sample (Allred & Chambless, 2013), but subsequent to scale refinement and the addition of more items, the ACS displayed a two-factor structure in an older community sample, with factors
representing positive and negative attributions (Allred & Chambless, 2014). Thus, it is an open question whether the ACS demonstrates a different factor structure in younger age groups or whether the different factor structures obtained in the undergraduate and community samples were the result of changes to the composition of the scale. We
sought to answer this question by examining the factor structure of the ACS in the current undergraduate sample. We also explored the internal consistency, convergent and
discriminant validity, and test-retest reliability of the ACS factors. Finally, due to the cross-sectional design of their initial validation study, Renshaw and colleagues (2010) were unable to establish test-retest reliability of the PCM-Type, a measure of perceived constructive and destructive criticism. The current study contributes to the psychometric work on this measure by examining the test-retest reliability of these types of perceived criticism over the course of five weeks.
Method
Participants
Undergraduates at the University of Pennsylvania were recruited from the
Excluded Cases and Missing Data). Thus, the final sample comprised 193 individuals (159 women, 34 men) ranging in age from 18 to 24 (M = 19.55, SD = 1.19). Due to a clerical error, data on participant race and ethnicity were not collected initially. Participants were contacted and asked to provide these data. Of the 193 in the final sample, 68 (35.2%) identified as White, 39 (20.2%) as Asian, 8 (4.1%) as African American, and 11 (5.7%) as other, whereas 67 (34.7%) did not respond. Of the students, 11 (5.7%) identified as Hispanic, and 64 (33.1%) did not provide their ethnicity. The racial and ethnic breakdown of our sample was comparable to the racial and ethnic composition of the University of Pennsylvania undergraduate population at large (University of Pennsylvania, 2015).
Procedure
e-mail to complete the same questionnaire measures again. The questionnaire took
approximately 20 minutes to complete at each time point, and students were compensated with 1 hour of research credit for completing both assessments. All study procedures and measures were approved by the University of Pennsylvania’s Institutional Review Board.
Measures
Participants provided basic demographic information and completed the following measures:
Attributions of Criticism Scale (ACS; Allred & Chambless, 2014). The ACS is
a 22-item questionnaire that assesses the attributions that individuals make about the intentions underlying their relatives’ criticism. Items include “When your relative
criticizes you, to what extent do you believe he/she is trying to get you to do better, learn, or grow?” and “When your relative criticizes you, to what extent do you believe he/she is trying to attack you?” Participants rate their attributions on a Likert-type scale ranging from 1 (not at all) to 5 (completely). Psychometric work on the ACS in a community sample demonstrated a two-factor structure with factors corresponding to positive and negative attributions; research in an undergraduate sample with an earlier version of the ACS demonstrated good convergent and discriminant validity (Allred & Chambless, 2013, 2014). Additional psychometric properties of the ACS in the current sample are discussed below (see Results).
Perceived Criticism Measure – Type (PCM-Type; Renshaw et al., 2010). To
Participants responded to the following questions: “When your relative is critical of you, how harsh or hurtful is he/she?” rated on a scale from 1 (not at all harsh/hurtful) to 10 (very harsh/hurtful) and “When your relative is critical of you, how helpful or
constructive is he/she?” rated on a scale from 1 (not at all constructive/helpful) to 10 (very constructive/helpful). These items have shown good convergent and discriminant validity vis-à-vis measures of relationship satisfaction and psychopathology (Renshaw et al., 2010). Research has shown destructive criticism to be moderately to strongly
correlated with the PCM in a sample of undergraduates with depressive symptoms (r = .36; Renshaw et al., 2010), in a community sample of Blacks and Whites (r = .57; Allred & Chambless, 2014), and in the current undergraduate sample (r = .54), whereas
constructive criticism has not been found to correlate strongly with the PCM (rs = -.05 to -.18).
Depression Anxiety Stress Scales-21 (DASS-21; Lovibond & Lovibond,
Results
Excluded Cases and Missing Data
Of the 260 participants who consented and accessed the survey, 55 were excluded for nominating individuals other than a parental figure as the most
impactful/influential person in their lives. One was excluded for nominating a parental figure who was deceased, and 11 were excluded for not nominating the same individual at both assessment points. Thus, after exclusion, the final sample comprised 193
participants. Of those in the final sample, 33 (17.1%) did not complete the second assessment. There were no significant differences between these participants and those who completed both assessments on demographic variables or any of our variables of interest. For the participants who did not provide data at the second assessment, data for our outcome variables, perceived constructive and destructive criticism and positive and negative attributions at Time 2, were imputed with multiple imputation using 40
iterations. To prevent bias, missing values on the independent variables included in the linear regressions were also imputed (Acock, 2012). Consistent with the
recommendations of Acock, predictors in the multiple imputation model included all predictors in the linear regressions (see Relationship between Attributions and Types of Perceived Criticism Over Time section below for description of regression analyses) as well as auxiliary variables in our dataset that were significantly correlated with Time 2 constructive and destructive criticism, positive and negative attributions, or missingness on any of these variables (See Appendix A for additional information on multiple imputation model). See Table 1 for zero-order correlations among study measures.
A power analysis conducted with G*Power 3 (Faul, Erdfelder, Lang, & Buchner, 2007) indicated that in a sample of 193 participants, there was 84.2% power to detect a small effect size of f2 = .07 in a linear regression with four predictors (the most included in any model).
Description of the Sample
On average, participants reported spending 0.76 hours (SD = 2.93) each day in the previous week with the most influential person in their lives; however, the majority (83.9%) of participants reported spending no time with this person during this period. Participants also reported spending an average of 2.35 hours (SD = 2.58) each day communicating with this person via phone, email, or any other form of electronic communication in the previous week.
Psychometrics Tests of the Attributions of Criticism Scale (ACS) and PCM-Type
We sought to confirm the ACS two-factor structure demonstrated in the
community sample of Allred and Chambless (2014) by determining the factor structure of the ACS at Time 1 in this sample. Research has shown that confirmatory factory analysis often results in poor model when item-level indicators are used because CFAs require each indicator to load onto only one factor, which is often too restrictive (Marsh, Morin, Parker, & Kaur, 2014). Consequently, Marsh et al. (2014) recommend the use of
exploratory structural equation modeling (ESEM) which allows for all factor loadings and cross-loadings to be freely estimated within a specified factor structure.
In accordance with the recommendations of Marsh and colleagues (2014), we first conducted a two-factor CFA because a CFA reflects the simplest solution when it
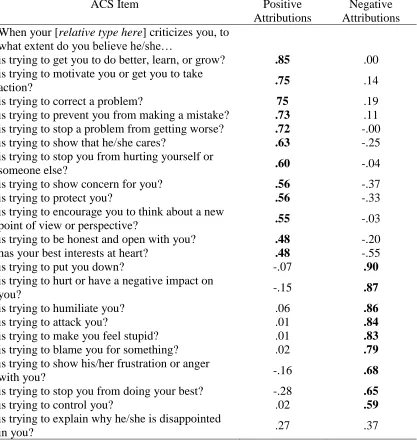
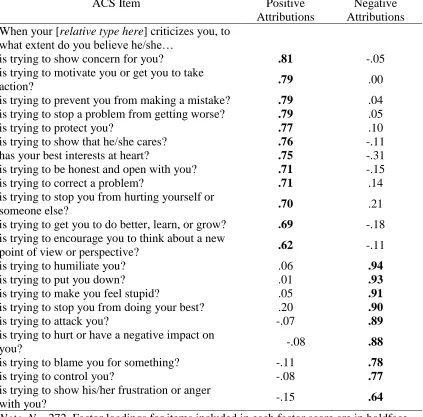
.10. We then conducted an ESEM using WLSMV estimation and geomin rotation in Mplus (Muthén & Muthén, 2007) and found acceptable model fit, χ2 (188) = 366.69, p < .001; CFI = .96; RMSEA = .07. Consistent with the findings of Allred and Chambless (2014), results demonstrated a two-factor structure with factors corresponding to positive and negative attributions (see item factor loadings in Table 2). Two items (“When your [parental figure] criticizes you, to what extent do you think he/she is trying to show concern for you?” and “When your [parental figure] criticizes you, to what extent do you think he/she has your best interests at heart?”) had salient loadings (≥.35) on both the positive and negative attribution factors. One of these items (“When your [parental figure] criticizes you, to what extent do you think he/she is trying to show concern for you?”) was ultimately included in the positive attributions subscale because it loaded more strongly on this factor. The other item (“When your [parental figure] criticizes you, to what extent do you think he/she has your best interests at heart?”) loaded comparably on the positive and negative attribution factors. However, given that this item loaded on factors representing positive attributions in the undergraduate sample and two community samples of Allred and Chambless (2013, 2014, 2016)1, it was ultimately included in the positive attributions subscale in this sample. Another item (“When your [parental figure] criticizes you, to what extent do you think he/she is trying to explain why he/she is disappointed in you?”) loaded on the negative attributions factors in this sample; however, it loaded on the positive attributions factor in the previous community sample and on the negative attributions factor (referred to as the Inflicting Harm factor) in the
previous undergraduate sample (Allred & Chambless, 2013, 2014). Because of the ambiguity of this item, it was removed from the scale, and the 21-item version was used in subsequent analyses. The positive (α= .84) and negative (α= .86) attribution subscales showed good internal consistency and were moderately negatively correlated (r = -.39).
Test-retest reliability. The ACS subscales demonstrated good test-retest
reliability in the current sample. Test-retest reliability over a period of approximately five weeks was .74 for positive attributions and .78 for negative attributions. The PCM-Type also displayed good test-retest reliability over the course of five weeks (r = .74 for constructive criticism, r = .63 for destructive criticism).
Convergent and discriminant validity. To test the convergent and discriminant
validity of the ACS, we examined the correlations of attributions with perceived constructive and destructive criticism and depression scores at Time 1. Positive and negative attributions displayed medium to large correlations with constructive (r = .36) and destructive criticism (r = .47), respectively, indicating good convergent validity. To test discriminant validity, Meng, Rosenthal, and Rubin’s (1992) procedure for comparing correlated correlation coefficients was employed. Results showed that positive
attributions were more strongly related to constructive criticism, and negative attributions were more strongly related to destructive criticism, than either attribution type was to depression (r = -.06 with positive attributions, r =.14 with negative attributions). These differences were statistically significant (Zs = 3.72 to 4.31, ps < .001), indicating good discriminant validity of the attribution subscales.
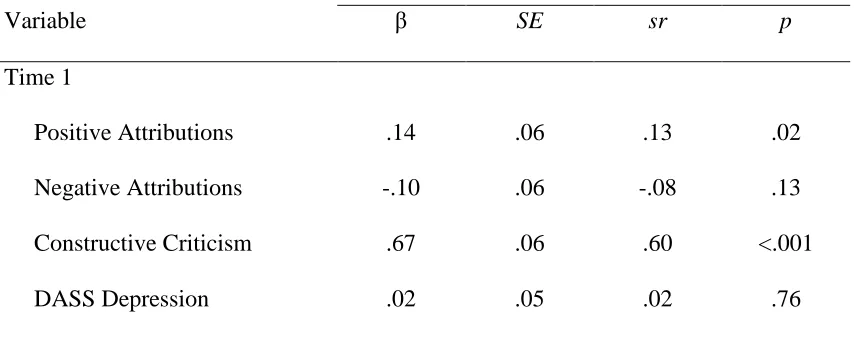
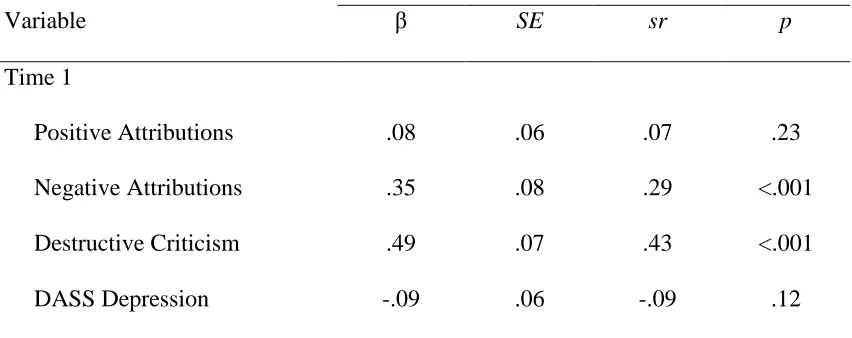
To model change in perceived constructive criticism over time, a regression analysis predicting Time 2 constructive criticism was conducted with Time 1 constructive criticism, positive and negative attributions, and depression scores as independent
variables. Similarly, a regression predicting Time 2 destructive criticism was run with Time 1 destructive criticism, positive and negative attributions, and depression scores as predictors. Diagnostic indices including dfbetas, distributions of residuals, and condition indexes were examined in all regression analyses to confirm that data did not violate the assumptions of multiple regression. See Tables 3 and 4 for regression results. As
predicted, results indicated that positive attributions predicted increases in constructive criticism, and negative attributions predicted increases in destructive criticism.
To test the alternative hypothesis that perceived criticism predicts change in attributions over time, a regression analysis predicting Time 2 positive attributions was conducted with Time 1 positive attributions, constructive and destructive criticism, and depression scores as predictors. A regression predicting Time 2 negative attributions was also conducted with Time 1 negative attributions, constructive and destructive criticism, and depression scores as independent variables. See Tables 5 and 6 for regression results. Results showed that destructive criticism predicted decreases in positive attributions and increases in negative attributions, but constructive criticism did not significantly predict change in positive or negative attributions. Notably, depression scores did not
significantly predict change in either perceived constructive and destructive criticism or positive and negative attributions. Thus, attributions contributed to changes in perceived criticism and vice versa over and above the effect of depression symptoms.
weeks, providing further support for the favorable psychometric properties of this measure.
Consistent with hypotheses, positive and negative attributions differentially predicted changes in the types of perceived criticism over time. Positive attributions predicted increases in perceived constructive criticism, and negative attributions predicted increases in destructive criticism. However, the alternative hypothesis that perceived criticism would predict change in attributions over time was also partially supported: Destructive criticism predicted decreases in positive attributions and increases in negative attributions, but constructive criticism did not predict change in either type of attributions. Moreover, when it came to the temporal relationships between destructive criticism and negative attributions, Time 1 negative attributions were a stronger predictor of Time 2 destructive criticism than vice versa. Notably, attributions predicted changes in perceived criticism and vice versa over and above the effects of baseline depression symptoms, indicating that attributions (especially negative ones) as well as perceived criticism are not merely a reflection of negative biases associated with depression. Taken together, these findings also highlight the importance of separating global perceived criticism into its constructive and destructive components.
establishing the temporal order of our variables of interest, allowing a stronger test of our causal model. It is important to note that given the correlational nature of our design, we are unable to demonstrate causality. However, our results do support the predictive validity of the ACS and PCM-Type and provide greater, although not definitive support for a causal relationship between positive attributions and constructive criticism than previous cross-sectional research. Moreover, we find a reciprocal relationship between negative attributions and destructive criticism in which negative attributions exert a stronger effect on destructive criticism than vice versa. Our results also suggest that destructive criticism may play an important role in determining the extent to which individuals make positive attributions about their loved ones’ intentions. However, more longitudinal research with a greater number of time points is needed to elucidate further the nature of the relationship between attributions and perceived criticism.
clinical experience indicates that in many cases there is a more palatable motive than the patient has assumed - for example, that the relative is frustrated and feels helpless in the face of the patient’s disorder rather than that the relative intends to wound the patient. See Chambless (2012) for a description of the process of working with attributions underlying perceived criticism. It will be important for future studies to determine if interventions that target patients’ attributions decrease subsequent perceived criticism and result in better clinical outcomes for patients.
The current study is not without its limitations. One major limitation is that the sample comprised undergraduates who were not selected for clinical diagnosis. Thus, future research is needed to replicate the current findings in a clinical sample.
Appendix A
Variables Included in Multiple Imputation Model
Demographic Variables
Dummy-coded Race (1 = African American, 0 = Not African American) Time 1 Variables
Positive Attributions Negative Attributions Constructive Criticism Destructive Criticism
Global Perceived Criticism (as measured by the Perceived Criticism Measure (PCM; Hooley & Teasdale, 1989))
DASS Depression score Time 2 Variables
References
Acock, A. C. (2012). What to do about missing values. In H. Cooper (Ed.), APA handbook of research methods in psychology vol. 3: Data analysis and research
publications (pp. 27-50). Washington, DC: American Psychological Association. Allred, K. M., & Chambless, D. L. (2013, November). The importance of attributions in
the prediction of destructive and constructive perceived criticism. Poster presented at the meeting of the Association for Behavioral and Cognitive Therapies, Nashville, TN.
Allred, K. M., & Chambless, D. L. (2014). Attributions and race are critical: Perceived criticism in a sample of African American and White community participants.
Behavior Therapy, 45, 817-830. https://doi.org/10.1016/j.beth.2014.06.002 Allred, K. M., & Chambless, D. L., (2016). [Attributions of criticism in a community
sample of African Americans and Whites]. Unpublished raw data.
Brown, T. A., Chorpita, B. F., Korotitsch, W., & Barlow, D. H. (1997). Psychometric properties of the Depression Anxiety Stress Scales (DASS) in clinical samples.
Behaviour Research and Therapy, 35, 79-89. https://doi.org/10.1016/S0005-7967(96)00068-X
Butzlaff, R. L., & Hooley, J. M. (1998). Expressed emotion and psychiatric relapse: A meta-analysis. Archives of General Psychiatry, 55, 547-552. doi:
10.1001/archpsyc.55.6.547
Chambless, D. L. (2012). Adjunctive couple and family intervention for patients with anxiety disorders. Journal of Clinical Psychology, 68, 548-560.
Chambless, D. L., & Blake, K. D. (2009). Construct validity of the perceived criticism measure. Behavior Therapy, 40, 155-163.
https://doi.org/10.1016/j.beth.2008.05.005
Chambless, D. L., Blake, K. D., & Simmons, R. A. (2010). Attributions for relatives’ behavior and perceived criticism: Studies with community participants and patients with anxiety disorder. Behavior Therapy, 41, 388-400.
https://doi.org/10.1016/j.beth.2009.11.001
Chambless, D. L., Bryan, A. D., Aiken, L. S., Steketee, G., & Hooley, J. M. (1999). The structure of expressed emotion: A three-construct representation. Psychological Assessment, 11, 67-76. http://dx.doi.org/10.1037/1040-3590.11.1.67
Chambless, D. L., & Steketee, G. (1999). Expressed emotion and behavior therapy outcome: A prospective study with obsessive-compulsive and agoraphobic outpatients. Journal of Consulting and Clinical Psychology, 67, 658-665. http://dx.doi.org/10.1037/0022-006X.67.5.658
Faul, F., Erdfelder, E., Lang, A. G., & Buchner, A. (2007). G* Power 3: A flexible statistical power analysis program for the social, behavioral, and biomedical sciences. Behavior Research Methods, 39, 175-191.
https://doi.org/10.3758/BF03193146
Gotlib, I. H., Krasnoperova, E., Yue, D. N., & Joormann, J. (2004). Attentional biases for negative interpersonal stimuli in clinical depression. Journal of Abnormal
Hooley, J. M., & Teasdale, J. D. (1989). Predictors of relapse in unipolar depressives: expressed emotion, marital distress, and perceived criticism. Journal of Abnormal Psychology, 98, 229-235. http://dx.doi.org/10.1037/0021-843X.98.3.229
Lovibond, P. F., & Lovibond, S. H. (1995). The structure of negative emotional states: Comparison of the Depression Anxiety Stress Scales (DASS) with the Beck Depression and Anxiety Inventories. Behaviour Research and Therapy, 33, 335-343. https://doi.org/10.1016/0005-7967(94)00075-U
Marsh, H. W., Morin, A. J., Parker, P. D., & Kaur, G. (2014). Exploratory structural equation modeling: An integration of the best features of exploratory and
confirmatory factor analysis. Annual Review of Clinical Psychology, 10, 85-110. https://doi.org/10.1146/annurev-clinpsy-032813-153700
Masland, S. R., & Hooley, J. M. (2015). Perceived criticism: A research update for clinical practitioners. Clinical Psychology: Science and Practice, 22, 211-222. https://doi.org/10.1111/cpsp.12110
Meng, X. L., Rosenthal, R., & Rubin, D. B. (1992). Comparing correlated correlation coefficients. Psychological Bulletin, 111, 172-175.
http://dx.doi.org/10.1037/0033-2909.111.1.172
Renshaw, K. D.(2007). Perceived criticism only matters when it comes from those you live with. Journal of Clinical Psychology, 63, 1171-1179.
https://doi.org/10.1002/jclp.20421
Renshaw, K. D. (2008). The predictive, convergent, and discriminant validity of perceived criticism: A review. Clinical Psychology Review, 28, 521-534. https://doi.org/10.1016/j.cpr.2007.09.002
nonhostile forms of perceived criticism from others. Behavior Therapy, 41, 364-374. https://doi.org/10.1016/j.beth.2009.06.003
Scott, J., Colom, F., Pope, M., Reinares, M., & Vieta, E. (2012). The prognostic role of perceived criticism, medication adherence and family knowledge in bipolar disorders. Journal of Affective Disorders, 142, 72-76.
https://doi.org/10.1016/j.jad.2012.04.005
Stucky, B. D., Gottfredson, N. C., & Panter, A. T. (2012). Item-level factor analysis. In H. Cooper, P. Camic, D. Long, A. T. Panter, D. Rindskopf, & K. Sher (Eds.),
APA handbook of research methods in psychology (pp. 683-697), Washington, DC: APA Books.
University of Pennsylvania. (2015). Facts and figures. Retrieved from http://diversity.upenn.edu/diversity_at_penn/facts_figures/
Vaughn, C., & Leff, J. (1976). The measurement of expressed emotion in the families of psychiatric patients. British Journal of Social and Clinical Psychology, 15, 157-165. https://doi.org/10.1111/j.2044-8260.1976.tb00021.x
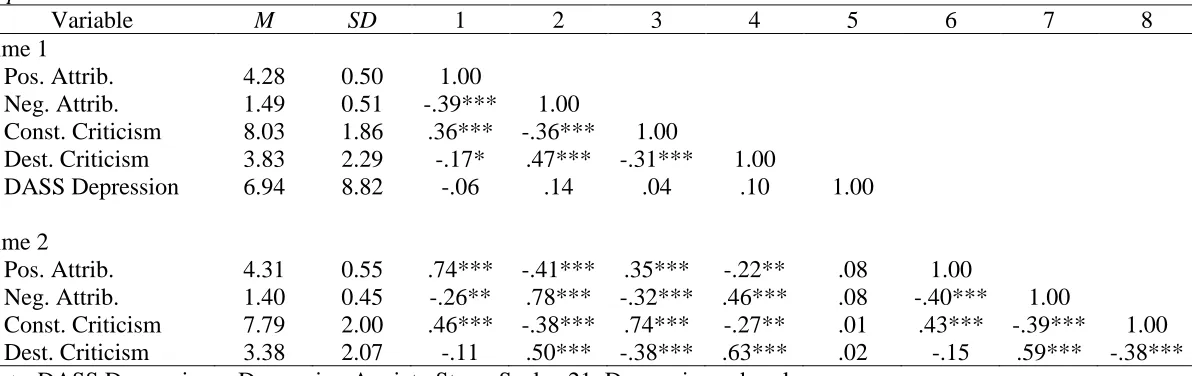
Table 1
Summary Statistics and Zero-Order Correlations for Attributions, Perceived Constructive and Destructive Criticism, and DASS Depression at Time 1 and Time 2
Variable M SD 1 2 3 4 5 6 7 8 Time 1
1. Pos. Attrib. 4.28 0.50 1.00
2. Neg. Attrib. 1.49 0.51 -.39*** 1.00
3. Const. Criticism 8.03 1.86 .36*** -.36*** 1.00
4. Dest. Criticism 3.83 2.29 -.17* .47*** -.31*** 1.00
5. DASS Depression 6.94 8.82 -.06 .14 .04 .10 1.00 Time 2
6. Pos. Attrib. 4.31 0.55 .74*** -.41*** .35*** -.22** .08 1.00
7. Neg. Attrib. 1.40 0.45 -.26** .78*** -.32*** .46*** .08 -.40*** 1.00
8. Const. Criticism 7.79 2.00 .46*** -.38*** .74*** -.27** .01 .43*** -.39*** 1.00 9. Dest. Criticism 3.38 2.07 -.11 .50*** -.38*** .63*** .02 -.15 .59*** -.38***
Table 2
Factor Loadings for Exploratory Structural Equation Model (ESEM) with Geomin Rotation of Attributions of Criticism Scale (ACS) Items
ACS Item Positive Attributions
Negative Attributions When your [relative type here] criticizes you, to
what extent do you believe he/she…
is trying to get you to do better, learn, or grow? .85 .00 is trying to motivate you or get you to take
action? .75 .14
is trying to correct a problem? 75 .19 is trying to prevent you from making a mistake? .73 .11 is trying to stop a problem from getting worse? .72 -.00 is trying to show that he/she cares? .63 -.25 is trying to stop you from hurting yourself or
someone else? .60 -.04
is trying to show concern for you? .56 -.37 is trying to protect you? .56 -.33 is trying to encourage you to think about a new
point of view or perspective? .55 -.03 is trying to be honest and open with you? .48 -.20 has your best interests at heart? .48 -.55 is trying to put you down? -.07 .90
is trying to hurt or have a negative impact on
you? -.15 .87
is trying to humiliate you? .06 .86
is trying to attack you? .01 .84
is trying to make you feel stupid? .01 .83
is trying to blame you for something? .02 .79
is trying to show his/her frustration or anger
with you? -.16 .68
is trying to stop you from doing your best? -.28 .65
is trying to control you? .02 .59
is trying to explain why he/she is disappointed
in you? .27 .37
Table 3
Multiple Regression of Attributions, Perceived Constructive Criticism, and DASS Depression at Time 1 Predicting Perceived Constructive Criticism at Time 2
Note. N = 193. DASS Depression = Depression Anxiety Stress Scales-21: Depression subscale.
Constructive Criticism – Time 2
Variable β SE sr p
Time 1
Table 4
Multiple Regression of Attributions, Perceived Destructive Criticism, and DASS Depression at Time 1 Predicting Perceived Destructive Criticism at Time 2
Note. N = 193. DASS Depression = Depression Anxiety Stress Scales-21: Depression subscale.
Destructive Criticism – Time 2
Variable β SE sr p
Time 1
Table 5
Multiple Regression of Perceived Constructive and Destructive Criticism, Positive Attributions, and DASS Depression at Time 1 Predicting Positive Attributions at Time 2
Note. N = 193. DASS Depression = Depression Anxiety Stress Scales-21: Depression subscale.
Positive Attributions – Time 2
Variable β SE sr p
Time 1
Table 6
Multiple Regression of Perceived Constructive and Destructive Criticism, Negative Attributions, and DASS Depression at Time 1 Predicting Negative Attributions at Time 2
Note. N = 193. DASS Depression = Depression Anxiety Stress Scales-21: Depression subscale.
Negative Attributions – Time 2
Variable β SE sr p
Time 1
CHAPTER 2
Attributions and Criticism in Black and White: Perceived Criticism in a
Abstract
Attributions and Criticism in Black and White: Perceived Criticism in a
Community Sample of Black and White Participants
Criticism from close family members is a strong predictor of poor patient outcomes for an array of psychological disorders (Butzlaff & Hooley, 1998). The traditional measure of relatives’ criticism is the Camberwell Family Interview (CFI), an hour-long semi-structured interview with the relative about his/her experiences with the patient in the previous three months (Vaughn & Leff, 1976). The CFI is audio-recorded and then coded for the extent to which the relative expresses critical comments about the patient. Seeking to devise a less time-intensive assessment of relatives’ criticism, Hooley and Teasdale (1989) developed the Perceived Criticism Measure (PCM), a single item (“How critical do you think your relative is of you?”) of which has become the gold standard measure of perceived criticism. The researchers posited that this single item may be a better predictor of patient outcome than CFI-rated criticism because it represents the totality of criticism that the patient is taking in. The PCM has been shown to predict poor outcome for patients with schizophrenia, anxiety, mood disorders, and substance use disorders (see review by Masland & Hooley, 2015). Moreover, consistent with Hooley and Teasdale’s (1989) hypothesis, perceived criticism as measured by the PCM was found to be a stronger predictor of clinical outcomes than criticism extracted from the CFI (Chambless & Steketee, 1999; Hooley & Teasdale, 1989). Thus, the PCM may not only be a more practical tool for assessing criticism in the patient’s family environment than traditional methods but also a more powerful one.
warrant further investigation. Research demonstrates that patients’ perceptions of criticism partially reflect the criticism that is actually displayed in the family
environment. For example, previous studies have found that patients’ reports of perceived criticism show medium to large correlations with relatives’ self-reported criticism and observer ratings of relatives’ criticism toward the patient (Chambless & Blake, 2009; Chambless, Bryan, Aiken, Steketee, & Hooley, 1999). Yet, even after observers’ and relatives’ reports are accounted for, considerable unexplained variance in perceived criticism remains with attributions of criticism explaining a portion of this variance. Attributions of criticism refer to the explanations individuals make about the intentions prompting their loved ones’ criticism. Consider a father who tells his daughter that he does not like her friends. When the daughter states that her father’s comments were critical, she is reporting perceived criticism from him. By contrast, when she makes judgments about the motives driving his criticism, she is making attributions. These attributions may be positive (e.g., “My father cares about me and doesn’t want me to get caught up in the wrong crowd”) or negative (“My father doesn’t want me to have fun and is trying to attack my choice of friends”). The types of attributions that an individual makes are theorized to affect the level and type of criticism that this person perceives from his/her relative (Weiner, 1986). For instance, if the daughter in our example makes predominantly negative attributions about her father’s criticism, it is hypothesized that she will be more likely to perceive his criticism as harsh and hurtful.
measure attributions made about criticism, Allred and Chambless (2013, 2014) found a positive relationship between positive attributions and perceived constructive criticism and between negative attributions and perceived destructive criticism in undergraduate and community samples. Seeking to provide greater evidence for a causal link between attributions and perceived criticism, Allred and Chambless (2017) conducted a
longitudinal study in an undergraduate sample which showed that positive attributions predicted increases in perceived constructive criticism whereas negative attributions predicted increases in destructive criticism over time. Together these findings, though correlational, suggest that attributions are an important factor in the perception of criticism and provide greater support for a causal relationship between these constructs than can cross-sectional analyses alone.
Refinement of the Perceived Criticism Measure (PCM)
Hooley and Teasdale’s (1989) PCM remains the gold standard measure of perceived criticism, yet evidence is mounting that this measure is in need of refinement. For example, research has shown that individuals are able to differentiate between
may be a more robust predictor of poor patient outcome than the PCM, although this remains to be tested. Additionally, the differences in attributions that predict the types of perceived criticism further support the utility of focusing on constructive and destructive criticism as distinct components of perceived criticism.
Another focus of refinement of the perceived criticism construct may be to devote greater attention to a related construct – how upset individuals become in response to criticism from their relatives. According to the stress-vulnerability hypothesis of expressed emotion and perceived criticism’s effects on treatment outcome (Hooley & Gotlib, 2000), criticism should affect a patient’s response to treatment only to the degree that he or she finds it distressing. Although the PCM includes an item assessing upset due to criticism, few studies have explored this facet of perceived criticism. However,
about his comments. To explore this hypothesis, we examined the relationship between attributions and upset due to criticism in the current investigation.
Racial Differences in Attributions and Perceived Criticism
Cross-cultural research indicates that perceptions of criticism may vary across racial/ethnic lines. In particular, differences in perceptions of criticism have emerged between Blacks and Whites, with prior research demonstrating that observer ratings of relatives’ criticism and patient perceived criticism are significantly correlated among Whites but not Blacks (Weisman, Rosales, Kymalainen, & Armesto, 2006). Previous studies have also shown that observer ratings of relatives’ criticism predict relapse and other poor clinical outcomes for Whites but not for Blacks; yet perceived criticism is associated with poor outcome in both racial groups (Guada, Brekke, Floyd, & Barbour, 2009; Guada, Hoe, Floyd, Barbour, & Brekke, 2011; Rosenfarb, Bellack, & Aziz, 2006; Rosenfarb, Bellack, Aziz, Kratz, & Sayers, 2004; Tompson et al., 1995). It may be that observer ratings of criticism, which in research studies are unlikely to have been made by Black coders, do not capture what Blacks perceive as critical, resulting in no association between observed criticism and poor outcome. However, when Blacks themselves rate their relatives as critical, these perceived criticism ratings do predict poor outcomes. The significant association between patient-perceived (but not observer-rated) criticism and clinical outcomes among Blacks highlights the importance of investigating perceived criticism and its antecedents more closely in this racial group.
Prior research also suggests that there may be racial differences in the attributions individuals make about their relatives’ criticism. Drawing on findings showing no
al.(2004) proposed that Blacks may perceive some criticism from their loved ones as an indication of care or concern. This hypothesis suggests that Blacks make different,
potentially more positive attributions about their relatives’ criticism than Whites, and that these attributions influence their perceptions of criticism. In line with this view, in their community sample Allred and Chambless (2014) found that Blacks reported more positive attributions than Whites. However, they also perceived greater destructive criticism then their White counterparts, and there was some evidence to suggest that they made more negative attributions as well. Allred and Chambless (2014) noted that these racial differences may have been due to an extreme response bias among Blacks, that is, a tendency to use the high end of rating scales regardless of content. Given that this
investigation was the first to explore racial differences in attributions and perceived constructive and destructive criticism, efforts to replicate these findings employing methods to control for the effects of response bias are essential.
The Current Investigation
constructive criticism. For these reasons, in this study we examined positive attributions as a predictor of greater perceived constructive criticism and negative attributions as a predictor of greater destructive criticism. We also examined the relationship between type of attribution and upset due to criticism. We expected positive attributions to be related to less upset and negative attributions to greater upset in our sample.
Another principal goal of the current investigation was to replicate the findings of Allred and Chambless (2014) by examining mean differences in attributions and
Method
Participants
Black and White community members were recruited through community flyering, internet forums, and social media sites. To participate, individuals had to be 18 years of age or older. Of the initial 343 participants who consented to participate in the study, 71 were excluded for various reasons: 25 participants for not completing the majority of study measures, 11 for not meeting inclusion criteria, 8 for not nominating a romantic partner or parental figure as the most important or influential person in their lives, and 3 for not nominating a relative who was of the same race. Following quality control checks, 18 participants were excluded for having duplicate IP addresses, 9 were deleted from the data set for failing questions (e.g., CAPTCHA questions) designed to detect spambots, and 7 were excluded for having foreign IP addresses or IP addresses known to produce spam. Finally, one participant was excluded for having less than seven years of education because we believed it unlikely that an individual with less than a seventh grade education would be able to validly complete study measures. Thus, the final sample comprised 272 individuals, of whom 160 (58.8%) were Black and 112 (41.2%) were White. Of the Blacks in the sample, 78 (48.8%) were women and 82 (51.2%) were men. Of the Whites, 76 (67.9%) were women and 36 (32.1%) were men. Participants ranged in age from 18 to 64 years (M = 32.23, SD = 8.12). Their years of education ranged from 7 to 27 years (M = 16.96, SD = 3.69) with the majority of
participants (87.4%) reporting having completed at least some postsecondary education.
The study was advertised to potential participants as a survey on criticism in close relationships. Participants were provided with the link to the online survey through which they could initiate participation in the study. In compensation for their participation, participants each received a $5 Amazon gift card.
Previous research has shown perceived criticism to have its greatest negative impact on clinical outcomes when individuals are living with the relative whom they perceive to be critical (Renshaw, 2007). However, cohabitation and relatives’ influence may be conflated in these studies, since individuals tend to live with the most influential or impactful people in their lives. There is evidence to suggest that this might not be the case among Blacks and other racial/ethnic minority groups in which the extended family system assumes greater importance (Gerstel, 2011). For these reasons, participants in the current study were asked to indicate the most influential person in their lives (regardless of whether they were cohabitating with this person) who was restricted to be either a romantic partner or someone who has acted as a parent (e.g., parent, grandparent, aunt/uncle, guardian). Because research on criticism has shown that romantic partners and parents tend to be more critical than siblings, participants who nominated siblings as the most influential person in their lives were excluded from the current sample (Hooley & Richters, 1995). To increase the homogeneity of the sample, the most
provided informed consent. Study measures and procedures were approved by the Institutional Review Board of the University of Pennsylvania.
Measures
Relationship variables. Participants completed questions about the duration of their relationship with the most influential/impactful person in their lives as well as the average amount of time spent each day with this person during waking hours in the past week.
Brief Warmth Scale. The Parental Bonding Instrument (PBI; Parker, Tupling, & Brown, 1979) is a self-report measure of the amount of care and protection exhibited by parents toward their children. Previously collected PBI Care scale data provided by a sample of University of Pennsylvania undergraduates were used to create a brief six-item warmth scale for the present study (Allred & Chambless, 2013b). A reliable short form of the warmth scale was created with the first half of this data set, and the scale’s reliability was confirmed in the second half (α =.83). Item stems from the PBI were amended to allow participants to respond regarding the most influential/impactful person in their lives. Internal consistency in the present sample was acceptable for both Blacks (α = .77) and Whites (α = .72).
you, to what extent do you believe he/she is trying to put you down?” Participants responded to these items on a Likert-type scale ranging from 1 (not at all) to 5 (completely). Previous psychometric works on the Attributions of Criticism Scale
indicated that the scale demonstrated a two-factor structure with factors corresponding to positive and negative attributions (Allred & Chambless, 2014, 2017), good test-retest reliability, and convergent and discriminant validity with measures of perceived criticism and psychopathology, respectively (Allred & Chambless, 2017). The psychometric properties of the Attributions of Criticism Scale in the current sample are discussed below (see Results).
Perceived Criticism Measure (PCM; Hooley & Teasdale, 1989). The PCM asks individuals to respond to the following question: “How critical do you think your
relative/romantic partner is of you?” which is rated on a 10-point Likert-type scale ranging from 1 (not at all critical) to 10 (very critical). This criticism item is the gold standard measure of perceived criticism and has demonstrated good test-retest reliability (Hooley & Teasdale, 1989), discriminant validity with measures of psychopathology (Renshaw, 2008), and predictive validity in its prediction of poor treatment outcome for a number of mental disorders (Masland & Hooley, 2015).
obsessive-compulsive disorder, and bipolar disorder (Miklowitz et al., 2005; Steketee et al., 2007). Only the PCM upset item was used as an outcome in our analyses.2
Perceived Criticism Measure – Type (PCM-T; Renshaw et al., 2010). To assess different forms of perceived criticism, Renshaw et al. (2010) developed the PCM-T, which measures perceived constructive and destructive criticism separately. A modified version of the PCM-T was used in the current study. Participants responded to the following questions: “When your relative is critical of you, how harsh or hurtful is he/she?” rated on a scale from 1 (not at all harsh/hurtful) to 10 (very harsh/hurtful) and “When your relative is critical of you, how helpful or constructive is he/she?” rated on a scale from 1 (not at all constructive/helpful) to 10 (very constructive/helpful). Previous research has shown moderate to large correlations between perceived destructive
criticism and the standard PCM criticism item, whereas little relationship has been found between perceived constructive criticism and PCM-criticism (Allred & Chambless, 2014, 2017; Renshaw et al., 2010). Perceived constructive and destructive criticism have also demonstrated good test-retest reliability in an undergraduate sample (Allred &
Chambless, 2017).
Extreme Response Style Measure (Greenleaf, 1992). Greenleaf developed a
measure of extreme response style comprising 16 items that exhibit low intercorrelations and equal extreme response proportions (i.e., the proportion of respondents who answer extremely is approximately equal for all items). Items include “Everyone should use mouthwash to help control bad breath” and “I like to visit places that are totally different from my home” and are rated as true or false. In the current study, to mimic the format of
2 Because the reader may be interested in the correlations between the standard PCM criticism item and
the PCM-T, a modified version of the scale was employed in which participants responded to each item on a 10-point Likert-type scale ranging from 1 (definitely
disagree) to 10 (definitely agree) instead of the 5-point Likert-type scale employed in the original measure. For each participant, an extreme response style score was computed by calculating the proportion of items the participant answered at the extremes of the scale (i.e., scoring a 1 or 2 or a 9 or 10 on the 10-point scale).
Demographics. Demographic information including age, race, gender, and years
of education was collected from each participant.
Results
Descriptive Statistics for Relationship Variables
The majority (64.7%) of participants nominated a romantic partner/spouse as the most important/influential person in their lives. The average length of relationship with the relative/partner was 10.89 years (SD = 7.10) among those who nominated romantic partners/spouses and 27.63 years (SD = 9.38) among those who nominated parents. On average participants who nominated a romantic partner/spouse reported spending 5.90 hours (SD = 4.78) with their relative whereas those who nominated a parent reported spending 2.47 hours (SD = 3.63) with their relative during waking hours on an average day during the previous week.
Psychometric Tests of the Attributions of Criticism Scale
Factor Analysis. We aimed to confirm the ACS two-factor structure
indicators are employed because CFAs require items to load on one factor only, an assumption that is often too restrictive in psychological research. As a result, Marsh et al. (2014) propose the use of exploratory structural equation modeling (ESEM) which permits all factor loadings and cross-loadings to be estimated within a specified factor structure.
Consistent with the recommendations of Marsh et al. (2014), we first conducted a CFA because CFA represents the simplest solution when the model fits the data
adequately. Given the sensitivity of the chi-square statistic to sample size (Cheung & Rensvold, 2002), we used the CFI and RMSEA statistics to assess model fit. Results of the CFA indicated inadequate fit based on the RMSEA: χ2 (188) = 718.82, p < .001; CFI = .95; RMSEA = .10. We then conducted an ESEM in Mplus (Muthén & Muthén, 2007)
using WLSMV estimation and geomin rotation which resulted in improved fit: χ2 (169) = 443.43, p < .001; CFI = .97; RMSEA = .08.Consistent with the findings of Allred and Chambless (2014, 2017), the ACS demonstrated a two-factor structure in the current sample with factors corresponding to positive and negative attributions (see Table 1 for factor loadings). The attributions subscales demonstrated excellent internal consistency for both Blacks (α = .93 for positive attributions, α = .94 for negative attribution) and Whites (α = .91 for positive attributions, α = .96 for negative attributions) and were minimally correlated in the whole sample (r = -.19).
Measurement Invariance across Race. Measurement invariance of the ACS
invariance with categorical responses because both parameters affect the item probability curve. Therefore, in the first model, factor loadings and intercepts were allowed to vary freely between Blacks and Whites (Model 1: χ2 (366) = 985.83, p < .001; CFI = .947; RMSEA = .112). In the second model, factor loadings and intercepts were constrained to be equal across race (Model 2: χ2 (446) = 1136.16, p < .001; CFI = .941; RMSEA = .107). Given that the CFI and RMSEA are relatively robust to model complexity, sample size, and violations of the normality assumption compared to the chi-square statistic, Chen (2007) recommends using the differences in CFI and RMSEA values across nested models when testing for measurement invariance. According to Chen’s
recommendations, the null hypothesis of measurement invariance should not be rejected if (a) the difference in CFI is less than -.005 and (b) the difference in RMSEA is less than .01. Because the change in CFI across nested models exceeded the criterion for
invariance proposed by Chen (2007) but the change in RMSEA did not (both criteria must be met in order to establish measurement invariance), our results provide
Racial Differences in Extreme Responding
Extreme response scores in the full sample ranged from 0 to .88 (M = .27, SD = .21) and were slightly positively skewed in their distribution (skewness = 0.56, SE = 0.15). Internal consistency was quite high among Blacks and Whites (α = .71 in both groups) indicating that participants were answering consistently within a particular area of the 10-point scale. This pattern is to be expected among items that are reliably
capturing extreme response bias when it is present (Greenleaf, 1992). We then tested for racial differences in extreme responding scores, and results showed that there was no difference in extreme responding between Blacks and Whites in our sample, t(267.04) = 0.60, p =.55, d = 0.07, 95% CI [-0.17, 0.32]. However, because participants’ extreme responding scores were correlated with both predictors (attributions) and outcomes of interest (type of perceived criticism or upset due to criticism), they were included as a
covariate in regression analyses (see Table 2) to reduce the effects of response bias.
Data Analytic Strategy
Zero-order correlations were examined to identify potential confounding variables to include as covariates in regression analyses. Participant gender, age, years of
education, extreme responding score, relationship length, and number of waking hours spent with the relative were included as covariates in analyses because they were
significantly correlated with one or more of our outcomes of interest (attributions, type of perceived criticism, upset due to criticism, or warmth). For consistency, the same
covariates were included in each regression analysis. To reduce multicollinearity,
variables included in interaction terms were mean-centered. Non-significant interactions were trimmed from analyses, and those that emerged as significant were probed
according to the recommendations of Aiken and West (1991). To determine that data did not violate the assumptions of multiple regression, diagnostic indices including condition indexes, dfbetas, sdbetas, and residual distributions were examined for all regression analyses.
A power analysis conducted with G*Power 3 (Faul, Erdfelder, Lang, & Buchner, 2007) indicated that in a sample of 272 participants, there was 84.7% power to detect a small-medium effect size of f2 = .09 in a linear regression with 20 predictors (the most included in any model).
Racial Differences in Mean Levels of Attributions, Perceived Criticism, Upset Due
to Criticism, and Warmth
We hypothesized that there would be racial differences in mean levels of
and destructive criticism, upset due to criticism, and warmth were conducted with dummy-coded race as the predictor and gender, age, years of education, extreme responding score, relationship length, and number of waking hours spent together as covariates3. The semi-partial correlation (sr) for the dummy-coded race variable was examined in each regression because it represents the unique effect of race when controlling for the other variables in the model.
Contrary to prediction, Blacks and Whites did not significantly differ on mean levels of positive attributions (β = .04, sr = .04, p = .58), negative attributions (β = .00, sr
= .00, p = .10), perceived constructive criticism (β = .07, sr = .06, p = .40), destructive criticism (β = -.03, sr = -.03, p = .69), or warmth, β = .10, sr = .09, p = .15. However, Whites did report being more upset by perceived criticism from their relatives than Blacks, β = .16, sr = .14, p = .03.
Attributions, Perceived Criticism, and Upset Due to Criticism
We predicted that positive attributions would be associated with greater perceived constructive criticism and less upset due to criticism, whereas negative attributions would be related to greater perceived destructive criticism and more upset. Multiple regression analyses were used to test these hypotheses, and in all regressions gender, age, years of education, extreme responding score, relationship length, and number of waking hours were included as covariates. As predicted, positive attributions were associated with more perceived constructive (β = .69, sr = .67, p < .001) criticism and less upset (β = -.20, sr = -.20, p = .002). Conversely, negative attributions were associated with more destructive
3 Substantive results were not affected by controlling for extreme responding. See Appendix A for results
criticism (β = .71, sr = .60, p < .001) and greater upset (β = .53, sr = .45, p < .001). There were no significant interactions of attributions with race, all ps> .06.
Contributions of Relatives’ Warmth
Findings from the criticism literature suggest that relatives’ warmth might be a significant predictor of perceived criticism as well as a moderator of the effect of
attributions on perceived criticism. In our analyses, warmth significantly predicted more perceived constructive criticism (β = .61, sr = .54, p < .001), less destructive criticism (β = -.53, sr = -.47, p < .001), and less upset (β = -.43, sr = -.38, p < .001) when race, gender, age, years of education, extreme responding score, relationship length, and number of waking hours spent together were controlled.
We then examined whether there were racial differences in the effect of warmth on perceived criticism and upset due to criticism. In a regression predicting upset from negative attributions, a significant interaction of race and warmth emerged. See Table 4. When the interaction was probed, results showed that Whites reported greater upset than Blacks at average (β = .15, sr = .13, p = .02) and high levels of warmth (β = .37, sr = .25,
p < .001) but not at low levels of warmth, β = -.07, sr = -.04, p = .43. However, warmth did not significantly moderate the effects of attributions, all ps > .07.
Relative Type and Perceived Criticism